Japan Pupillometer Market

ID: MRFR/HC/50745-HCR
200 Pages
Rahul Gotadki
Last Updated: February 06, 2026
Japan Pupillometer Market Research Report: Size, Share, Trend Analysis By Mobility (Table-top, Hand-held), By Types (Video, Digital), By End use (Hospitals, Eye Clinics, Others) andBy Applications (Ophthalmology, Neurology, Oncology, Others) - Growth Outlook & Industry Forecast 2025 To 2035
Download PDF ×

We do not share your information with anyone. However, we may send you emails based on your report interest from time to time. You may contact us at any time to opt-out.

Japan Pupillometer Market

Market Size

Forecast Period2025 - 2035
CAGR (2025 - 2035)7.22%
2024 Market Size$ 16.17 Million
2025 Market Size$ 17.34 Million
2035 Market Size$ 34.8 Million

Key Players

Neuroptics
PupilMetrics
Oculus
Eyetec
MediGage
Clement Clarke International
Opportunities
  • Rising Demand for Diagnostic Tools
  • Government Initiatives for Eye Care
  • Growing Focus on Preventive Healthcare
  1. 1 SECTION I: EXECUTIVE SUMMARY AND KEY HIGHLIGHTS
    1. 1.1 EXECUTIVE SUMMARY
      1. 1.1.1 Market Overview
      2. 1.1.2 Key Findings
      3. 1.1.3 Market Segmentation
      4. 1.1.4 Competitive Landscape
      5. 1.1.5 Challenges and Opportunities
      6. 1.1.6 Future Outlook
  2. 2 SECTION II: SCOPING, METHODOLOGY AND MARKET STRUCTURE
    1. 2.1 MARKET INTRODUCTION
      1. 2.1.1 Definition
      2. 2.1.2 Scope of the study
        1. 2.1.2.1 Research Objective
        2. 2.1.2.2 Assumption
        3. 2.1.2.3 Limitations
    2. 2.2 RESEARCH METHODOLOGY
      1. 2.2.1 Overview
      2. 2.2.2 Data Mining
      3. 2.2.3 Secondary Research
      4. 2.2.4 Primary Research
        1. 2.2.4.1 Primary Interviews and Information Gathering Process
        2. 2.2.4.2 Breakdown of Primary Respondents
      5. 2.2.5 Forecasting Model
      6. 2.2.6 Market Size Estimation
        1. 2.2.6.1 Bottom-Up Approach
        2. 2.2.6.2 Top-Down Approach
      7. 2.2.7 Data Triangulation
      8. 2.2.8 Validation
  3. 3 SECTION III: QUALITATIVE ANALYSIS
    1. 3.1 MARKET DYNAMICS
      1. 3.1.1 Overview
      2. 3.1.2 Drivers
      3. 3.1.3 Restraints
      4. 3.1.4 Opportunities
    2. 3.2 MARKET FACTOR ANALYSIS
      1. 3.2.1 Value chain Analysis
      2. 3.2.2 Porter's Five Forces Analysis
        1. 3.2.2.1 Bargaining Power of Suppliers
        2. 3.2.2.2 Bargaining Power of Buyers
        3. 3.2.2.3 Threat of New Entrants
        4. 3.2.2.4 Threat of Substitutes
        5. 3.2.2.5 Intensity of Rivalry
      3. 3.2.3 COVID-19 Impact Analysis
        1. 3.2.3.1 Market Impact Analysis
        2. 3.2.3.2 Regional Impact
        3. 3.2.3.3 Opportunity and Threat Analysis
  4. 4 SECTION IV: QUANTITATIVE ANALYSIS
    1. 4.1 Chemicals and Materials, BY Mobility (USD Million)
      1. 4.1.1 Table-top
      2. 4.1.2 Hand-held
    2. 4.2 Chemicals and Materials, BY Type (USD Million)
      1. 4.2.1 Video
      2. 4.2.2 Non-Video
    3. 4.3 Chemicals and Materials, BY End-use (USD Million)
      1. 4.3.1 Hospitals
      2. 4.3.2 Eye Clinics
      3. 4.3.3 Others
    4. 4.4 Chemicals and Materials, BY Application (USD Million)
      1. 4.4.1 Ophthalmology
      2. 4.4.2 Neurology
      3. 4.4.3 Oncology
      4. 4.4.4 Others
  5. 5 SECTION V: COMPETITIVE ANALYSIS
    1. 5.1 Competitive Landscape
      1. 5.1.1 Overview
      2. 5.1.2 Competitive Analysis
      3. 5.1.3 Market share Analysis
      4. 5.1.4 Major Growth Strategy in the Chemicals and Materials
      5. 5.1.5 Competitive Benchmarking
      6. 5.1.6 Leading Players in Terms of Number of Developments in the Chemicals and Materials
      7. 5.1.7 Key developments and growth strategies
        1. 5.1.7.1 New Product Launch/Service Deployment
        2. 5.1.7.2 Merger & Acquisitions
        3. 5.1.7.3 Joint Ventures
      8. 5.1.8 Major Players Financial Matrix
        1. 5.1.8.1 Sales and Operating Income
        2. 5.1.8.2 Major Players R&D Expenditure. 2023
    2. 5.2 Company Profiles
      1. 5.2.1 Neuroptics (US)
        1. 5.2.1.1 Financial Overview
        2. 5.2.1.2 Products Offered
        3. 5.2.1.3 Key Developments
        4. 5.2.1.4 SWOT Analysis
        5. 5.2.1.5 Key Strategies
      2. 5.2.2 PupilMetrics (US)
        1. 5.2.2.1 Financial Overview
        2. 5.2.2.2 Products Offered
        3. 5.2.2.3 Key Developments
        4. 5.2.2.4 SWOT Analysis
        5. 5.2.2.5 Key Strategies
      3. 5.2.3 Oculus (DE)
        1. 5.2.3.1 Financial Overview
        2. 5.2.3.2 Products Offered
        3. 5.2.3.3 Key Developments
        4. 5.2.3.4 SWOT Analysis
        5. 5.2.3.5 Key Strategies
      4. 5.2.4 Eyetec (DE)
        1. 5.2.4.1 Financial Overview
        2. 5.2.4.2 Products Offered
        3. 5.2.4.3 Key Developments
        4. 5.2.4.4 SWOT Analysis
        5. 5.2.4.5 Key Strategies
      5. 5.2.5 MediGage (US)
        1. 5.2.5.1 Financial Overview
        2. 5.2.5.2 Products Offered
        3. 5.2.5.3 Key Developments
        4. 5.2.5.4 SWOT Analysis
        5. 5.2.5.5 Key Strategies
      6. 5.2.6 Clement Clarke International (GB)
        1. 5.2.6.1 Financial Overview
        2. 5.2.6.2 Products Offered
        3. 5.2.6.3 Key Developments
        4. 5.2.6.4 SWOT Analysis
        5. 5.2.6.5 Key Strategies
      7. 5.2.7 Huvitz (KR)
        1. 5.2.7.1 Financial Overview
        2. 5.2.7.2 Products Offered
        3. 5.2.7.3 Key Developments
        4. 5.2.7.4 SWOT Analysis
        5. 5.2.7.5 Key Strategies
      8. 5.2.8 Kowa Company (JP)
        1. 5.2.8.1 Financial Overview
        2. 5.2.8.2 Products Offered
        3. 5.2.8.3 Key Developments
        4. 5.2.8.4 SWOT Analysis
        5. 5.2.8.5 Key Strategies
    3. 5.3 Appendix
      1. 5.3.1 References
      2. 5.3.2 Related Reports
  6. 6 LIST OF FIGURES
    1. 6.1 MARKET SYNOPSIS
    2. 6.2 JAPAN MARKET ANALYSIS BY MOBILITY
    3. 6.3 JAPAN MARKET ANALYSIS BY TYPE
    4. 6.4 JAPAN MARKET ANALYSIS BY END-USE
    5. 6.5 JAPAN MARKET ANALYSIS BY APPLICATION
    6. 6.6 KEY BUYING CRITERIA OF CHEMICALS AND MATERIALS
    7. 6.7 RESEARCH PROCESS OF MRFR
    8. 6.8 DRO ANALYSIS OF CHEMICALS AND MATERIALS
    9. 6.9 DRIVERS IMPACT ANALYSIS: CHEMICALS AND MATERIALS
    10. 6.10 RESTRAINTS IMPACT ANALYSIS: CHEMICALS AND MATERIALS
    11. 6.11 SUPPLY / VALUE CHAIN: CHEMICALS AND MATERIALS
    12. 6.12 CHEMICALS AND MATERIALS, BY MOBILITY, 2024 (% SHARE)
    13. 6.13 CHEMICALS AND MATERIALS, BY MOBILITY, 2024 TO 2035 (USD Million)
    14. 6.14 CHEMICALS AND MATERIALS, BY TYPE, 2024 (% SHARE)
    15. 6.15 CHEMICALS AND MATERIALS, BY TYPE, 2024 TO 2035 (USD Million)
    16. 6.16 CHEMICALS AND MATERIALS, BY END-USE, 2024 (% SHARE)
    17. 6.17 CHEMICALS AND MATERIALS, BY END-USE, 2024 TO 2035 (USD Million)
    18. 6.18 CHEMICALS AND MATERIALS, BY APPLICATION, 2024 (% SHARE)
    19. 6.19 CHEMICALS AND MATERIALS, BY APPLICATION, 2024 TO 2035 (USD Million)
    20. 6.20 BENCHMARKING OF MAJOR COMPETITORS
  7. 7 LIST OF TABLES
    1. 7.1 LIST OF ASSUMPTIONS
  8. 7.1.1
    1. 7.2 Japan MARKET SIZE ESTIMATES; FORECAST
      1. 7.2.1 BY MOBILITY, 2025-2035 (USD Million)
      2. 7.2.2 BY TYPE, 2025-2035 (USD Million)
      3. 7.2.3 BY END-USE, 2025-2035 (USD Million)
      4. 7.2.4 BY APPLICATION, 2025-2035 (USD Million)
    2. 7.3 PRODUCT LAUNCH/PRODUCT DEVELOPMENT/APPROVAL
  9. 7.3.1
    1. 7.4 ACQUISITION/PARTNERSHIP
  10. 7.4.1

Japan Chemicals and Materials Market Segmentation

Chemicals and Materials By Mobility (USD Million, 2025-2035)
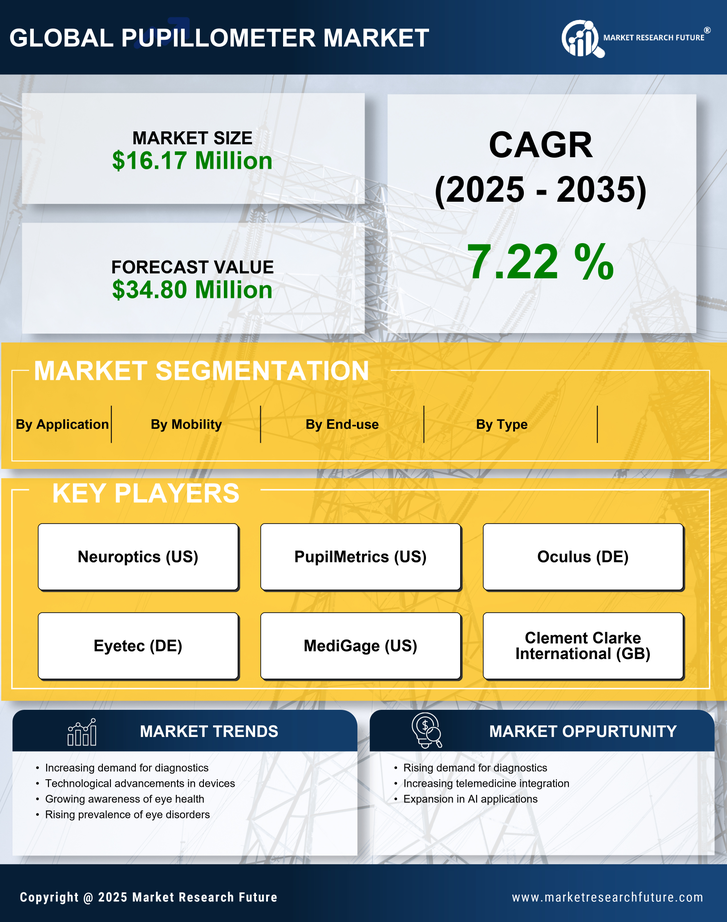
  • Table-top
  • Hand-held

Chemicals and Materials By Type (USD Million, 2025-2035)

  • Video
  • Non-Video

Chemicals and Materials By End-use (USD Million, 2025-2035)

  • Hospitals
  • Eye Clinics
  • Others

Chemicals and Materials By Application (USD Million, 2025-2035)

  • Ophthalmology
  • Neurology
  • Oncology
  • Others