Japan Japan Data Center Outsourcing Infrastructure Utility Services Market Segmentation
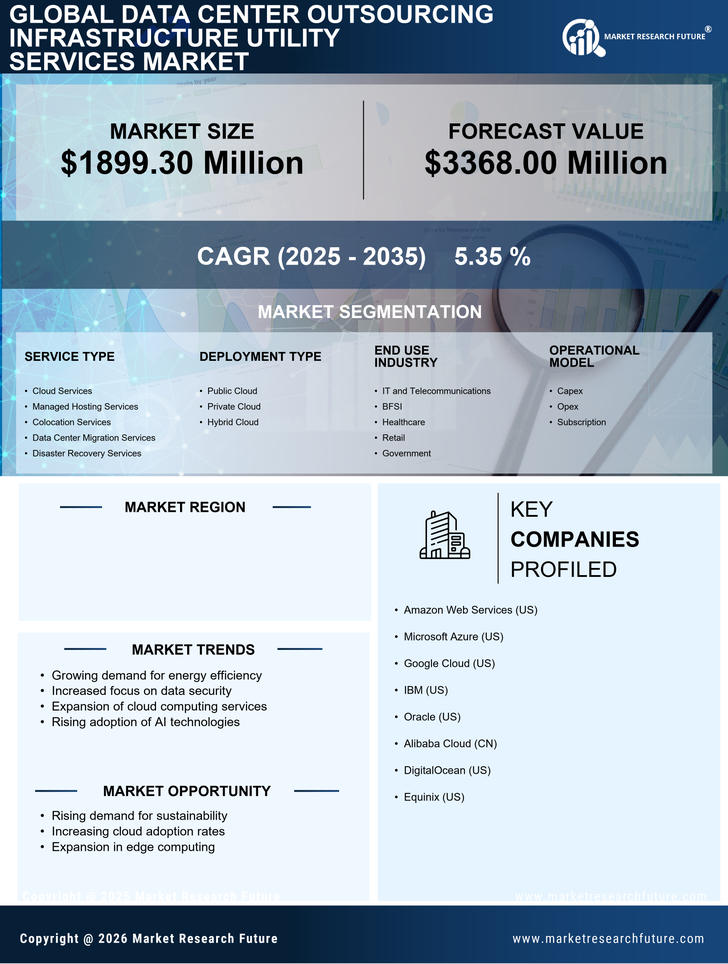
Japan Data Center Outsourcing Infrastructure Utility Services Market By Service Type (USD Million, 2025-2035)
- Cloud Services
- Managed Hosting Services
- Colocation Services
- Data Center Migration Services
- Disaster Recovery Services
Japan Data Center Outsourcing Infrastructure Utility Services Market By Deployment Type (USD Million, 2025-2035)
- Public Cloud
- Private Cloud
- Hybrid Cloud
Japan Data Center Outsourcing Infrastructure Utility Services Market By End Use Industry (USD Million, 2025-2035)
- IT and Telecommunications
- BFSI
- Healthcare
- Retail
- Government
Japan Data Center Outsourcing Infrastructure Utility Services Market By Operational Model (USD Million, 2025-2035)
- Capex
- Opex
- Subscription