Japan Account Payable Market

ID: MRFR/BS/44368-HCR
200 Pages
Kiran Jinkalwad
Last Updated: April 06, 2026
Japan Accounts Payable Market Size, Share and Research Report By Component (Solution, Service-Managed, Professional), By Deployment (On-Premise, Cloud), By Enterprise Size (Large Enterprises, Small Enterprises, Medium Enterprises), and By Vertical (BFSI, Retail Consumer Goods, Energy Utility, Healthcare, IT and Telecommunication, Manufacturing, Other) - Industry Forecast Till 2035
Download PDF ×

We do not share your information with anyone. However, we may send you emails based on your report interest from time to time. You may contact us at any time to opt-out.

Japan Account Payable Market

Market Size

Forecast Period2025 - 2035
CAGR (2025 - 2035)6.9%
2024 Market Size$ 63.45 Million
2025 Market Size$ 67.83 Million
2035 Market Size$ 132.2 Million

Key Players

SAP
Oracle
Coupa Software
Basware
Tipalti
Bill.com
Opportunities
  • Shift Towards Digital Payment Solutions
  • Regulatory Changes and Compliance Requirements
  • Rising Demand for Real-Time Financial Insights
  1. 1 SECTION I: EXECUTIVE SUMMARY AND KEY HIGHLIGHTS
    1. 1.1 EXECUTIVE SUMMARY
      1. 1.1.1 Market Overview
      2. 1.1.2 Key Findings
      3. 1.1.3 Market Segmentation
      4. 1.1.4 Competitive Landscape
      5. 1.1.5 Challenges and Opportunities
      6. 1.1.6 Future Outlook
  2. 2 SECTION II: SCOPING, METHODOLOGY AND MARKET STRUCTURE
    1. 2.1 MARKET INTRODUCTION
      1. 2.1.1 Definition
      2. 2.1.2 Scope of the study
        1. 2.1.2.1 Research Objective
        2. 2.1.2.2 Assumption
        3. 2.1.2.3 Limitations
    2. 2.2 RESEARCH METHODOLOGY
      1. 2.2.1 Overview
      2. 2.2.2 Data Mining
      3. 2.2.3 Secondary Research
      4. 2.2.4 Primary Research
        1. 2.2.4.1 Primary Interviews and Information Gathering Process
        2. 2.2.4.2 Breakdown of Primary Respondents
      5. 2.2.5 Forecasting Model
      6. 2.2.6 Market Size Estimation
        1. 2.2.6.1 Bottom-Up Approach
        2. 2.2.6.2 Top-Down Approach
      7. 2.2.7 Data Triangulation
      8. 2.2.8 Validation
  3. 3 SECTION III: QUALITATIVE ANALYSIS
    1. 3.1 MARKET DYNAMICS
      1. 3.1.1 Overview
      2. 3.1.2 Drivers
      3. 3.1.3 Restraints
      4. 3.1.4 Opportunities
    2. 3.2 MARKET FACTOR ANALYSIS
      1. 3.2.1 Value chain Analysis
      2. 3.2.2 Porter's Five Forces Analysis
        1. 3.2.2.1 Bargaining Power of Suppliers
        2. 3.2.2.2 Bargaining Power of Buyers
        3. 3.2.2.3 Threat of New Entrants
        4. 3.2.2.4 Threat of Substitutes
        5. 3.2.2.5 Intensity of Rivalry
      3. 3.2.3 COVID-19 Impact Analysis
        1. 3.2.3.1 Market Impact Analysis
        2. 3.2.3.2 Regional Impact
        3. 3.2.3.3 Opportunity and Threat Analysis
  4. 4 SECTION IV: QUANTITATIVE ANALYSIS
    1. 4.1 BFSI, BY Component (USD Million)
      1. 4.1.1 Solution
      2. 4.1.2 Service-Managed
      3. 4.1.3 Professional
    2. 4.2 BFSI, BY Deployment (USD Million)
      1. 4.2.1 On-Premise
      2. 4.2.2 Cloud
    3. 4.3 BFSI, BY Enterprise Size (USD Million)
      1. 4.3.1 Large Enterprises
      2. 4.3.2 Small Enterprises
      3. 4.3.3 Medium Enterprises
    4. 4.4 BFSI, BY Vertical (USD Million)
      1. 4.4.1 BFSI
      2. 4.4.2 Retail & Consumer Goods
      3. 4.4.3 Energy & Utility
      4. 4.4.4 Healthcare
      5. 4.4.5 IT and Telecommunication
      6. 4.4.6 Manufacturing
      7. 4.4.7 Other
  5. 5 SECTION V: COMPETITIVE ANALYSIS
    1. 5.1 Competitive Landscape
      1. 5.1.1 Overview
      2. 5.1.2 Competitive Analysis
      3. 5.1.3 Market share Analysis
      4. 5.1.4 Major Growth Strategy in the BFSI
      5. 5.1.5 Competitive Benchmarking
      6. 5.1.6 Leading Players in Terms of Number of Developments in the BFSI
      7. 5.1.7 Key developments and growth strategies
        1. 5.1.7.1 New Product Launch/Service Deployment
        2. 5.1.7.2 Merger & Acquisitions
        3. 5.1.7.3 Joint Ventures
      8. 5.1.8 Major Players Financial Matrix
        1. 5.1.8.1 Sales and Operating Income
        2. 5.1.8.2 Major Players R&D Expenditure. 2023
    2. 5.2 Company Profiles
      1. 5.2.1 SAP (DE)
        1. 5.2.1.1 Financial Overview
        2. 5.2.1.2 Products Offered
        3. 5.2.1.3 Key Developments
        4. 5.2.1.4 SWOT Analysis
        5. 5.2.1.5 Key Strategies
      2. 5.2.2 Oracle (US)
        1. 5.2.2.1 Financial Overview
        2. 5.2.2.2 Products Offered
        3. 5.2.2.3 Key Developments
        4. 5.2.2.4 SWOT Analysis
        5. 5.2.2.5 Key Strategies
      3. 5.2.3 Coupa Software (US)
        1. 5.2.3.1 Financial Overview
        2. 5.2.3.2 Products Offered
        3. 5.2.3.3 Key Developments
        4. 5.2.3.4 SWOT Analysis
        5. 5.2.3.5 Key Strategies
      4. 5.2.4 Basware (FI)
        1. 5.2.4.1 Financial Overview
        2. 5.2.4.2 Products Offered
        3. 5.2.4.3 Key Developments
        4. 5.2.4.4 SWOT Analysis
        5. 5.2.4.5 Key Strategies
      5. 5.2.5 Tipalti (US)
        1. 5.2.5.1 Financial Overview
        2. 5.2.5.2 Products Offered
        3. 5.2.5.3 Key Developments
        4. 5.2.5.4 SWOT Analysis
        5. 5.2.5.5 Key Strategies
      6. 5.2.6 Bill.com (US)
        1. 5.2.6.1 Financial Overview
        2. 5.2.6.2 Products Offered
        3. 5.2.6.3 Key Developments
        4. 5.2.6.4 SWOT Analysis
        5. 5.2.6.5 Key Strategies
      7. 5.2.7 Tradeshift (US)
        1. 5.2.7.1 Financial Overview
        2. 5.2.7.2 Products Offered
        3. 5.2.7.3 Key Developments
        4. 5.2.7.4 SWOT Analysis
        5. 5.2.7.5 Key Strategies
      8. 5.2.8 AvidXchange (US)
        1. 5.2.8.1 Financial Overview
        2. 5.2.8.2 Products Offered
        3. 5.2.8.3 Key Developments
        4. 5.2.8.4 SWOT Analysis
        5. 5.2.8.5 Key Strategies
    3. 5.3 Appendix
      1. 5.3.1 References
      2. 5.3.2 Related Reports
  6. 6 LIST OF FIGURES
    1. 6.1 MARKET SYNOPSIS
    2. 6.2 JAPAN MARKET ANALYSIS BY COMPONENT
    3. 6.3 JAPAN MARKET ANALYSIS BY DEPLOYMENT
    4. 6.4 JAPAN MARKET ANALYSIS BY ENTERPRISE SIZE
    5. 6.5 JAPAN MARKET ANALYSIS BY VERTICAL
    6. 6.6 KEY BUYING CRITERIA OF BFSI
    7. 6.7 RESEARCH PROCESS OF MRFR
    8. 6.8 DRO ANALYSIS OF BFSI
    9. 6.9 DRIVERS IMPACT ANALYSIS: BFSI
    10. 6.10 RESTRAINTS IMPACT ANALYSIS: BFSI
    11. 6.11 SUPPLY / VALUE CHAIN: BFSI
    12. 6.12 BFSI, BY COMPONENT, 2024 (% SHARE)
    13. 6.13 BFSI, BY COMPONENT, 2024 TO 2035 (USD Million)
    14. 6.14 BFSI, BY DEPLOYMENT, 2024 (% SHARE)
    15. 6.15 BFSI, BY DEPLOYMENT, 2024 TO 2035 (USD Million)
    16. 6.16 BFSI, BY ENTERPRISE SIZE, 2024 (% SHARE)
    17. 6.17 BFSI, BY ENTERPRISE SIZE, 2024 TO 2035 (USD Million)
    18. 6.18 BFSI, BY VERTICAL, 2024 (% SHARE)
    19. 6.19 BFSI, BY VERTICAL, 2024 TO 2035 (USD Million)
    20. 6.20 BENCHMARKING OF MAJOR COMPETITORS
  7. 7 LIST OF TABLES
    1. 7.1 LIST OF ASSUMPTIONS
  8. 7.1.1
    1. 7.2 Japan MARKET SIZE ESTIMATES; FORECAST
      1. 7.2.1 BY COMPONENT, 2025-2035 (USD Million)
      2. 7.2.2 BY DEPLOYMENT, 2025-2035 (USD Million)
      3. 7.2.3 BY ENTERPRISE SIZE, 2025-2035 (USD Million)
      4. 7.2.4 BY VERTICAL, 2025-2035 (USD Million)
    2. 7.3 PRODUCT LAUNCH/PRODUCT DEVELOPMENT/APPROVAL
  9. 7.3.1
    1. 7.4 ACQUISITION/PARTNERSHIP
  10. 7.4.1

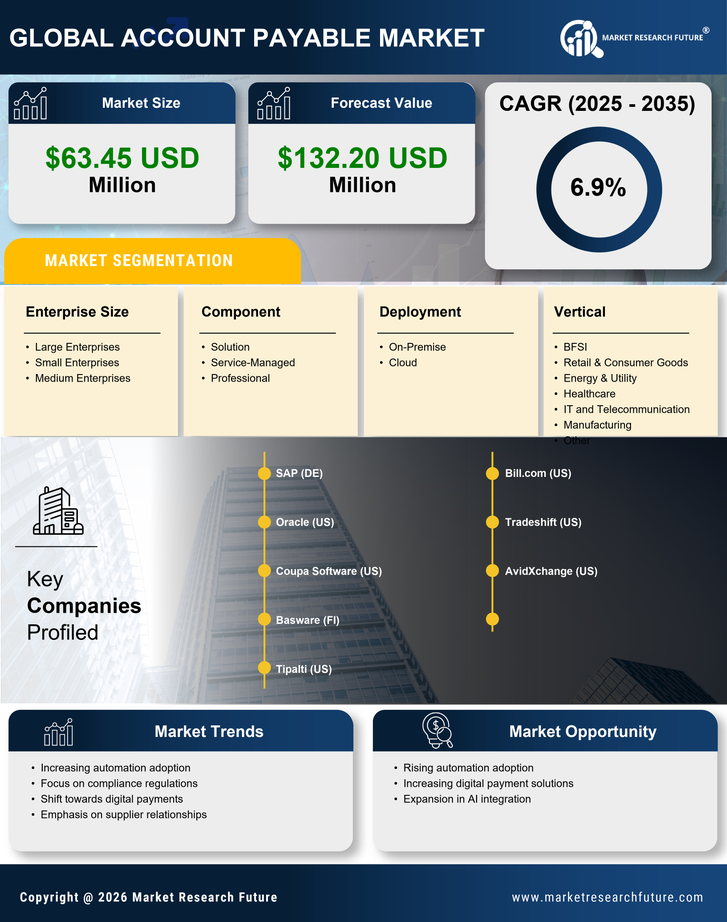
Japan Japan Account Payable Market Segmentation

Japan Account Payable Market By Component (USD Million, 2025-2035)

  • Solution
  • Service-Managed
  • Professional

Japan Account Payable Market By Deployment (USD Million, 2025-2035)

  • On-Premise
  • Cloud

Japan Account Payable Market By Enterprise Size (USD Million, 2025-2035)

  • Large Enterprises
  • Small Enterprises
  • Medium Enterprises

Japan Account Payable Market By Vertical (USD Million, 2025-2035)

  • Japan Account Payable Market
  • Retail & Consumer Goods
  • Energy & Utility
  • Healthcare
  • IT and Telecommunication
  • Manufacturing
  • Other