Italy Industrial Boilers Market

ID: MRFR/EnP/52508-HCR
128 Pages
Snehal Singh
Last Updated: February 06, 2026
Italy Industrial Boilers Market Research Report By Fuel (Natural Gas, Coal, Oil, Others), By Boiler type (Fire-Tube, Water-Tube), By Rated Capacity (0.1 to 0.35 MW, 0.35 to 0.7 MW, 0.7 MW to 1 MW) and By End-User (Food & Beverages, Chemicals, Metal, Plastic, Textile, Wood, Paper, District heating, Others) - Forecast to 2035
Download PDF ×

We do not share your information with anyone. However, we may send you emails based on your report interest from time to time. You may contact us at any time to opt-out.

Italy Industrial Boilers Market

Market Size

Forecast Period2025 - 2035
CAGR (2025 - 2035)12.97%
2024 Market Size$ 153.13 Million
2025 Market Size$ 172.99 Million
2035 Market Size$ 585.89 Million

Key Players

Bosch
General Electric
Siemens
Fulton
Mitsubishi
Babcock & Wilcox
Opportunities
  • Rising Energy Costs and Fuel Prices
  • Increased Focus on Industrial Automation
  • Technological Advancements in Boiler Design
  1. 1 SECTION I: EXECUTIVE SUMMARY AND KEY HIGHLIGHTS
    1. 1.1 EXECUTIVE SUMMARY
      1. 1.1.1 Market Overview
      2. 1.1.2 Key Findings
      3. 1.1.3 Market Segmentation
      4. 1.1.4 Competitive Landscape
      5. 1.1.5 Challenges and Opportunities
      6. 1.1.6 Future Outlook
  2. 2 SECTION II: SCOPING, METHODOLOGY AND MARKET STRUCTURE
    1. 2.1 MARKET INTRODUCTION
      1. 2.1.1 Definition
      2. 2.1.2 Scope of the study
        1. 2.1.2.1 Research Objective
        2. 2.1.2.2 Assumption
        3. 2.1.2.3 Limitations
    2. 2.2 RESEARCH METHODOLOGY
      1. 2.2.1 Overview
      2. 2.2.2 Data Mining
      3. 2.2.3 Secondary Research
      4. 2.2.4 Primary Research
        1. 2.2.4.1 Primary Interviews and Information Gathering Process
        2. 2.2.4.2 Breakdown of Primary Respondents
      5. 2.2.5 Forecasting Model
      6. 2.2.6 Market Size Estimation
        1. 2.2.6.1 Bottom-Up Approach
        2. 2.2.6.2 Top-Down Approach
      7. 2.2.7 Data Triangulation
      8. 2.2.8 Validation
  3. 3 SECTION III: QUALITATIVE ANALYSIS
    1. 3.1 MARKET DYNAMICS
      1. 3.1.1 Overview
      2. 3.1.2 Drivers
      3. 3.1.3 Restraints
      4. 3.1.4 Opportunities
    2. 3.2 MARKET FACTOR ANALYSIS
      1. 3.2.1 Value chain Analysis
      2. 3.2.2 Porter's Five Forces Analysis
        1. 3.2.2.1 Bargaining Power of Suppliers
        2. 3.2.2.2 Bargaining Power of Buyers
        3. 3.2.2.3 Threat of New Entrants
        4. 3.2.2.4 Threat of Substitutes
        5. 3.2.2.5 Intensity of Rivalry
      3. 3.2.3 COVID-19 Impact Analysis
        1. 3.2.3.1 Market Impact Analysis
        2. 3.2.3.2 Regional Impact
        3. 3.2.3.3 Opportunity and Threat Analysis
  4. 4 SECTION IV: QUANTITATIVE ANALYSIS
    1. 4.1 Industrial Automation & Equipment, BY Boiler type (USD Million)
      1. 4.1.1 Natural Gas
      2. 4.1.2 Coal
      3. 4.1.3 Oil
      4. 4.1.4 Others
    2. 4.2 Industrial Automation & Equipment, BY Rated Capacity (USD Million)
      1. 4.2.1 0.1 to 0.35 MW
      2. 4.2.2 0.35 to 0.7 MW
      3. 4.2.3 0.7 to 1 MW
    3. 4.3 Industrial Automation & Equipment, BY Temperature (USD Million)
      1. 4.3.1 Low
      2. 4.3.2 Medium
      3. 4.3.3 High
    4. 4.4 Industrial Automation & Equipment, BY End User (USD Million)
      1. 4.4.1 Chemical
      2. 4.4.2 Food & Beverages
      3. 4.4.3 Metal
      4. 4.4.4 Plastics
      5. 4.4.5 Textile
      6. 4.4.6 Wood
      7. 4.4.7 Paper
      8. 4.4.8 District Heating
      9. 4.4.9 Others
  5. 5 SECTION V: COMPETITIVE ANALYSIS
    1. 5.1 Competitive Landscape
      1. 5.1.1 Overview
      2. 5.1.2 Competitive Analysis
      3. 5.1.3 Market share Analysis
      4. 5.1.4 Major Growth Strategy in the Industrial Automation & Equipment
      5. 5.1.5 Competitive Benchmarking
      6. 5.1.6 Leading Players in Terms of Number of Developments in the Industrial Automation & Equipment
      7. 5.1.7 Key developments and growth strategies
        1. 5.1.7.1 New Product Launch/Service Deployment
        2. 5.1.7.2 Merger & Acquisitions
        3. 5.1.7.3 Joint Ventures
      8. 5.1.8 Major Players Financial Matrix
        1. 5.1.8.1 Sales and Operating Income
        2. 5.1.8.2 Major Players R&D Expenditure. 2023
    2. 5.2 Company Profiles
      1. 5.2.1 Bosch (DE)
        1. 5.2.1.1 Financial Overview
        2. 5.2.1.2 Products Offered
        3. 5.2.1.3 Key Developments
        4. 5.2.1.4 SWOT Analysis
        5. 5.2.1.5 Key Strategies
      2. 5.2.2 General Electric (US)
        1. 5.2.2.1 Financial Overview
        2. 5.2.2.2 Products Offered
        3. 5.2.2.3 Key Developments
        4. 5.2.2.4 SWOT Analysis
        5. 5.2.2.5 Key Strategies
      3. 5.2.3 Siemens (DE)
        1. 5.2.3.1 Financial Overview
        2. 5.2.3.2 Products Offered
        3. 5.2.3.3 Key Developments
        4. 5.2.3.4 SWOT Analysis
        5. 5.2.3.5 Key Strategies
      4. 5.2.4 Fulton (US)
        1. 5.2.4.1 Financial Overview
        2. 5.2.4.2 Products Offered
        3. 5.2.4.3 Key Developments
        4. 5.2.4.4 SWOT Analysis
        5. 5.2.4.5 Key Strategies
      5. 5.2.5 Mitsubishi (JP)
        1. 5.2.5.1 Financial Overview
        2. 5.2.5.2 Products Offered
        3. 5.2.5.3 Key Developments
        4. 5.2.5.4 SWOT Analysis
        5. 5.2.5.5 Key Strategies
      6. 5.2.6 Babcock & Wilcox (US)
        1. 5.2.6.1 Financial Overview
        2. 5.2.6.2 Products Offered
        3. 5.2.6.3 Key Developments
        4. 5.2.6.4 SWOT Analysis
        5. 5.2.6.5 Key Strategies
      7. 5.2.7 Cleaver-Brooks (US)
        1. 5.2.7.1 Financial Overview
        2. 5.2.7.2 Products Offered
        3. 5.2.7.3 Key Developments
        4. 5.2.7.4 SWOT Analysis
        5. 5.2.7.5 Key Strategies
      8. 5.2.8 Thermo Dynamics (US)
        1. 5.2.8.1 Financial Overview
        2. 5.2.8.2 Products Offered
        3. 5.2.8.3 Key Developments
        4. 5.2.8.4 SWOT Analysis
        5. 5.2.8.5 Key Strategies
    3. 5.3 Appendix
      1. 5.3.1 References
      2. 5.3.2 Related Reports
  6. 6 LIST OF FIGURES
    1. 6.1 MARKET SYNOPSIS
    2. 6.2 ITALY MARKET ANALYSIS BY BOILER TYPE
    3. 6.3 ITALY MARKET ANALYSIS BY RATED CAPACITY
    4. 6.4 ITALY MARKET ANALYSIS BY TEMPERATURE
    5. 6.5 ITALY MARKET ANALYSIS BY END USER
    6. 6.6 KEY BUYING CRITERIA OF INDUSTRIAL AUTOMATION & EQUIPMENT
    7. 6.7 RESEARCH PROCESS OF MRFR
    8. 6.8 DRO ANALYSIS OF INDUSTRIAL AUTOMATION & EQUIPMENT
    9. 6.9 DRIVERS IMPACT ANALYSIS: INDUSTRIAL AUTOMATION & EQUIPMENT
    10. 6.10 RESTRAINTS IMPACT ANALYSIS: INDUSTRIAL AUTOMATION & EQUIPMENT
    11. 6.11 SUPPLY / VALUE CHAIN: INDUSTRIAL AUTOMATION & EQUIPMENT
    12. 6.12 INDUSTRIAL AUTOMATION & EQUIPMENT, BY BOILER TYPE, 2024 (% SHARE)
    13. 6.13 INDUSTRIAL AUTOMATION & EQUIPMENT, BY BOILER TYPE, 2024 TO 2035 (USD Million)
    14. 6.14 INDUSTRIAL AUTOMATION & EQUIPMENT, BY RATED CAPACITY, 2024 (% SHARE)
    15. 6.15 INDUSTRIAL AUTOMATION & EQUIPMENT, BY RATED CAPACITY, 2024 TO 2035 (USD Million)
    16. 6.16 INDUSTRIAL AUTOMATION & EQUIPMENT, BY TEMPERATURE, 2024 (% SHARE)
    17. 6.17 INDUSTRIAL AUTOMATION & EQUIPMENT, BY TEMPERATURE, 2024 TO 2035 (USD Million)
    18. 6.18 INDUSTRIAL AUTOMATION & EQUIPMENT, BY END USER, 2024 (% SHARE)
    19. 6.19 INDUSTRIAL AUTOMATION & EQUIPMENT, BY END USER, 2024 TO 2035 (USD Million)
    20. 6.20 BENCHMARKING OF MAJOR COMPETITORS
  7. 7 LIST OF TABLES
    1. 7.1 LIST OF ASSUMPTIONS
  8. 7.1.1
    1. 7.2 Italy MARKET SIZE ESTIMATES; FORECAST
      1. 7.2.1 BY BOILER TYPE, 2025-2035 (USD Million)
      2. 7.2.2 BY RATED CAPACITY, 2025-2035 (USD Million)
      3. 7.2.3 BY TEMPERATURE, 2025-2035 (USD Million)
      4. 7.2.4 BY END USER, 2025-2035 (USD Million)
    2. 7.3 PRODUCT LAUNCH/PRODUCT DEVELOPMENT/APPROVAL
  9. 7.3.1
    1. 7.4 ACQUISITION/PARTNERSHIP
  10. 7.4.1

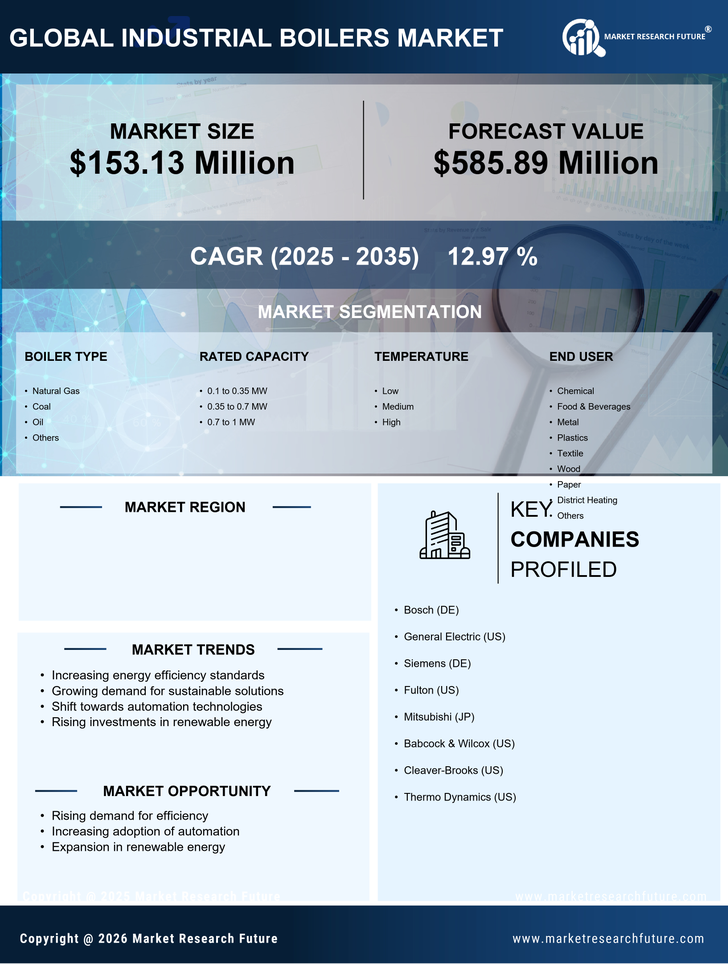
Italy Industrial Automation & Equipment Market Segmentation

Industrial Automation & Equipment By Boiler type (USD Million, 2025-2035)

  • Natural Gas
  • Coal
  • Oil
  • Others

Industrial Automation & Equipment By Rated Capacity (USD Million, 2025-2035)

  • 0.1 to 0.35 MW
  • 0.35 to 0.7 MW
  • 0.7 to 1 MW

Industrial Automation & Equipment By Temperature (USD Million, 2025-2035)

  • Low
  • Medium
  • High

Industrial Automation & Equipment By End User (USD Million, 2025-2035)

  • Chemical
  • Food & Beverages
  • Metal
  • Plastics
  • Textile
  • Wood
  • Paper
  • District Heating
  • Others