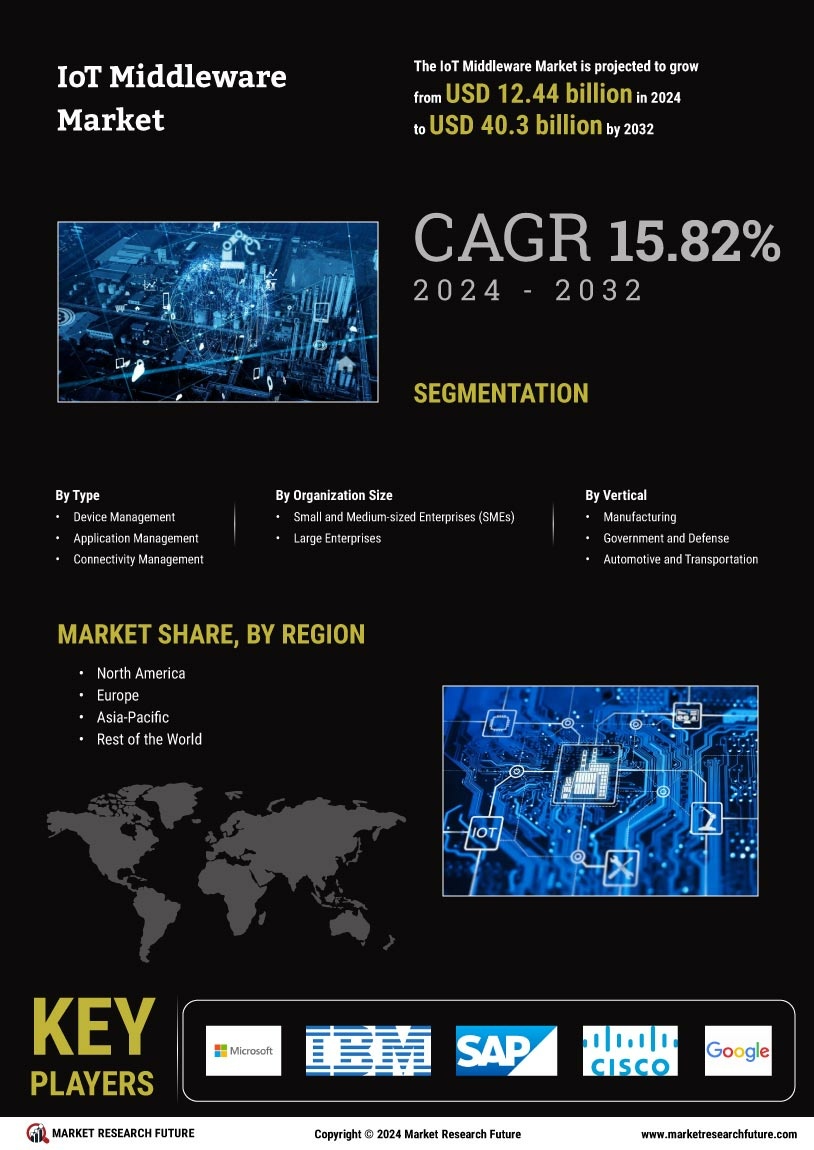
Certified Global Research Member
Isomar fd.webp Wcrc 57.webp
Key Questions Answered
  • Global Market Outlook
  • In-depth analysis of global and regional trends
  • Analyze and identify the major players in the market, their market share, key developments, etc.
  • To understand the capability of the major players based on products offered, financials, and strategies.
  • Identify disrupting products, companies, and trends.
  • To identify opportunities in the market.
  • Analyze the key challenges in the market.
  • Analyze the regional penetration of players, products, and services in the market.
  • Comparison of major players’ financial performance.
  • Evaluate strategies adopted by major players.
  • Recommendations
Why Choose Market Research Future?
  • Vigorous research methodologies for specific market.
  • Knowledge partners across the globe
  • Large network of partner consultants.
  • Ever-increasing/ Escalating data base with quarterly monitoring of various markets
  • Trusted by fortune 500 companies/startups/ universities/organizations
  • Large database of 5000+ markets reports.
  • Effective and prompt pre- and post-sales support.

IoT Middleware Market Research Report Information by Platform Type (Device Management, Application Management, Connectivity Management), By Organization Size (Small and Medium-sized Enterprises (SMEs), Large Enterprises), By Vertical (Manufacturing, Government, and Defense, Automotive, and Transportation, Energy and utilities, Healthcare, Retail, and BFSI), And By Region (North America, Europe, Asia-Pacific, And Rest Of The World) –Market Forecast Till 2032.


ID: MRFR/ICT/9306-HCR | 100 Pages | Author: Shubham Munde| April 2024

IoT Middleware Platform Market Segmentation


IoT Middleware Platform Type Outlook (USD Billion, 2018-2032)


  • Device Management


  • Application Management


  • Connectivity Management


IoT Middleware Organization Size Outlook (USD Billion, 2018-2032)


  • Small and Medium-sized Enterprises (SMEs)


  • Large Enterprises


IoT Middleware Vertical Outlook (USD Billion, 2018-2032)


  • Manufacturing


  • Government and Defense


  • Automotive and Transportation


  • Energy and utilities


  • Healthcare


  • Retail


  • BFSI


IoT Middleware Regional Outlook (USD Billion, 2018-2032)


  • North America Outlook (USD Billion, 2018-2032)


    • North America IoT Middleware by Platform Type


      • Device Management


      • Application Management


      • Connectivity Management


    • North America IoT Middleware by Organization Size


      • Small and Medium-sized Enterprises (SMEs)


      • Large Enterprises


    • North America IoT Middleware by Vertical


      • Manufacturing


      • Government and Defense


      • Automotive and Transportation


      • Energy and utilities


      • Healthcare


      • Retail


      • BFSI


    • US Outlook (USD Billion, 2018-2032)


    • US IoT Middleware by Platform Type


      • Device Management


      • Application Management


      • Connectivity Management


    • US IoT Middleware by Organization Size


      • Small and Medium-sized Enterprises (SMEs)


      • Large Enterprises


    • US IoT Middleware by Vertical


      • Manufacturing


      • Government and Defense


      • Automotive and Transportation


      • Energy and utilities


      • Healthcare


      • Retail


      • BFSI


    • Canada Outlook (USD Billion, 2018-2032)


    • Canada IoT Middleware by Platform Type


      • Device Management


      • Application Management


      • Connectivity Management


    • Canada IoT Middleware by Organization Size


      • Small and Medium-sized Enterprises (SMEs)


      • Large Enterprises


    • Canada IoT Middleware by Vertical


      • Manufacturing


      • Government and Defense


      • Automotive and Transportation


      • Energy and utilities


      • Healthcare


      • Retail


      • BFSI


  • Europe Outlook (USD Billion, 2018-2032)


    • Europe IoT Middleware by Platform Type


      • Device Management


      • Application Management


      • Connectivity Management


    • Europe IoT Middleware by Organization Size


      • Small and Medium-sized Enterprises (SMEs)


      • Large Enterprises


    • Europe IoT Middleware by Vertical


      • Manufacturing


      • Government and Defense


      • Automotive and Transportation


      • Energy and utilities


      • Healthcare


      • Retail


      • BFSI


    • Germany Outlook (USD Billion, 2018-2032)


    • Germany IoT Middleware by Platform Type


      • Device Management


      • Application Management


      • Connectivity Management


    • Germany IoT Middleware by Organization Size


      • Small and Medium-sized Enterprises (SMEs)


      • Large Enterprises


    • Germany IoT Middleware by Vertical


      • Manufacturing


      • Government and Defense


      • Automotive and Transportation


      • Energy and utilities


      • Healthcare


      • Retail


      • BFSI


    • France Outlook (USD Billion, 2018-2032)


    • France IoT Middleware by Platform Type


      • Device Management


      • Application Management


      • Connectivity Management


    • France IoT Middleware by Organization Size


      • Small and Medium-sized Enterprises (SMEs)


      • Large Enterprises


    • France IoT Middleware by Vertical


      • Manufacturing


      • Government and Defense


      • Automotive and Transportation


      • Energy and utilities


      • Healthcare


      • Retail


      • BFSI


    • UK Outlook (USD Billion, 2018-2032)


    • UK IoT Middleware by Platform Type


      • Device Management


      • Application Management


      • Connectivity Management


    • UK IoT Middleware by Organization Size


      • Small and Medium-sized Enterprises (SMEs)


      • Large Enterprises


    • UK IoT Middleware by Vertical


      • Manufacturing


      • Government and Defense


      • Automotive and Transportation


      • Energy and utilities


      • Healthcare


      • Retail


      • BFSI


    • Italy Outlook (USD Billion, 2018-2032)


    • Italy IoT Middleware by Platform Type


      • Device Management


      • Application Management


      • Connectivity Management


    • Italy IoT Middleware by Organization Size


      • Small and Medium-sized Enterprises (SMEs)


      • Large Enterprises


    • Italy IoT Middleware by Vertical


      • Manufacturing


      • Government and Defense


      • Automotive and Transportation


      • Energy and utilities


      • Healthcare


      • Retail


      • BFSI


    • Spain Outlook (USD Billion, 2018-2032)


    • Spain IoT Middleware by Platform Type


      • Device Management


      • Application Management


      • Connectivity Management


    • Spain IoT Middleware by Organization Size


      • Small and Medium-sized Enterprises (SMEs)


      • Large Enterprises


    • Spain IoT Middleware by Vertical


      • Manufacturing


      • Government and Defense


      • Automotive and Transportation


      • Energy and utilities


      • Healthcare


      • Retail


      • BFSI


    • Rest Of Europe Outlook (USD Billion, 2018-2032)


    • Rest Of Europe IoT Middleware by Platform Type


      • Device Management


      • Application Management


      • Connectivity Management


    • Rest Of Europe IoT Middleware by Organization Size


      • Small and Medium-sized Enterprises (SMEs)


      • Large Enterprises


    • Rest Of Europe IoT Middleware by Vertical


      • Manufacturing


      • Government and Defense


      • Automotive and Transportation


      • Energy and utilities


      • Healthcare


      • Retail


      • BFSI


  • Asia-Pacific Outlook (USD Billion, 2018-2032)


    • Asia-Pacific IoT Middleware by Platform Type


      • Device Management


      • Application Management


      • Connectivity Management


    • Asia-Pacific IoT Middleware by Organization Size


      • Small and Medium-sized Enterprises (SMEs)


      • Large Enterprises


    • Asia-Pacific IoT Middleware by Vertical


      • Manufacturing


      • Government and Defense


      • Automotive and Transportation


      • Energy and utilities


      • Healthcare


      • Retail


      • BFSI


    • China Outlook (USD Billion, 2018-2032)


    • China IoT Middleware by Platform Type


      • Device Management


      • Application Management


      • Connectivity Management


    • China IoT Middleware by Organization Size


      • Small and Medium-sized Enterprises (SMEs)


      • Large Enterprises


    • China IoT Middleware by Vertical


      • Manufacturing


      • Government and Defense


      • Automotive and Transportation


      • Energy and utilities


      • Healthcare


      • Retail


      • BFSI


    • Japan Outlook (USD Billion, 2018-2032)


    • Japan IoT Middleware by Platform Type


      • Device Management


      • Application Management


      • Connectivity Management


    • Japan IoT Middleware by Organization Size


      • Small and Medium-sized Enterprises (SMEs)


      • Large Enterprises


    • Japan IoT Middleware by Vertical


      • Manufacturing


      • Government and Defense


      • Automotive and Transportation


      • Energy and utilities


      • Healthcare


      • Retail


      • BFSI


    • India Outlook (USD Billion, 2018-2032)


    • India IoT Middleware by Platform Type


      • Device Management


      • Application Management


      • Connectivity Management


    • India IoT Middleware by Organization Size


      • Small and Medium-sized Enterprises (SMEs)


      • Large Enterprises


    • India IoT Middleware by Vertical


      • Manufacturing


      • Government and Defense


      • Automotive and Transportation


      • Energy and utilities


      • Healthcare


      • Retail


      • BFSI


    • Australia Outlook (USD Billion, 2018-2032)


    • Australia IoT Middleware by Platform Type


      • Device Management


      • Application Management


      • Connectivity Management


    • Australia IoT Middleware by Organization Size


      • Small and Medium-sized Enterprises (SMEs)


      • Large Enterprises


    • Australia IoT Middleware by Vertical


      • Manufacturing


      • Government and Defense


      • Automotive and Transportation


      • Energy and utilities


      • Healthcare


      • Retail


      • BFSI


    • Rest of Asia-Pacific Outlook (USD Billion, 2018-2032)


    • Rest of Asia-Pacific IoT Middleware by Platform Type


      • Device Management


      • Application Management


      • Connectivity Management


    • Rest of Asia-Pacific IoT Middleware by Organization Size


      • Small and Medium-sized Enterprises (SMEs)


      • Large Enterprises


    • Rest of Asia-Pacific IoT Middleware by Vertical


      • Manufacturing


      • Government and Defense


      • Automotive and Transportation


      • Energy and utilities


      • Healthcare


      • Retail


      • BFSI


  • Rest of the World Outlook (USD Billion, 2018-2032)


    • Rest of the World IoT Middleware by Platform Type


      • Device Management


      • Application Management


      • Connectivity Management


    • Rest of the World IoT Middleware by Organization Size


      • Small and Medium-sized Enterprises (SMEs)


      • Large Enterprises


    • Rest of the World IoT Middleware by Vertical


      • Manufacturing


      • Government and Defense


      • Automotive and Transportation


      • Energy and utilities


      • Healthcare


      • Retail


      • BFSI


    • Middle East Outlook (USD Billion, 2018-2032)


    • Middle East IoT Middleware by Platform Type


      • Device Management


      • Application Management


      • Connectivity Management


    • Middle East IoT Middleware by Organization Size


      • Small and Medium-sized Enterprises (SMEs)


      • Large Enterprises


    • Middle East IoT Middleware by Vertical


      • Manufacturing


      • Government and Defense


      • Automotive and Transportation


      • Energy and utilities


      • Healthcare


      • Retail


      • BFSI


    • Africa Outlook (USD Billion, 2018-2032)


    • Africa IoT Middleware by Platform Type


      • Device Management


      • Application Management


      • Connectivity Management


    • Africa IoT Middleware by Organization Size


      • Small and Medium-sized Enterprises (SMEs)


      • Large Enterprises


    • Africa IoT Middleware by Vertical


      • Manufacturing


      • Government and Defense


      • Automotive and Transportation


      • Energy and utilities


      • Healthcare


      • Retail


      • BFSI


    • Latin America Outlook (USD Billion, 2018-2032)


    • Latin America IoT Middleware by Platform Type


      • Device Management


      • Application Management


      • Connectivity Management


    • Latin America IoT Middleware by Organization Size


      • Small and Medium-sized Enterprises (SMEs)


      • Large Enterprises


    • Latin America IoT Middleware by Vertical


      • Manufacturing


      • Government and Defense


      • Automotive and Transportation


      • Energy and utilities


      • Healthcare


      • Retail


      • BFSI


Leading companies partner with us for data-driven Insights
client_1 client_2 client_3 client_4 client_5 client_6 client_7 client_8 client_9 client_10
Please fill in Business Email for Quick Response

TABLE OF CONTENTS

1. EXECUTIVE SUMMARY

1.1. Market Attractiveness Analysis

1.1.1. Global IOT Middleware Market, by Platform Type

1.1.2. Global IOT Middleware Market, by Organization Size

1.1.3. Global IOT Middleware Market, by Vertical

1.1.4. Global IOT Middleware Market, by Region

2. MARKET INTRODUCTION

2.1. Definition

2.2. Scope of the Study

2.3. Market Structure

3. RESEARCH METHODOLOGY

3.1. Research Process

3.2. Primary Research

3.3. Secondary Research

3.4. Market Size Estimation

3.5. List of Assumptions

4. MARKET DYNAMICS

4.1. Introduction

4.2. Drivers

4.2.1. Rise of IoT middleware in manufacturing industry

4.2.2. Growing need for centralized monitoring

4.2.3. Drivers Impact Analysis

4.3. Restraints

4.3.1. Absence of uniform IoT standards

4.3.2. Restraints Impact Analysis

4.4. Opportunities

4.4.1. Rising adoption of IoT in SMEs

4.5. Impact of COVID-19

4.5.1. Impact On Demand for Emerging Economies

4.5.2. Decrease In Availability of Raw Materials

4.5.3. Impact on Market Players

5. MARKET FACTOR ANALYSIS

5.1. Value Chain Analysis/Supply Chain Analysis

5.2. Porter’s Five Forces Model

5.2.1. Bargaining Power of Suppliers

5.2.2. Bargaining Power of Buyers

5.2.3. Threat of New Entrants

5.2.4. Threat of Substitutes

5.2.5. Intensity of Rivalry

6. GLOBAL IOT MIDDLEWARE MARKET, BY PLATFORM TYPE

6.1. Introduction

6.2. Application Management

6.3. Device Management

6.4. Connectivity Management

7. GLOBAL IOT MIDDLEWARE MARKET, BY ORGANIZATION SIZE

7.1. Introduction

7.2. Small and medium-sized Enterprises (SMEs)

7.3. Large Enterprises

8. GLOBAL IOT MIDDLEWARE MARKET, BY VERTICAL

8.1. Introduction

8.2. Manufacturing

8.3. Government and Defense

8.4. Automotive and Transportation

8.5. Energy and utilities

8.6. Healthcare

8.7. Retail

8.8. BFSI

8.9. Others

9. GLOBAL IOT MIDDLEWARE MARKET, BY REGION

9.1. Overview

9.2. North America

9.2.1. Market Size & Estimates, by Country, 2018–2028

9.2.2. Market Size & Estimates, by Platform Type, 2018–2028

9.2.3. Market Size & Estimates, by Organization Size, 2018–2028

9.2.4. Market Size & Estimates, by Vertical, 2018–2028

9.2.5. US

9.2.5.1. Market Size & Estimates, by Platform Type, 2018–2028

9.2.5.2. Market Size & Estimates, by Organization Size, 2018–2028

9.2.5.3. Market Size & Estimates, by Vertical, 2018–2028

9.2.6. CANADA

9.2.6.1. Market Size & Estimates, by Platform Type, 2018–2028

9.2.6.2. Market Size & Estimates, by Organization Size, 2018–2028

9.2.6.3. Market Size & Estimates, by Vertical, 2018–2028

9.2.7. MEXICO

9.2.7.1. Market Size & Estimates, by Platform Type, 2018–2028

9.2.7.2. Market Size & Estimates, by Organization Size, 2018–2028

9.2.7.3. Market Size & Estimates, by Vertical, 2018–2028

9.3. EUROPE

9.3.1. Market Size & Estimates, by Country, 2018–2028

9.3.2. Market Size & Estimates, by Platform Type, 2018–2028

9.3.3. Market Size & Estimates, by Organization Size, 2018–2028

9.3.4. Market Size & Estimates, by Vertical, 2018–2028

9.3.5. GERMANY

9.3.5.1. Market Size & Estimates, by Platform Type, 2018–2028

9.3.5.2. Market Size & Estimates, by Organization Size, 2018–2028

9.3.5.3. Market Size & Estimates, by Vertical, 2018–2028

9.3.6. UK

9.3.6.1. Market Size & Estimates, by Platform Type, 2018–2028

9.3.6.2. Market Size & Estimates, by Organization Size, 2018–2028

9.3.6.3. Market Size & Estimates, by Vertical, 2018–2028

9.3.7. FRANCE

9.3.7.1. Market Size & Estimates, by Platform Type, 2018–2028

9.3.7.2. Market Size & Estimates, by Organization Size, 2018–2028

9.3.7.3. Market Size & Estimates, by Vertical, 2018–2028

9.3.8. Rest of EUROPE

9.3.8.1. Market Size & Estimates, by Platform Type, 2018–2028

9.3.8.2. Market Size & Estimates, by Organization Size, 2018–2028

9.3.8.3. Market Size & Estimates, by Vertical, 2018–2028

9.4. ASIA-PACIFIC

9.4.1. Market Size & Estimates, by Country, 2018–2028

9.4.2. Market Size & Estimates, by Platform Type, 2018–2028

9.4.3. Market Size & Estimates, by Organization Size, 2018–2028

9.4.4. Market Size & Estimates, by Vertical, 2018–2028

9.4.5. CHINA

9.4.5.1. Market Size & Estimates, by Platform Type, 2018–2028

9.4.5.2. Market Size & Estimates, by Organization Size, 2018–2028

9.4.5.3. Market Size & Estimates, by Vertical, 2018–2028

9.4.6. JAPAN

9.4.6.1. Market Size & Estimates, by Platform Type, 2018–2028

9.4.6.2. Market Size & Estimates, by Organization Size, 2018–2028

9.4.6.3. Market Size & Estimates, by Vertical, 2018–2028

9.4.7. INDIA

9.4.7.1. Market Size & Estimates, by Platform Type, 2018–2028

9.4.7.2. Market Size & Estimates, by Organization Size, 2018–2028

9.4.7.3. Market Size & Estimates, by Vertical, 2018–2028

9.4.8. Rest of ASIA-PACIFIC

9.4.8.1. Market Size & Estimates, by Platform Type, 2018–2028

9.4.8.2. Market Size & Estimates, by Organization Size, 2018–2028

9.4.8.3. Market Size & Estimates, by Vertical, 2018–2028

9.5. MIDDLE EAST & AFRICA

9.5.1. Market Size & Estimates, by Platform Type, 2018–2028

9.5.2. Market Size & Estimates, by Organization Size, 2018–2028

9.5.3. Market Size & Estimates, by Vertical, 2018–2028

9.6. SOUTH AMERICA

9.6.1. Market Size & Estimates, by Platform Type, 2018–2028

9.6.2. Market Size & Estimates, by Organization Size, 2018–2028

9.6.3. Market Size & Estimates, by Vertical, 2018–2028

10. COMPETITIVE LANDSCAPE

10.1. Introduction

10.2. Key Players Market Share Analysis, 2020 (%)

10.3. Competitive Benchmarking

10.4. Competitor Dashboard

10.5. Major Growth Strategy in the Market

10.6. Key Developments & Growth Strategies

10.6.1. Product Developments

10.6.2. Mergers & Acquisitions

10.6.3. Contracts & Agreements

11. COMPANY PROFILES

11.1. Microsoft

11.1.1. Company Overview

11.1.2. Financial Overview

11.1.3. Application Management/Solutions Offered

11.1.4. Key Developments

11.1.5. SWOT Analysis

11.1.6. Key Strategies

11.2. IBM

11.2.1. Company Overview

11.2.2. Financial Overview

11.2.3. Application Management/Solutions Offered

11.2.4. Key Developments

11.2.5. SWOT Analysis

11.2.6. Key Strategies

11.3. SAP

11.3.1. Company Overview

11.3.2. Financial Overview

11.3.3. Application Management/Solutions Offered

11.3.4. Key Developments

11.3.5. SWOT Analysis

11.4. Cisco

11.4.1. Company Overview

11.4.2. Financial Overview

11.4.3. Application Management/Solutions Offered

11.4.4. Key Developments

11.4.5. SWOT Analysis

11.4.6. Key Strategies

11.5. Google

11.5.1. Company Overview

11.5.2. Financial Overview

11.5.3. Application Management/Solutions Offered

11.5.4. Key Developments

11.5.5. SWOT Analysis

11.5.6. Key Strategies

11.6. Hitachi

11.6.1. Company Overview

11.6.2. Financial Overview

11.6.3. Application Management/Solutions Offered

11.6.4. Key Developments

11.6.5. SWOT Analysis

11.6.6. Key Strategies

11.7. Bosch

11.7.1. Company Overview

11.7.2. Financial Overview

11.7.3. Application Management/Solutions Offered

11.7.4. Key Developments

11.7.5. SWOT Analysis

11.7.6. Key Strategies

11.8. Oracle

11.8.1. Company Overview

11.8.2. Financial Overview

11.8.3. Application Management/Solutions Offered

11.8.4. Key Developments

11.8.5. SWOT Analysis

11.8.6. Key Strategies

11.9. General Electric

11.9.1. Company Overview

11.9.2. Financial Overview

11.9.3. Application Management/Solutions Offered

11.9.4. Key Developments

11.9.5. SWOT Analysis

11.9.6. Key Strategies

11.10. Schneider Electric

11.10.1. Company Overview

11.10.2. Financial Overview

11.10.3. Application Management/Solutions Offered

11.10.4. Key Developments

11.10.5. SWOT Analysis

11.10.6. Key Strategies

11.11. ClearBlade

11.11.1. Company Overview

11.11.2. Financial Overview

11.11.3. Application Management/Solutions Offered

11.11.4. Key Developments

11.11.5. SWOT Analysis

11.11.6. Key Strategies

11.12. MuleSoft

11.12.1. Company Overview

11.12.2. Financial Overview

11.12.3. Application Management/Solutions Offered

11.12.4. Key Developments

11.12.5. SWOT Analysis

11.12.6. Key Strategies

11.13. Davra

11.13.1. Company Overview

11.13.2. Financial Overview

11.13.3. Application Management/Solutions Offered

11.13.4. Key Developments

11.13.5. SWOT Analysis

11.13.6. Key Strategies

11.14. TIBCO Software

11.14.1. Company Overview

11.14.2. Financial Overview

11.14.3. Application Management/Solutions Offered

11.14.4. Key Developments

11.14.5. SWOT Analysis

11.14.6. Key Strategies

11.15. Eurotech

11.15.1. Company Overview

11.15.2. Financial Overview

11.15.3. Application Management/Solutions Offered

11.15.4. Key Developments

11.15.5. SWOT Analysis

11.15.6. Key Strategies

LIST OF TABLES

TABLE 1 LIST OF ASSUMPTIONS

TABLE 2 GLOBAL IOT MIDDLEWARE MARKET, BY PLATFORM TYPE, 2018–2028 (USD MILLION)

TABLE 3 GLOBAL IOT MIDDLEWARE MARKET, BY ORGANIZATION SIZE, 2018–2028 (USD MILLION)

TABLE 4 GLOBAL IOT MIDDLEWARE MARKET, BY VERTICAL, 2018–2028 (USD MILLION)

TABLE 5 GLOBAL IOT MIDDLEWARE MARKET, BY REGION, 2018–2028 (USD MILLION)

TABLE 6 NORTH AMERICA: IOT MIDDLEWARE MARKET, BY COUNTRY, 2018–2028 (USD MILLION)

TABLE 7 NORTH AMERICA: IOT MIDDLEWARE MARKET, BY PLATFORM TYPE, 2018–2028 (USD MILLION)

TABLE 8 NORTH AMERICA IOT MIDDLEWARE MARKET, BY ORGANIZATION SIZE, 2018–2028 (USD MILLION)

TABLE 9 NORTH AMERICA: IOT MIDDLEWARE MARKET, BY VERTICAL, 2018–2028 (USD MILLION)

TABLE 10 US: IOT MIDDLEWARE MARKET, BY PLATFORM TYPE, 2018–2028 (USD MILLION

TABLE 11 US: IOT MIDDLEWARE MARKET, BY ORGANIZATION SIZE, 2018–2028 (USD MILLION

TABLE 12 US: IOT MIDDLEWARE MARKET, BY VERTICAL, 2018–2028 (USD MILLION)

TABLE 13 CANADA: IOT MIDDLEWARE MARKET, BY PLATFORM TYPE, 2018–2028 (USD MILLION)

TABLE 20 CANADA: IOT MIDDLEWARE MARKET, BY ORGANIZATION SIZE, 2018–2028 (USD MILLION)

TABLE 14 CANADA: IOT MIDDLEWARE MARKET, BY VERTICAL, 2018–2028 (USD MILLION)

TABLE 15 MEXICO: IOT MIDDLEWARE MARKET, BY PLATFORM TYPE, 2018–2028 (USD MILLION)

TABLE 216 MEXICO: IOT MIDDLEWARE MARKET, BY ORGANIZATION SIZE, 2018–2028 (USD MILLION)

TABLE 17 MEXICO: IOT MIDDLEWARE MARKET, BY VERTICAL, 2018–2028 (USD MILLION)

TABLE 18 EUROPE: IOT MIDDLEWARE MARKET, BY COUNTRY, 2018–2028 (USD MILLION)

TABLE 19 EUROPE: IOT MIDDLEWARE MARKET, BY PLATFORM TYPE, 2018–2028 (USD MILLION)

TABLE 20 EUROPE: IOT MIDDLEWARE MARKET, BY ORGANIZATION SIZE, 2018–2028 (USD MILLION)

TABLE 21 EUROPE: IOT MIDDLEWARE MARKET, BY VERTICAL, 2018–2028 (USD MILLION)

TABLE 22 UK: IOT MIDDLEWARE MARKET, BY PLATFORM TYPE, 2018–2028 (USD MILLION)

TABLE 23 UK: IOT MIDDLEWARE MARKET, BY ORGANIZATION SIZE, 2018–2028 (USD MILLION)

TABLE 24 UK: IOT MIDDLEWARE MARKET, BY VERTICAL, 2018–2028 (USD MILLION)

TABLE 25 GERMANY: IOT MIDDLEWARE MARKET, BY PLATFORM TYPE, 2018–2028 (USD MILLION)

TABLE 26 GERMANY: IOT MIDDLEWARE MARKET, BY ORGANIZATION SIZE, 2018–2028 (USD MILLION)

TABLE 27 GERMANY: IOT MIDDLEWARE MARKET, BY VERTICAL, 2018–2028 (USD MILLION)

TABLE 28 FRANCE: IOT MIDDLEWARE MARKET, BY PLATFORM TYPE, 2018–2028 (USD MILLION)

TABLE 29 FRANCE: IOT MIDDLEWARE MARKET, BY ORGANIZATION SIZE, 2018–2028 (USD MILLION)

TABLE 30 FRANCE: IOT MIDDLEWARE MARKET, BY VERTICAL, 2018–2028 (USD MILLION)

TABLE 31 REST OF EUROPE: IOT MIDDLEWARE MARKET, BY PLATFORM TYPE, 2018–2028 (USD MILLION)

TABLE 32 REST OF EUROPE: IOT MIDDLEWARE MARKET, BY ORGANIZATION SIZE, 2018–2028 (USD MILLION)

TABLE 33 REST OF EUROPE: IOT MIDDLEWARE MARKET, BY VERTICAL, 2018–2028 (USD MILLION)

TABLE 34 ASIA-PACIFIC: IOT MIDDLEWARE MARKET, BY COUNTRY, 2018–2028 (USD MILLION)

TABLE 35 ASIA-PACIFIC: IOT MIDDLEWARE MARKET, BY PLATFORM TYPE, 2018–2028 (USD MILLION)

TABLE 36 ASIA-PACIFIC: IOT MIDDLEWARE MARKET, BY ORGANIZATION SIZE, 2018–2028 (USD MILLION)

TABLE 37 ASIA-PACIFIC: IOT MIDDLEWARE MARKET, BY VERTICAL, 2018–2028 (USD MILLION)

TABLE 38 CHINA: IOT MIDDLEWARE MARKET, BY PLATFORM TYPE, 2018–2028 (USD MILLION)

TABLE 39 CHINA: IOT MIDDLEWARE MARKET, BY ORGANIZATION SIZE, 2018–2028 (USD MILLION)

TABLE 40 CHINA: IOT MIDDLEWARE MARKET, BY VERTICAL, 2018–2028 (USD MILLION)

TABLE 41 JAPAN: IOT MIDDLEWARE MARKET, BY PLATFORM TYPE, 2018–2028 (USD MILLION)

TABLE 42 JAPAN: IOT MIDDLEWARE MARKET, BY ORGANIZATION SIZE, 2018–2028 (USD MILLION)

TABLE 43 JAPAN: IOT MIDDLEWARE MARKET, BY VERTICAL, 2018–2028 (USD MILLION)

TABLE 44 INDIA: IOT MIDDLEWARE MARKET, BY PLATFORM TYPE, 2018–2028 (USD MILLION)

TABLE 45 INDIA: IOT MIDDLEWARE MARKET, BY ORGANIZATION SIZE, 2018–2028 (USD MILLION)

TABLE 46 INDIA: IOT MIDDLEWARE MARKET, BY VERTICAL, 2018–2028 (USD MILLION)

TABLE 47 REST OF ASIA-PACIFIC: IOT MIDDLEWARE MARKET, BY PLATFORM TYPE, 2018–2028 (USD MILLION)

TABLE 48 REST OF ASIA-PACIFIC: IOT MIDDLEWARE MARKET, BY ORGANIZATION SIZE, 2018–2028 (USD MILLION)

TABLE 49 REST OF ASIA-PACIFIC: IOT MIDDLEWARE MARKET, BY VERTICAL, 2018–2028 (USD MILLION)

TABLE 50 MIDDLE EAST & AFRICA: IOT MIDDLEWARE MARKET, BY PLATFORM TYPE, 2018–2028 (USD MILLION)

TABLE 51 MIDDLE EAST & AFRICA: IOT MIDDLEWARE MARKET, BY ORGANIZATION SIZE, 2018–2028 (USD MILLION)

TABLE 52 MIDDLE EAST & AFRICA: IOT MIDDLEWARE MARKET, BY VERTICAL, 2018–2028 (USD MILLION)

TABLE 53 SOUTH AMERICA: IOT MIDDLEWARE MARKET, BY PLATFORM TYPE, 2018–2028 (USD MILLION)

TABLE 54 SOUTH AMERICA: IOT MIDDLEWARE MARKET, BY ORGANIZATION SIZE, 2018–2028 (USD MILLION)

TABLE 55 SOUTH AMERICA: IOT MIDDLEWARE MARKET, BY VERTICAL, 2018–2028 (USD MILLION)

LIST OF FIGURES

FIGURE 1 MARKET SYNOPSIS

FIGURE 2 RESEARCH PROCESS OF MRFR

FIGURE 3 TOP-DOWN & BOTTOM-UP APPROACH

FIGURE 4 GLOBAL IOT MIDDLEWARE MARKET, BY PLATFORM TYPE, 2018–2028 (USD MILLION)

FIGURE 5 GLOBAL IOT MIDDLEWARE MARKET, BY ORGANIZATION SIZE, 2018–2028 (USD MILLION)

FIGURE 6 GLOBAL IOT MIDDLEWARE MARKET, BY VERTICAL, 2018–2028 (USD MILLION)

FIGURE 7 GLOBAL IOT MIDDLEWARE MARKET, BY REGION, 2018–2028 (USD MILLION)

FIGURE 8 NORTH AMERICA: IOT MIDDLEWARE MARKET, BY COUNTRY, 2018–2028 (USD MILLION)

FIGURE 9 NORTH AMERICA: IOT MIDDLEWARE MARKET, BY PLATFORM TYPE, 2018–2028 (USD MILLION)

FIGURE 10 NORTH AMERICA: IOT MIDDLEWARE MARKET, BY ORGANIZATION SIZE, 2018–2028 (USD MILLION)

FIGURE 11 NORTH AMERICA: IOT MIDDLEWARE MARKET, BY VERTICAL, 2018–2028 (USD MILLION)

FIGURE 12 US: IOT MIDDLEWARE MARKET, BY PLATFORM TYPE, 2018–2028 (USD MILLION

FIGURE 13 US: IOT MIDDLEWARE MARKET, BY ORGANIZATION SIZE, 2018–2028 (USD MILLION

FIGURE 14 US: IOT MIDDLEWARE MARKET, BY VERTICAL, 2018–2028 (USD MILLION)

FIGURE 15 CANADA: IOT MIDDLEWARE MARKET, BY PLATFORM TYPE, 2018–2028 (USD MILLION)

FIGURE 16 CANADA: IOT MIDDLEWARE MARKET, BY ORGANIZATION SIZE, 2018–2028 (USD MILLION)

FIGURE 17 CANADA: IOT MIDDLEWARE MARKET, BY VERTICAL, 2018–2028 (USD MILLION)

FIGURE 18 MEXICO: IOT MIDDLEWARE MARKET, BY PLATFORM TYPE, 2018–2028 (USD MILLION)

FIGURE 19 MEXICO: IOT MIDDLEWARE MARKET, BY ORGANIZATION SIZE, 2018–2028 (USD MILLION)

FIGURE 20 MEXICO: IOT MIDDLEWARE MARKET, BY VERTICAL, 2018–2028 (USD MILLION)

FIGURE 21 EUROPE: IOT MIDDLEWARE MARKET, BY COUNTRY, 2018–2028 (USD MILLION)

FIGURE 22 EUROPE: IOT MIDDLEWARE MARKET, BY PLATFORM TYPE, 2018–2028 (USD MILLION)

FIGURE 23 EUROPE: IOT MIDDLEWARE MARKET, BY ORGANIZATION SIZE, 2018–2028 (USD MILLION)

FIGURE 24 EUROPE: IOT MIDDLEWARE MARKET, BY VERTICAL, 2018–2028 (USD MILLION)

FIGURE 25 UK: IOT MIDDLEWARE MARKET, BY PLATFORM TYPE, 2018–2028 (USD MILLION)

FIGURE 26 UK: IOT MIDDLEWARE MARKET, BY ORGANIZATION SIZE, 2018–2028 (USD MILLION)

FIGURE 27 UK: IOT MIDDLEWARE MARKET, BY VERTICAL, 2018–2028 (USD MILLION)

FIGURE 28 GERMANY: IOT MIDDLEWARE MARKET, BY PLATFORM TYPE, 2018–2028 (USD MILLION)

FIGURE 29 GERMANY: IOT MIDDLEWARE MARKET, BY ORGANIZATION SIZE, 2018–2028 (USD MILLION)

FIGURE 30 GERMANY: IOT MIDDLEWARE MARKET, BY VERTICAL, 2018–2028 (USD MILLION)

FIGURE 31 FRANCE: IOT MIDDLEWARE MARKET, BY PLATFORM TYPE, 2018–2028 (USD MILLION)

FIGURE 32 FRANCE: IOT MIDDLEWARE MARKET, BY ORGANIZATION SIZE, 2018–2028 (USD MILLION)

FIGURE 33 FRANCE: IOT MIDDLEWARE MARKET, BY VERTICAL, 2018–2028 (USD MILLION)

FIGURE 34 REST OF EUROPE: IOT MIDDLEWARE MARKET, BY PLATFORM TYPE, 2018–2028 (USD MILLION)

FIGURE 35 REST OF EUROPE: IOT MIDDLEWARE MARKET, BY ORGANIZATION SIZE, 2018–2028 (USD MILLION)

FIGURE 36 REST OF EUROPE: IOT MIDDLEWARE MARKET, BY VERTICAL, 2018–2028 (USD MILLION)

FIGURE 37 ASIA-PACIFIC: IOT MIDDLEWARE MARKET, BY COUNTRY, 2018–2028 (USD MILLION)

FIGURE 38 ASIA-PACIFIC: IOT MIDDLEWARE MARKET, BY PLATFORM TYPE, 2018–2028 (USD MILLION)

FIGURE 39 ASIA-PACIFIC: IOT MIDDLEWARE MARKET, BY ORGANIZATION SIZE, 2018–2028 (USD MILLION)

FIGURE 40 ASIA-PACIFIC: IOT MIDDLEWARE MARKET, BY VERTICAL, 2018–2028 (USD MILLION)

FIGURE 41 CHINA: IOT MIDDLEWARE MARKET, BY PLATFORM TYPE, 2018–2028 (USD MILLION)

FIGURE 42 CHINA: IOT MIDDLEWARE MARKET, BY ORGANIZATION SIZE, 2018–2028 (USD MILLION)

FIGURE 43 CHINA: IOT MIDDLEWARE MARKET, BY VERTICAL, 2018–2028 (USD MILLION)

FIGURE 44 JAPAN: IOT MIDDLEWARE MARKET, BY PLATFORM TYPE, 2018–2028 (USD MILLION)

FIGURE 45 JAPAN: IOT MIDDLEWARE MARKET, BY ORGANIZATION SIZE, 2018–2028 (USD MILLION)

FIGURE 46 JAPAN: IOT MIDDLEWARE MARKET, BY VERTICAL, 2018–2028 (USD MILLION)

FIGURE 47 INDIA: IOT MIDDLEWARE MARKET, BY PLATFORM TYPE, 2018–2028 (USD MILLION)

FIGURE 48 INDIA: IOT MIDDLEWARE MARKET, BY ORGANIZATION SIZE, 2018–2028 (USD MILLION)

FIGURE 49 INDIA: IOT MIDDLEWARE MARKET, BY VERTICAL, 2018–2028 (USD MILLION)

FIGURE 50 REST OF ASIA-PACIFIC: IOT MIDDLEWARE MARKET, BY PLATFORM TYPE, 2018–2028 (USD MILLION)

FIGURE 51 REST OF ASIA-PACIFIC: IOT MIDDLEWARE MARKET, BY ORGANIZATION SIZE, 2018–2028 (USD MILLION)

FIGURE 52 REST OF ASIA-PACIFIC: IOT MIDDLEWARE MARKET, BY VERTICAL, 2018–2028 (USD MILLION)

FIGURE 53 MIDDLE EAST & AFRICA: IOT MIDDLEWARE MARKET, BY PLATFORM TYPE, 2018–2028 (USD MILLION)

FIGURE 54 MIDDLE EAST & AFRICA: IOT MIDDLEWARE MARKET, BY ORGANIZATION SIZE, 2018–2028 (USD MILLION)

FIGURE 55 MIDDLE EAST & AFRICA: IOT MIDDLEWARE MARKET, BY VERTICAL, 2018–2028 (USD MILLION)

FIGURE 56 SOUTH AMERICA: IOT MIDDLEWARE MARKET, BY PLATFORM TYPE, 2018–2028 (USD MILLION)

FIGURE 57 SOUTH AMERICA: IOT MIDDLEWARE MARKET, BY ORGANIZATION SIZE, 2018–2028 (USD MILLION)

FIGURE 58 SOUTH AMERICA: IOT MIDDLEWARE MARKET, BY VERTICAL, 2018–2028 (USD MILLION)

Purchase Option
Single User $ 4,950
Multiuser License $ 5,950
Enterprise User $ 7,250
Compare Licenses
Tailored for You
  • Dedicated Research on any specifics segment or region.
  • Focused Research on specific players in the market.
  • Custom Report based only on your requirements.
  • Flexibility to add or subtract any chapter in the study.
  • Historic data from 2014 and forecasts outlook till 2040.
  • Flexibility of providing data/insights in formats (PDF, PPT, Excel).
  • Provide cross segmentation in applicable scenario/markets.