ID: MRFR/ICT/5270-HCR | February 2021 | Region: Global | 100 pages
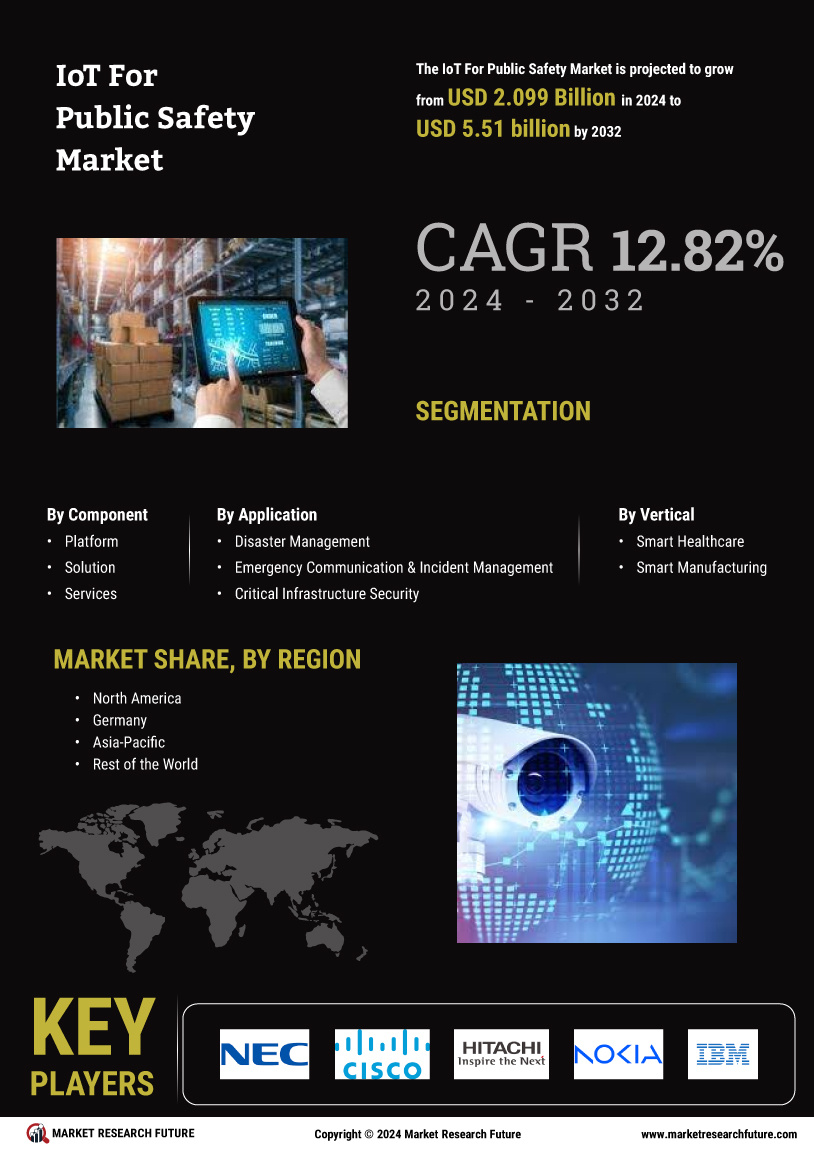
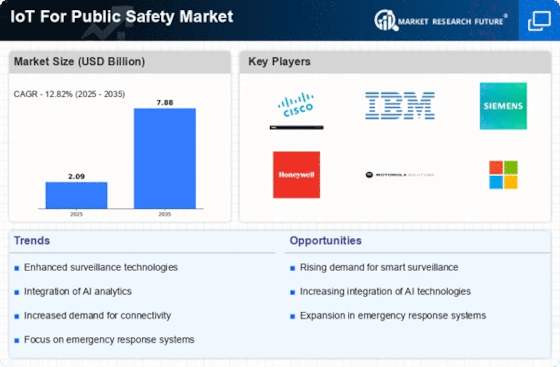
According to Market Research Future (MRFR), the global IoT for public safety market size was worth USD 844.2 million in 2017 and is expected to balloon to USD 2010.44 million by 2023 at a CAGR of 15.60% over the forecast period (2018-2023). This can be credited to the emergence of internet of things (IoT) as a viable option for protecting public interests. The spike noticed in crime rates is likely to trigger the need for tougher security measures and IoT can play a significant role thanks to advancements in video surveillance systems.
Impending public safety threats amid rising incidence of terrorism and vandalism is likely to drive the IoT for public safety market demand over the forecast period. Government efforts in creating smart city projects for safeguarding the lives of their citizens can be of benefit the market. Integration of machine learning (ML) and artificial intelligence (AI) in government departments to accumulate intel faster can be a plus for the market in the forthcoming years.
Segmentation
The global IoT for public safety market is segmented by component, application, and vertical.
By component, the market categorizes into three major segments, namely platform, solution, and services. By application, the market covers disaster management, surveillance & security, critical infrastructure security, and emergency communication and incident management. Verticals deemed vital to the market include smart manufacturing, smart utilities, smart transportation, smart building & home automation, smart healthcare, homeland security, and others.
Regional Analysis
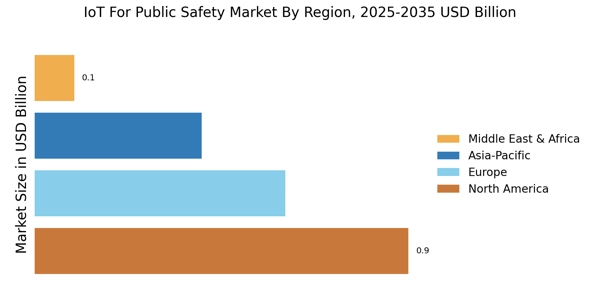
Regionally, the global IoT for public safety market is segmented into North America, Europe, Asia Pacific (APAC), and the Rest-of-the-World (RoW). North America is touted to be the top revenue-getter for the market till the end of the forecast period. But APAC is predicted to be highly lucrative owing to the rapid approval provided to infrastructural projects. Furthermore, the emphasis on smart city projects and digitization of legacy equipment can propel the regional market growth in a positive trajectory.
Competitive Analysis
Leading players in the IoT for public safety market include Hitachi Vantara (U.S.), NEC (Japan), Cisco Systems (U.S.), IBM (U.S.), Nokia Networks (Finland), Sierra Wireless (Canada), Telit (U.K.), West Corporation (U.S.), Microsoft Corporation (U.S.), Intellivision (U.S.), Iskratel (Slovenia), X-Systems (The Netherlands), Tibbo Systems (Taiwan), Star Controls (U.S.), Yardarm Technologies (U.S.), and others. Agreements, partnerships, and new product launches are strategies employed by these players to stay ahead in the market.
Report Methodology
Market Research Future prides itself on conducting top-notch research using its proprietary techniques. With a combination of primary and secondary research, analysts have managed to collect relevant data gathered from interviews with executives, whitepapers, SEC filings, and others to compile a thoroughly researched report. The data is verified with other sources to estimate future revenue and volume figures which assist investors in making wise business decisions. A mix of bottom-down and top-up approaches are undertaken to study the market from all perspectives.
Global IoT for Public Safety Market by Component
Global IoT for Public Safety Market by Application
Global IoT for Public Safety Market by Vertical
Global IoT for Public Safety Market by Region
Frequently Asked Questions (FAQ) :
The IoT for public safety market is poised to gain popularity due to rising terrorist attacks and vandalisms.
As per the report, the IoT for public safety market is projected to mark 15.6% CAGR.
The IoT for public safety market is poised to value at USD 2010.44 Mn by 2023.
The key players of the IoT for public safety market are Hitachi Vantara (U.S.), Cisco Systems (U.S.), NEC (Japan), IBM (U.S.), Sierra Wireless (Canada), Nokia Networks (Finland), Telit (U.K.), Microsoft Corporation (U.S.), West Corporation (U.S.), Intellivision (U.S.), X-Systems (The Netherlands), Iskratel (Slovenia), Tibbo Systems (Taiwan), Yardarm Technologies (U.S.), and Star Controls (U.S.).
The application-based segments of the IoT for public safety market are emergency communication & incident management, disaster management, critical infrastructure security, and surveillance & security.
Table of Content
1 Executive Summary
2 Market Introduction
2.1 Definition
2.2 Scope of the Study
2.3 List of Assumptions
2.4 Market Structure
2.5 Key Takeaways
3 Market Insights
4 Research Methodology
4.1 Research Process
4.2 Primary Research
4.3 Secondary Research
4.4 Market Size Estimation
4.5 Forecast Model
5 Market Dynamics
5.1 Introduction
5.2 Drivers
5.2.1 Smart city initiatives in many regions
5.2.2 Increasing demand for unmanned operations
5.3 Restraint
5.3.1 Initial investment cost
5.4 Opportunities
5.4.1 Growing adoption of IoT across end-users.
5.5 Value Chain Analysis
5.5 Porter’s Five Forces Model
5.5.1 Threat of New Entrant
5.5.2 Bargaining Power of Suppliers
5.5.3 Bargaining Power of Buyers
5.5.4 Threat of Substitutes
5.5.5 Intensity of Rivalry
6 Market Alerts
6.1 Impact Analysis of Emerging Technology
6.2 Cellular Networks, Use Cases & Best Practices
7. Global Cellular Networks Market, by component
7.1 Introduction
7.2 Platform
7.2.1 Market Estimates & Forecast, 2018-2023
7.2.2 Market Estimates & Forecast, by Region, 2018-2023
7.3 Solution
7.3.1 Market Estimates & Forecast, 2018-2023
7.3.2 Market Estimates & Forecast, by Region, 2018-2023
7.4 Services
7.4.1 Market Estimates & Forecast, 2018-2023
7.4.2 Market Estimates & Forecast, by Region, 2018-2023
8. Global Cellular Networks Market by Application
8.1 Introduction
8.2 Emergency Communication and Incident Management
8.2.1 Market Estimates & Forecast, 2018-2023
8.2.2 Market Estimates & Forecast, by Region, 2018-2023
8.3 Critical Infrastructure Security
8.3.1 Market Estimates & Forecast, 2018-2023
8.3.2 Market Estimates & Forecast, by Region, 2018-2023
8.4 Surveillance and Security
8.4.1 Market Estimates & Forecast, 2018-2023
8.4.2 Market Estimates & Forecast, by Region, 2018-2023
8.5 Disaster Management
8.5.1 Market Estimates & Forecast, 2018-2023
8.5.2 Market Estimates & Forecast, by Region, 2018-2023
9. Global Cellular Networks Market by Vertical
9.1 Introduction
9.2 Smart Building and Home Automation
9.2.1 Market Estimates & Forecast, 2018-2023
9.2.2 Market Estimates & Forecast, by Region, 2018-2023
9.3 Homeland Security
9.3.1 Market Estimates & Forecast, 2018-2023
9.3.2 Market Estimates & Forecast, by Region, 2018-2023
9.4 Smart Utilities
9.4.1 Market Estimates & Forecast, 2018-2023
9.4.2 Market Estimates & Forecast, by Region, 2018-2023
9.5 Smart Healthcare
9.5.1 Market Estimates & Forecast, 2018-2023
9.5.2 Market Estimates & Forecast, by Region, 2018-2023
9.6 Smart Manufacturing
9.6.1 Market Estimates & Forecast, 2018-2023
9.6.2 Market Estimates & Forecast, by Region, 2018-2023
9.7 Smart Transportation
9.7.1 Market Estimates & Forecast, 2018-2023
9.7.2 Market Estimates & Forecast, by Region, 2018-2023
9.8 Others
9.8.1 Market Estimates & Forecast, 2018-2023
9.8.2 Market Estimates & Forecast, by Region, 2018-2023
10. Global Cellular Networks Market by Region
10.1 Introduction
10.2 North America
10.2.1 Market Estimates & Forecast, by Country, 2018-2023
10.2.2 Market Estimates & Forecast, by Component, 2018-2023
10.2.3 Market Estimates & Forecast, by Applications, 2018-2023
10.2.4 Market Estimates & Forecast, by Vertical, 2018-2023
10.2.5 US
10.2.5.1 Market Estimates & Forecast, by Component, 2018-2023
10.2.5.2 Market Estimates & Forecast, by Application, 2018-2023
10.2.5.3 Market Estimates & Forecast, by Vertical, 2018-2023
10.2.6 Mexico
10.2.6.1 Market Estimates & Forecast, by Component, 2018-2023
10.2.6.2 Market Estimates & Forecast, by Application, 2018-2023
10.2.6.3 Market Estimates & Forecast, by Vertical, 2018-2023
10.2.7 Canada
10.2.7.1 Market Estimates & Forecast, by Component, 2018-2023
10.2.7.2 Market Estimates & Forecast, by Application, 2018-2023
10.2.7.3 Market Estimates & Forecast, by Vertical, 2018-2023
10.3 Europe
10.3.1 Market Estimates & Forecast, by Country, 2018-2023
10.3.2 Market Estimates & Forecast, by Component, 2018-2023
10.3.3 Market Estimates & Forecast, by Applications, 2018-2023
10.3.4 Market Estimates & Forecast, by Vertical, 2018-2023
10.3.5 Germany
10.3.5.1 Market Estimates & Forecast, by Component, 2018-2023
10.3.5.2 Market Estimates & Forecast, by Application, 2018-2023
10.3.5.3 Market Estimates & Forecast, by Vertical, 2018-2023
10.3.6 France
10.3.6.1 Market Estimates & Forecast, by Component, 2018-2023
10.3.6.2 Market Estimates & Forecast, by Application, 2018-2023
10.3.6.3 Market Estimates & Forecast, by Vertical, 2018-2023
10.3.7 UK
10.3.7.1 Market Estimates & Forecast, by Component, 2018-2023
10.3.7.2 Market Estimates & Forecast, by Application, 2018-2023
10.3.7.3 Market Estimates & Forecast, by Vertical, 2018-2023
10.3.8 Rest of Europe
10.3.8.1 Market Estimates & Forecast, by Component, 2018-2023
10.3.8.2 Market Estimates & Forecast, by Application, 2018-2023
10.3.8.3 Market Estimates & Forecast, by Vertical, 2018-2023
10.4 Asia-Pacific
10.4.1 Market Estimates & Forecast, by Country, 2018-2023
10.4.2 Market Estimates & Forecast, by Component, 2018-2023
10.4.3 Market Estimates & Forecast, by Applications, 2018-2023
10.4.4 Market Estimates & Forecast, by Vertical, 2018-2023
10.4.5 China
10.4.5.1 Market Estimates & Forecast, by Component, 2018-2023
10.4.5.2 Market Estimates & Forecast, by Application, 2018-2023
10.4.5.3 Market Estimates & Forecast, by Vertical, 2018-2023
10.4.6 India
10.4.6.1 Market Estimates & Forecast, by Component, 2018-2023
10.4.6.2 Market Estimates & Forecast, by Application, 2018-2023
10.4.6.3 Market Estimates & Forecast, by Vertical, 2018-2023
10.4.7 Japan
10.4.7.1 Market Estimates & Forecast, by Component, 2018-2023
10.4.7.2 Market Estimates & Forecast, by Application, 2018-2023
10.4.7.3 Market Estimates & Forecast, by Vertical, 2018-2023
10.4.8 Rest of Asia-Pacific
10.4.8.1 Market Estimates & Forecast, by Component, 2018-2023
10.4.8.2 Market Estimates & Forecast, by Application, 2018-2023
10.4.8.3 Market Estimates & Forecast, by Vertical, 2018-2023
10.5 Rest of the world
10.5.1 Market Estimates & Forecast, by Country, 2018-2023
10.5.2 Market Estimates & Forecast, by Component, 2018-2023
10.5.3 Market Estimates & Forecast, by Applications, 2018-2023
10.5.4 Market Estimates & Forecast, by Vertical, 2018-2023
10.5.5 Middle East & Africa
10.5.5.1 Market Estimates & Forecast, by Component, 2018-2023
10.5.5.2 Market Estimates & Forecast, by Application, 2018-2023
10.5.5.3 Market Estimates & Forecast, by Vertical, 2018-2023
10.5.6 Latin Countries
10.5.6.1 Market Estimates & Forecast, by Component, 2018-2023
10.5.6.2 Market Estimates & Forecast, by Application, 2018-2023
10.5.6.3 Market Estimates & Forecast, by Vertical, 2018-2023
11 Competitive Landscape
11.1 Competitive Scenario
11.1.1 Competitive Overview of the Cellular Networks Market
11.1.2 Competitive Benchmarking of the Cellular Networks Market
12 Company Profiles
12.1 IBM Corporation
12.1.1 Company Overview
12.1.2 Financial Overview
12.1.3 Product Offerings
12.1.4 Key Developments
12.1.5 SWOT Analysis
12.1.6 Key Strategy
12.2 Microsoft corporation
12.2.1 Company Overview
12.2.2 Financial Overview
12.2.3 Product Offerings
12.2.4 Key Developments
12.2.5 SWOT Analysis
12.2.6 Key Strategy
12.3 Cisco Systems
12.3.1 Company Overview
12.3.2 Financial Overview
12.3.3 Product Offerings
12.3.4 Key Developments
12.3.5 SWOT Analysis
12.3.6 Key Strategy
12.4 Sierra wireless
12.4.1 Company Overview
12.4.2 Financial Overview
12.4.3 Product Offerings
12.4.4 Key Developments
12.4.5 SWOT Analysis
12.4.6 Key Strategy
12.5 Telit communications
12.5.1 Company Overview
12.5.2 Financial Overview
12.5.3 Product Offerings
12.5.4 Key Developments
12.5.5 SWOT Analysis
12.5.6 Key Strategy
12.6 Nokia Networks
12.6.1 Company Overview
12.6.2 Financial Overview
12.6.3 Product Offerings
12.6.4 Key Developments
12.6.5 SWOT Analysis
12.6.6 Key Strategy
12.7 NEC Corporation
12.7.1 Company Overview
12.7.2 Financial Overview
12.7.3 Product Offerings
12.7.4 Key Developments
12.7.5 SWOT Analysis
12.7.6 Key Strategy
12.8 Hitachi Vantara
12.8.1 Company Overview
12.8.2 Financial Overview
12.8.3 Product Offerings
12.8.4 Key Developments
12.8.5 SWOT Analysis
12.8.6 Key Strategy
12.9 West Corporation
12.9.1 Company Overview
12.9.2 Financial Overview
12.9.3 Product Offerings
12.9.4 Key Developments
12.9.5 SWOT Analysis
12.9.6 Key Strategy
12.10 Iskratel
12.10.1 Company Overview
12.10.2 Financial Overview
12.10.3 Product Offerings
12.10.4 Key Developments
12.10.5 SWOT Analysis
12.10.6 Key Strategy
12.11 X-Systems
12.11.1 Company Overview
12.11.2 Financial Overview
12.11.3 Product Offerings
12.11.4 Key Developments
12.11.5 SWOT Analysis
12.11.6 Key Strategy
12.12 Tibbo Systems
12.12.1 Company Overview
12.12.2 Financial Overview
12.12.3 Product Offerings
12.12.4 Key Developments
12.12.5 SWOT Analysis
12.12.6 Key Strategy
12.13 Star Controls
12.13.1 Company Overview
12.13.2 Financial Overview
12.13.3 Product Offerings
12.13.4 Key Developments
12.13.5 SWOT Analysis
12.13.6 Key Strategy
12.14 Intellivision
12.14.1 Company Overview
12.14.2 Financial Overview
LIST OF TABLES
Table1 Global IoT for Public Safety Market, By Country, 2018-2023
Table2 North America: IoT for Public Safety Market, By Country, 2018–2023
Table3 Europe: IoT for Public Safety Market, By Country, 2018–2023
Table4 Asia-Pacific: IoT for Public Safety Market, By Country, 2018–2023
Table5 Latin America: IoT for Public Safety Market, By Country, 2018–2023
Table6 North America: IoT for Public Safety Market, By Country
Table7 North America: IoT for Public Safety Market, By Component
Table8 North America: IoT for Public Safety Market, By Application
Table9 North America: IoT for Public Safety Market, By Vertical
Table10 Europe: IoT for Public Safety Market, By Country
Table11 Europe: IoT for Public Safety Market, By Component
Table12 Europe: IoT for Public Safety Market, By Application
Table13 Europe: IoT for Public Safety Market, By Vertical
Table14 Asia-Pacific: IoT for Public Safety Market, By Country
Table15 Asia-Pacific IoT for Public Safety Market, By Component
Table16 Asia-Pacific IoT for Public Safety Market, By Application
Table17 Asia-Pacific IoT for Public Safety Market, By Vertical
Table18 Middle East & Africa: IoT for Public Safety Market, By Country
Table19 Middle East & Africa: IoT for Public Safety Market, By Component
Table20 Middle East & Africa: IoT for Public Safety Market, By Application
Table21 Middle East & Africa: IoT for Public Safety Market, By Vertical
Table22 Latin America: IoT for Public Safety Market, By Country
Table23 Latin America: IoT for Public Safety Market, By Component
Table24 Latin America: IoT for Public Safety Market, By Application
Table25 Latin America: IoT for Public Safety Market, By Vertical
LIST OF FIGURES
Figure 1 Global IoT for Public Safety Market segmentation
Figure 2 Forecast Methodology
Figure 3 Porter’s Five Forces Analysis of Global IoT for Public Safety Market
Figure 4 Value Chain of Global IoT for Public Safety Market
Figure 5 Share of IoT for Public Safety Market in 2018, by country (in %)
Figure 6 Global IoT for Public Safety Market, 2018–2023
Figure 7 Share of Global IoT for Public Safety Market by Industry, 2018–2023
Figure 8 Global IoT for Public Safety Market Size, by Component, 2018
Figure 9 Share of Global IoT for Public Safety Market, by Component, 2018–2023
Figure 10 Global IoT for Public Safety Market Size, by Application, 2018
Figure 11 Share of Global IoT for Public Safety Market, by Application, 2018–2023
Figure 12 Global IoT for Public Safety Market Size, by Vertical, 2018
Figure 13 Share of Global IoT for Public Safety Market, by Vertical, 2018–2023