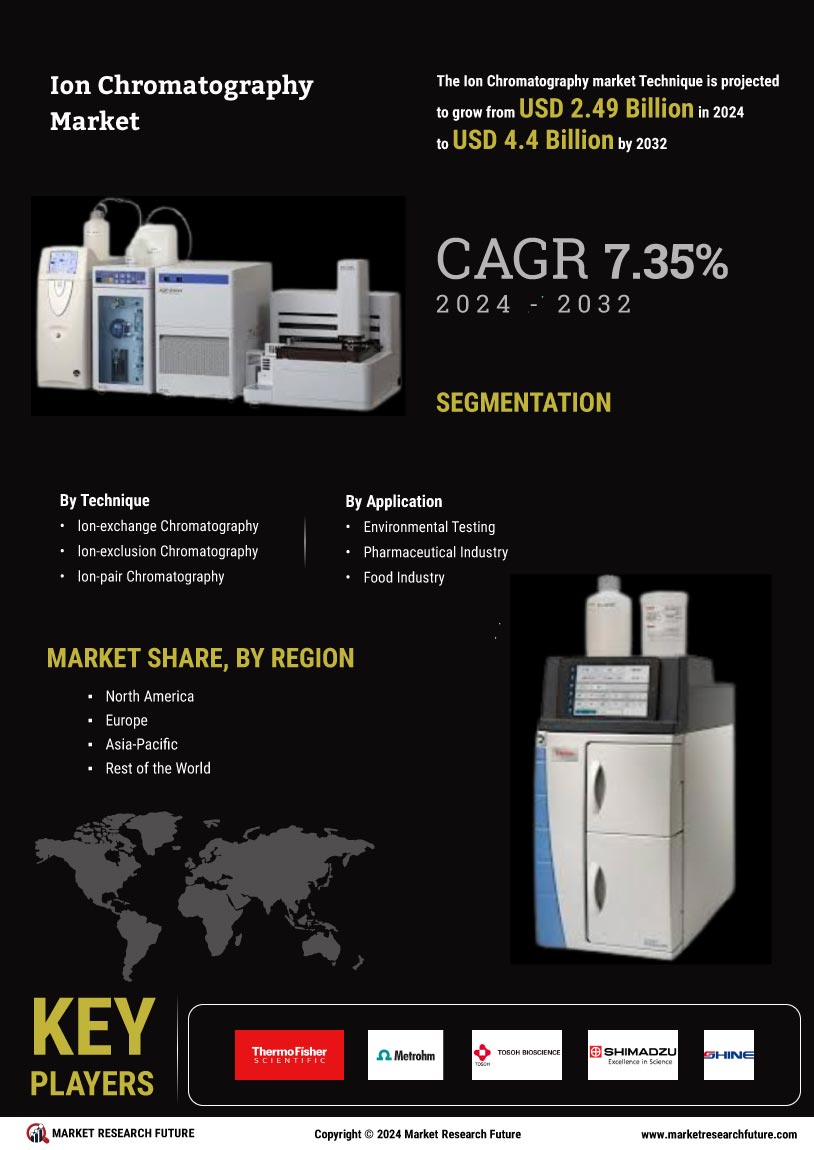
Certified Global Research Member
Isomar fd.webp Wcrc 57.webp
Key Questions Answered
  • Global Market Outlook
  • In-depth analysis of global and regional trends
  • Analyze and identify the major players in the market, their market share, key developments, etc.
  • To understand the capability of the major players based on products offered, financials, and strategies.
  • Identify disrupting products, companies, and trends.
  • To identify opportunities in the market.
  • Analyze the key challenges in the market.
  • Analyze the regional penetration of players, products, and services in the market.
  • Comparison of major players’ financial performance.
  • Evaluate strategies adopted by major players.
  • Recommendations
Why Choose Market Research Future?
  • Vigorous research methodologies for specific market.
  • Knowledge partners across the globe
  • Large network of partner consultants.
  • Ever-increasing/ Escalating data base with quarterly monitoring of various markets
  • Trusted by fortune 500 companies/startups/ universities/organizations
  • Large database of 5000+ markets reports.
  • Effective and prompt pre- and post-sales support.

Ion Chromatography Market Research Report: Information By Technique (lon-exchange Chromatography, lon-exclusion Chromatography, and lon-pair Chromatography), By Application (Environmental Testing, Pharmaceutical Industry, Food Industry, Chemical Industry), and By Region (North America, Europe, Asia-Pacific, and Rest Of The World) – Market Forecast Till 2032


ID: MRFR/HC/9305-HCR | 120 Pages | Author: Rahul Gotadki| April 2024

Market Segmentation


Ion Chromatography Technique Outlook (USD Billion, 2018-2032)


  • Ion-exchange chromatography


  • Ion-exclusion chromatography


  • Ion-pair chromatography


Ion Chromatography Application Outlook (USD Billion, 2018-2032)


  • Environmental testing


  • Pharmaceutical industry


  • Food industry


  • Chemical industry


Ion Chromatography Regional Outlook (USD Billion, 2018-2032)


  • North America Outlook (USD Billion, 2018-2032)


    • Ion Chromatography by Technique


      • Ion-exchange chromatography


      • Ion-exclusion chromatography


      • Ion-pair chromatography


    • Ion Chromatography Application Outlook (USD Billion, 2018-2032)


      • Environmental testing


      • Pharmaceutical industry


      • Food industry


      • Chemical industry


    • US Outlook (USD Billion, 2018-2032)


    • Ion Chromatography by Technique


      • Ion-exchange chromatography


      • Ion-exclusion chromatography


      • Ion-pair chromatography


    • Ion Chromatography Application Outlook (USD Billion, 2018-2032)


      • Environmental testing


      • Pharmaceutical industry


      • Food industry


      • Chemical industry


    • Canada Outlook (USD Billion, 2018-2032)


    • Ion Chromatography by Technique


      • Ion-exchange chromatography


      • Ion-exclusion chromatography


      • Ion-pair chromatography


    • Ion Chromatography Application Outlook (USD Billion, 2018-2032)


      • Environmental testing


      • Pharmaceutical industry


      • Food industry


      • Chemical industry


  • Europe Outlook (USD Billion, 2018-2032)


    • Ion Chromatography by Technique


      • Ion-exchange chromatography


      • Ion-exclusion chromatography


      • Ion-pair chromatography


    • Ion Chromatography Application Outlook (USD Billion, 2018-2032)


      • Environmental testing


      • Pharmaceutical industry


      • Food industry


      • Chemical industry


    • Germany Outlook (USD Billion, 2018-2032)


    • Ion Chromatography by Technique


      • Ion-exchange chromatography


      • Ion-exclusion chromatography


      • Ion-pair chromatography


    • Ion Chromatography Application Outlook (USD Billion, 2018-2032)


      • Environmental testing


      • Pharmaceutical industry


      • Food industry


      • Chemical industry


    • France Outlook (USD Billion, 2018-2032)


    • Ion Chromatography by Technique


      • Ion-exchange chromatography


      • Ion-exclusion chromatography


      • Ion-pair chromatography


    • Ion Chromatography Application Outlook (USD Billion, 2018-2032)


      • Environmental testing


      • Pharmaceutical industry


      • Food industry


      • Chemical industry


    • UK Outlook (USD Billion, 2018-2032)


    • Ion Chromatography by Technique


      • Ion-exchange chromatography


      • Ion-exclusion chromatography


      • Ion-pair chromatography


    • Ion Chromatography Application Outlook (USD Billion, 2018-2032)


      • Environmental testing


      • Pharmaceutical industry


      • Food industry


      • Chemical industry


    • Italy Outlook (USD Billion, 2018-2032)


    • Ion Chromatography by Technique


      • Ion-exchange chromatography


      • Ion-exclusion chromatography


      • Ion-pair chromatography


    • Ion Chromatography Application Outlook (USD Billion, 2018-2032)


      • Environmental testing


      • Pharmaceutical industry


      • Food industry


      • Chemical industry


    • Spain Outlook (USD Billion, 2018-2032)


    • Ion Chromatography by Technique


      • Ion-exchange chromatography


      • Ion-exclusion chromatography


      • Ion-pair chromatography


    • Ion Chromatography Application Outlook (USD Billion, 2018-2032)


      • Environmental testing


      • Pharmaceutical industry


      • Food industry


      • Chemical industry


    • Rest Of Europe Outlook (USD Billion, 2018-2032)


    • Ion Chromatography by Technique


      • Ion-exchange chromatography


      • Ion-exclusion chromatography


      • Ion-pair chromatography


    • Ion Chromatography Application Outlook (USD Billion, 2018-2032)


      • Environmental testing


      • Pharmaceutical industry


      • Food industry


      • Chemical industry


  • Asia-Pacific Outlook (USD Billion, 2018-2032)


    • Ion Chromatography by Technique


      • Ion-exchange chromatography


      • Ion-exclusion chromatography


      • Ion-pair chromatography


    • Ion Chromatography Application Outlook (USD Billion, 2018-2032)


      • Environmental testing


      • Pharmaceutical industry


      • Food industry


      • Chemical industry


    • China Outlook (USD Billion, 2018-2032)


    • Ion Chromatography by Technique


      • Ion-exchange chromatography


      • Ion-exclusion chromatography


      • Ion-pair chromatography


    • Ion Chromatography Application Outlook (USD Billion, 2018-2032)


      • Environmental testing


      • Pharmaceutical industry


      • Food industry


      • Chemical industry


    • Japan Outlook (USD Billion, 2018-2032)


    • Ion Chromatography by Technique


      • Ion-exchange chromatography


      • Ion-exclusion chromatography


      • Ion-pair chromatography


    • Ion Chromatography Application Outlook (USD Billion, 2018-2032)


      • Environmental testing


      • Pharmaceutical industry


      • Food industry


      • Chemical industry


    • India Outlook (USD Billion, 2018-2032)


    • Ion Chromatography by Technique


      • Ion-exchange chromatography


      • Ion-exclusion chromatography


      • Ion-pair chromatography


    • Ion Chromatography Application Outlook (USD Billion, 2018-2032)


      • Environmental testing


      • Pharmaceutical industry


      • Food industry


      • Chemical industry


    • Australia Outlook (USD Billion, 2018-2032)


    • Ion Chromatography by Technique


      • Ion-exchange chromatography


      • Ion-exclusion chromatography


      • Ion-pair chromatography


    • Ion Chromatography Application Outlook (USD Billion, 2018-2032)


      • Environmental testing


      • Pharmaceutical industry


      • Food industry


      • Chemical industry


    • Rest of Asia-Pacific Outlook (USD Billion, 2018-2032)


    • Ion Chromatography by Technique


      • Ion-exchange chromatography


      • Ion-exclusion chromatography


      • Ion-pair chromatography


    • Ion Chromatography Application Outlook (USD Billion, 2018-2032)


      • Environmental testing


      • Pharmaceutical industry


      • Food industry


      • Chemical industry


  • Rest of the World Outlook (USD Billion, 2018-2032)


    • Ion Chromatography by Technique


      • Ion-exchange chromatography


      • Ion-exclusion chromatography


      • Ion-pair chromatography


    • Ion Chromatography Application Outlook (USD Billion, 2018-2032)


      • Environmental testing


      • Pharmaceutical industry


      • Food industry


      • Chemical industry


    • Middle East Outlook (USD Billion, 2018-2032)


    • Ion Chromatography by Technique


      • Ion-exchange chromatography


      • Ion-exclusion chromatography


      • Ion-pair chromatography


    • Ion Chromatography Application Outlook (USD Billion, 2018-2032)


      • Environmental testing


      • Pharmaceutical industry


      • Food industry


      • Chemical industry


    • Africa Outlook (USD Billion, 2018-2032)


    • Ion Chromatography by Technique


      • Ion-exchange chromatography


      • Ion-exclusion chromatography


      • Ion-pair chromatography


    • Ion Chromatography Application Outlook (USD Billion, 2018-2032)


      • Environmental testing


      • Pharmaceutical industry


      • Food industry


      • Chemical industry


    • Latin America Outlook (USD Billion, 2018-2032)


    • Ion Chromatography by Technique


      • Ion-exchange chromatography


      • Ion-exclusion chromatography


      • Ion-pair chromatography


    • Ion Chromatography Application Outlook (USD Billion, 2018-2032)


      • Environmental testing


      • Pharmaceutical industry


      • Food industry


      • Chemical industry


Leading companies partner with us for data-driven Insights
client_1 client_2 client_3 client_4 client_5 client_6 client_7 client_8 client_9 client_10
Please fill in Business Email for Quick Response

TABLE OF CONTENTS

1. REPORT PROLOGUE

2. MARKET INTRODUCTION

2.1. Definition

2.2. Scope of the Study

2.2.1. Research Objective

2.2.2. Assumptions

2.2.3. Limitations

3. RESEARCH METHODOLOGY

3.1. Overview

3.2. Data Mining

3.3. Secondary Research

3.4. Primary Research

3.4.1. Primary Interviews and Information Gathering Process

3.4.2. Breakdown of Primary Respondents

3.5. Forecasting Techniques

3.6. Market Size Estimation

3.6.1. Bottom-Up Approach

3.6.2. Top-Down Approach

3.7. Data Triangulation

3.8. Validation

4. MARKET DYNAMICS

4.1. Overview

4.2. Drivers

4.3. Restraints

4.4. Opportunities

5. MARKET FACTOR ANALYSIS

5.1. Porter’s Five Forces Analysis

5.1.1. Bargaining Power of Suppliers

5.1.2. Bargaining Power of Buyers

5.1.3. Threat of New Entrants

5.1.4. Threat of Substitutes

5.1.5. Intensity of Rivalry

5.2. Value Chain Analysis

5.3. COVID-19 Impact Analysis

5.3.1. Market Impact Analysis

5.3.2. Impact on Supply Chain

5.3.3. Regional Impact

5.3.4. Opportunity and Threat Analysis

6. GLOBAL ION CHROMATOGRAPHY MARKET, BY TECHNIQUE

6.1. Overview

6.2. Ion-exchange Chromatography

Market Estimates & Forecast, by Region, 2018–2027

Market Estimates & Forecast, by Country, 2018–2027

6.3. Ion-exclusion Chromatography

Market Estimates & Forecast, by Region, 2018–2027

Market Estimates & Forecast, by Country, 2018–2027

6.4. Ion-pair Chromatography

Market Estimates & Forecast, by Region, 2018–2027

Market Estimates & Forecast, by Country, 2018–2027

7. GLOBAL ION CHROMATOGRAPHY MARKET, BY APPLICATION

7.1. Overview

7.2. Environmental Testing

Market Estimates & Forecast, by Region, 2018–2027

Market Estimates & Forecast, by Country, 2018–2027

7.3. Pharmaceutical Industry

Market Estimates & Forecast, by Region, 2018–2027

Market Estimates & Forecast, by Country, 2018–2027

7.4. Food Industry

Market Estimates & Forecast, by Region, 2018–2027

Market Estimates & Forecast, by Country, 2018–2027

7.5. Chemical Industry

Market Estimates & Forecast, by Region, 2018–2027

Market Estimates & Forecast, by Country, 2018–2027

7.6. Others

Market Estimates & Forecast, by Region, 2018–2027

Market Estimates & Forecast, by Country, 2018–2027

8. GLOBAL ION CHROMATOGRAPHY MARKET, BY REGION

8.1. Overview

8.2. North America

8.2.1. US

8.2.2. Canada

8.3. Europe

8.3.1. Germany

8.3.2. France

8.3.3. Italy

8.3.4. Spain

8.3.5. UK

8.3.6. Rest of Europe

8.4. Asia-Pacific

8.4.1. Japan

8.4.2. China

8.4.3. India

8.4.4. Australia

8.4.5. South Korea

8.4.6. Rest of Asia-Pacific

8.5. Rest of the World

8.5.1. Middle East

8.5.2. Africa

8.5.3. Latin America

9. COMPANY LANDSCAPE

9.1. Overview

9.2. Competitive Analysis

9.3. Market Share Analysis

9.4. Major Growth Strategy in the Global Ion Chromatography Market

9.5. Competitive Benchmarking

9.6. Leading Players in Terms of Number of Developments in the Global Ion Chromatography Market

9.7. Key Developments and Growth Strategies

9.7.1. New Product Launch/Service Deployment

9.7.2. Merger & Acquisitions

9.7.3. Joint Ventures

9.8. Major Players Financial Matrix

9.8.1. Sales & Operating Income, 2020

9.8.2. Major Players R&D Expenditure, 2020

10. COMPANY PROFILES

10.1. ThermoFisher Scientific

10.1.1. Company Overview

10.1.2. Products Offered

10.1.3. Financial Overview

10.1.4. Key Developments

10.1.5. SWOT Analysis

10.1.6. Key Strategies

10.2. Metrohm

10.2.1. Company Overview

10.2.2. Products Offered

10.2.3. Financial Overview

10.2.4. Key Developments

10.2.5. SWOT Analysis

10.2.6. Key Strategies

10.3. Qingdao Shenghan

10.3.1. Company Overview

10.3.2. Products Offered

10.3.3. Financial Overview

10.3.4. Key Developments

10.3.5. SWOT Analysis

10.3.6. Key Strategies

10.4. Tosoh Bioscience

10.4.1. Company Overview

10.4.2. Products Offered

10.4.3. Financial Overview

10.4.4. Key Developments

10.4.5. SWOT Analysis

10.4.6. Key Strategies

10.5. Shimadzu

10.5.1. Company Overview

10.5.2. Products Offered

10.5.3. Financial Overview

10.5.4. Key Developments

10.5.5. SWOT Analysis

10.5.6. Key Strategies

10.6. MembraPure GmbH

10.6.1. Company Overview

10.6.2. Products Offered

10.6.3. Financial Overview

10.6.4. Key Developments

10.6.5. SWOT Analysis

10.6.6. Key Strategies

10.7. Nittoseiko Analytech Co., Ltd

10.7.1. Company Overview

10.7.2. Products Offered

10.7.3. Financial Overview

10.7.4. Key Developments

10.7.5. SWOT Analysis

10.7.6. Key Strategies

10.8. Qingdao Puren Instrument

10.8.1. Company Overview

10.8.2. Products Offered

10.8.3. Financial Overview

10.8.4. Key Developments

10.8.5. SWOT Analysis

10.8.6. Key Strategies

10.9. East & West Analytical Instruments

10.9.1. Company Overview

10.9.2. Products Offered

10.9.3. Financial Overview

10.9.4. Key Developments

10.9.5. SWOT Analysis

10.9.6. Key Strategies

10.10. Qingdao Luhai

10.10.1. Company Overview

10.10.2. Products Offered

10.10.3. Financial Overview

10.10.4. Key Developments

10.10.5. SWOT Analysis

10.10.6. Key Strategies

10.11. Sykam

10.11.1. Company Overview

10.11.2. Products Offered

10.11.3. Financial Overview

10.11.4. Key Developments

10.11.5. SWOT Analysis

10.11.6. Key Strategies

10.12. Cecil Instruments

10.12.1. Company Overview

10.12.2. Products Offered

10.12.3. Financial Overview

10.12.4. Key Developments

10.12.5. SWOT Analysis

10.12.6. Key Strategies

10.13. Others

11. APPENDIX

11.1. References

11.2. Related Reports

LIST OF TABLES

TABLE 1 GLOBAL ION CHROMATOGRAPHY MARKET SYNOPSIS, 2018–2027

TABLE 2 GLOBAL ION CHROMATOGRAPHY MARKET ESTIMATES & FORECAST, 2018–2027 (USD MILLION)

TABLE 3 GLOBAL ION CHROMATOGRAPHY MARKET, BY TECHNIQUE, 2018–2027 (USD MILLION)

TABLE 4 GLOBAL ION CHROMATOGRAPHY MARKET, BY APPLICATION , 2018–2027 (USD MILLION)

TABLE 5 NORTH AMERICA: ION CHROMATOGRAPHY MARKET, BY TECHNIQUE, 2018–2027 (USD MILLION)

TABLE 6 NORTH AMERICA ION CHROMATOGRAPHY MARKET, BY APPLICATION, 2018–2027 (USD MILLION)

TABLE 7 US: ION CHROMATOGRAPHY MARKET, BY TECHNIQUE, 2018–2027 (USD MILLION)

TABLE 8 US ION CHROMATOGRAPHY MARKET, BY APPLICATION , 2018–2027 (USD MILLION)

TABLE 9 CANADA: ION CHROMATOGRAPHY MARKET, BY TECHNIQUE, 2018–2027 (USD MILLION)

TABLE 10 CANADA ION CHROMATOGRAPHY MARKET, BY APPLICATION , 2017–2027 (USD MILLION)

TABLE 11 EUROPE: ION CHROMATOGRAPHY MARKET, BY TECHNIQUE, 2018–2027 (USD MILLION)

TABLE 12 EUROPE: ION CHROMATOGRAPHY MARKET, BY APPLICATION , 2018–2027 (USD MILLION)

TABLE 13 GERMANY: ION CHROMATOGRAPHY MARKET, BY TECHNIQUE, 2018–2027 (USD MILLION)

TABLE 14 GERMANY: ION CHROMATOGRAPHY MARKET, BY APPLICATION , 2018–2027 (USD MILLION)

TABLE 15 UK: ION CHROMATOGRAPHY MARKET, BY TECHNIQUE, 2018–2027 (USD MILLION)

TABLE 16 UK: ION CHROMATOGRAPHY MARKET, BY APPLICATION , 2018–2027 (USD MILLION)

TABLE 17 FRANCE: ION CHROMATOGRAPHY MARKET, BY TECHNIQUE, 2018–2027 (USD MILLION)

TABLE 18 FRANCE: ION CHROMATOGRAPHY MARKET, BY APPLICATION , 2018–2027 (USD MILLION)

TABLE 19 ITALY: ION CHROMATOGRAPHY MARKET, BY TECHNIQUE, 2018–2027 (USD MILLION)

TABLE 20 ITALY: ION CHROMATOGRAPHY MARKET, BY APPLICATION , 2018–2027 (USD MILLION)

TABLE 21 SPAIN: ION CHROMATOGRAPHY MARKET, BY TECHNIQUE, 2018–2027 (USD MILLION)

TABLE 22 SPAIN: ION CHROMATOGRAPHY MARKET, BY APPLICATION , 2018–2027 (USD MILLION)

TABLE 23 REST OF EUROPE: ION CHROMATOGRAPHY MARKET, BY TECHNIQUE, 2018–2027 (USD MILLION)

TABLE 24 REST OF EUROPE: ION CHROMATOGRAPHY MARKET, BY APPLICATION , 2018–2027 (USD MILLION)

TABLE 25 ASIA-PACIFIC: ION CHROMATOGRAPHY MARKET, BY TECHNIQUE, 2018–2027 (USD MILLION)

TABLE 26 ASIA-PACIFIC: ION CHROMATOGRAPHY MARKET, BY APPLICATION, 2018–2027 (USD MILLION)

TABLE 27 INDIA: ION CHROMATOGRAPHY MARKET, BY TECHNIQUE, 2018–2027 (USD MILLION)

TABLE 28 INDIA: ION CHROMATOGRAPHY MARKET, BY APPLICATION , 2018–2027 (USD MILLION)

TABLE 29 CHINA: ION CHROMATOGRAPHY MARKET, BY TECHNIQUE, 2018–2027 (USD MILLION)

TABLE 30 CHINA: ION CHROMATOGRAPHY MARKET, BY APPLICATION , 2018–2027 (USD MILLION)

TABLE 31 JAPAN: ION CHROMATOGRAPHY MARKET, BY TECHNIQUE, 2018–2027 (USD MILLION)

TABLE 32 JAPAN: ION CHROMATOGRAPHY MARKET, BY APPLICATION , 2018–2027 (USD MILLION)

TABLE 33 AUSTRALIA: ION CHROMATOGRAPHY MARKET, BY TECHNIQUE, 2018–2027 (USD MILLION)

TABLE 34 AUSTRALIA: ION CHROMATOGRAPHY MARKET, BY APPLICATION , 2018–2027 (USD MILLION)

TABLE 35 SOUTH KOREA: ION CHROMATOGRAPHY MARKET, BY TECHNIQUE, 2018–2027 (USD MILLION)

TABLE 36 SOUTH KOREA: ION CHROMATOGRAPHY MARKET, BY APPLICATION , 2018–2027 (USD MILLION)

TABLE 37 REST OF ASIA-PACIFIC: ION CHROMATOGRAPHY MARKET, BY TECHNIQUE, 2018–2027 (USD MILLION)

TABLE 38 REST OF ASIA-PACIFIC: ION CHROMATOGRAPHY MARKET, BY APPLICATION , 2018–2027 (USD MILLION)

TABLE 39 REST OF THE WORLD: ION CHROMATOGRAPHY MARKET, BY TECHNIQUE, 2018–2027 (USD MILLION)

TABLE 40 REST OF THE WORLD: ION CHROMATOGRAPHY MARKET, APPLICATION, 2018–2027 (USD MILLION)

TABLE 41 MIDDLE EAST: ION CHROMATOGRAPHY MARKET, BY TECHNIQUE, 2018–2027 (USD MILLION)

TABLE 42 MIDDLE EAST: ION CHROMATOGRAPHY MARKET, APPLICATION, 2018–2027 (USD MILLION)

TABLE 43 AFRICA: ION CHROMATOGRAPHY MARKET, BY TECHNIQUE, 2018–2027 (USD MILLION)

TABLE 44 AFRICA: ION CHROMATOGRAPHY MARKET, APPLICATION, 2018–2027 (USD MILLION)

TABLE 45 LATIN AMERICA: ION CHROMATOGRAPHY MARKET, BY TECHNIQUE, 2018–2027 (USD MILLION)

TABLE 46 LATIN AMERICA: ION CHROMATOGRAPHY MARKET, APPLICATION, 2018–2027 (USD MILLION)

LIST OF FIGURES

FIGURE 1 RESEARCH PROCESS

FIGURE 2 MARKET STRUCTURE FOR THE GLOBAL ION CHROMATOGRAPHY MARKET

FIGURE 3 MARKET DYNAMICS FOR THE GLOBAL ION CHROMATOGRAPHY MARKET

FIGURE 4 GLOBAL ION CHROMATOGRAPHY MARKET SHARE, BY TECHNIQUE, 2020 (%)

FIGURE 5 GLOBAL ION CHROMATOGRAPHY MARKET SHARE, BY APPLICATION, 2020 (%)

FIGURE 6 GLOBAL ION CHROMATOGRAPHY MARKET SHARE, BY REGION, 2020 (%)

FIGURE 7 NORTH AMERICA: ION CHROMATOGRAPHY MARKET SHARE, BY REGION, 2020 (%)

FIGURE 8 EUROPE: ION CHROMATOGRAPHY MARKET SHARE, BY REGION, 2020 (%)

FIGURE 9 ASIA-PACIFIC: ION CHROMATOGRAPHY MARKET SHARE, BY REGION, 2020 (%)

FIGURE 10 REST OF THE WORLD: ION CHROMATOGRAPHY MARKET SHARE, BY REGION, 2020 (%)

FIGURE 11 GLOBAL ION CHROMATOGRAPHY MARKET: COMPANY SHARE ANALYSIS, 2020 (%)

FIGURE 12 THERMO FISHER SCIENTIFIC: KEY FINANCIALS

FIGURE 13 THERMO FISHER SCIENTIFIC: SEGMENTAL REVENUE

FIGURE 14 THERMO FISHER SCIENTIFIC: REGIONAL REVENUE

FIGURE 15 METROHM: KEY FINANCIALS

FIGURE 16 METROHM: SEGMENTAL REVENUE

FIGURE 17 METROHM: REGIONAL REVENUE

FIGURE 18 TOSOH BIOSCIENCE: KEY FINANCIALS

FIGURE 19 TOSOH BIOSCIENCE: SEGMENTAL REVENUE

FIGURE 20 TOSOH BIOSCIENCE: REGIONAL REVENUE

FIGURE 21 SHIMADZU: KEY FINANCIALS

FIGURE 22 SHIMADZU: SEGMENTAL REVENUE

FIGURE 23 SHIMADZU: REGIONAL REVENUE

FIGURE 24 QINGDAO SHENGHAN CHROMATOGRAPH TECHNOLOGY CO., LTD: KEY FINANCIALS

FIGURE 25 QINGDAO SHENGHAN CHROMATOGRAPH TECHNOLOGY CO., LTD: SEGMENTAL REVENUE

FIGURE 26 QINGDAO SHENGHAN CHROMATOGRAPH TECHNOLOGY CO., LTD: REGIONAL REVENUE

FIGURE 27 MEMBRAPURE GMBH: KEY FINANCIALS

FIGURE 28 MEMBRAPURE GMBH: SEGMENTAL REVENUE

FIGURE 29 MEMBRAPURE GMBH: REGIONAL REVENUE

FIGURE 30 NITTOSEIKO ANALYTECH CO., LTD: KEY FINANCIALS

FIGURE 31 NITTOSEIKO ANALYTECH CO., LTD: SEGMENTAL REVENUE

FIGURE 32 NITTOSEIKO ANALYTECH CO., LTD: REGIONAL REVENUE

FIGURE 33 QINGDAO PUREN INSTRUMENT: KEY FINANCIALS

FIGURE 34 QINGDAO PUREN INSTRUMENT: SEGMENTAL REVENUE

FIGURE 35 QINGDAO PUREN INSTRUMENT: REGIONAL REVENUE

FIGURE 36 EAST & WEST ANALYTICAL INSTRUMENTS: KEY FINANCIALS

FIGURE 37 EAST & WEST ANALYTICAL INSTRUMENTS: SEGMENTAL REVENUE

FIGURE 38 EAST & WEST ANALYTICAL INSTRUMENTS: REGIONAL REVENUE

FIGURE 39 QINGDAO LUHAI: KEY FINANCIALS

FIGURE 40 QINGDAO LUHAI: SEGMENTAL REVENUE

FIGURE 41 QINGDAO LUHAI: REGIONAL REVENUE

FIGURE 42 SYKAM: KEY FINANCIALS

FIGURE 43 SYKAM: SEGMENTAL REVENUE

FIGURE 44 SYKAM: REGIONAL REVENUE

FIGURE 45 CECIL INSTRUMENTS: KEY FINANCIALS

FIGURE 46 CECIL INSTRUMENTS: SEGMENTAL REVENUE

FIGURE 47 CECIL INSTRUMENTS: REGIONAL REVENUE.0

Purchase Option
Single User $ 4,950
Multiuser License $ 5,950
Enterprise User $ 7,250
Compare Licenses
Tailored for You
  • Dedicated Research on any specifics segment or region.
  • Focused Research on specific players in the market.
  • Custom Report based only on your requirements.
  • Flexibility to add or subtract any chapter in the study.
  • Historic data from 2014 and forecasts outlook till 2040.
  • Flexibility of providing data/insights in formats (PDF, PPT, Excel).
  • Provide cross segmentation in applicable scenario/markets.