Intrauterine Contraceptive Devices Market Segmentation
Intrauterine Contraceptive Devices Market By Product Type (USD Million, 2022-2035)
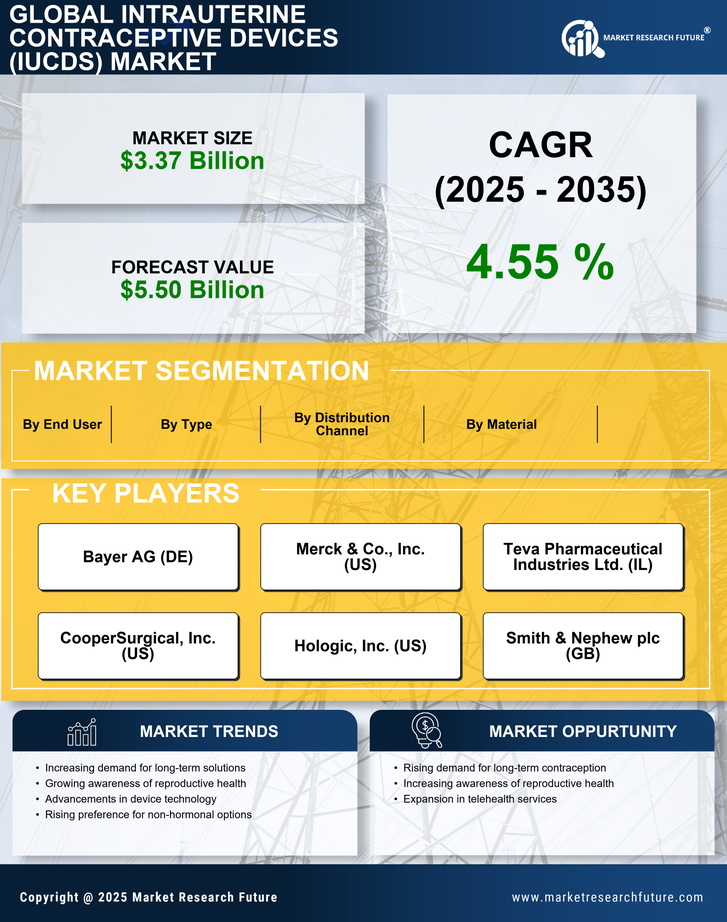
- Copper Intrauterine Device
- Hormonal Intrauterine Device
- Non-Hormonal Intrauterine Device
Intrauterine Contraceptive Devices Market By Material Type (USD Million, 2022-2035)
- Plastic
- Copper
- Silicone
- Steel
Intrauterine Contraceptive Devices Market By End User (USD Million, 2022-2035)
- Hospitals
- Clinics
- Home Care
Intrauterine Contraceptive Devices Market By Duration of Use (USD Million, 2022-2035)
- Short-term
- Long-term
Intrauterine Contraceptive Devices Market By Age Group (USD Million, 2022-2035)
- Adolescents
- Adults
- Women of Reproductive Age