Segmentation Quick Reference
| Dimension | Sub-Segments | Dominant Segment | Fastest Growing Segment |
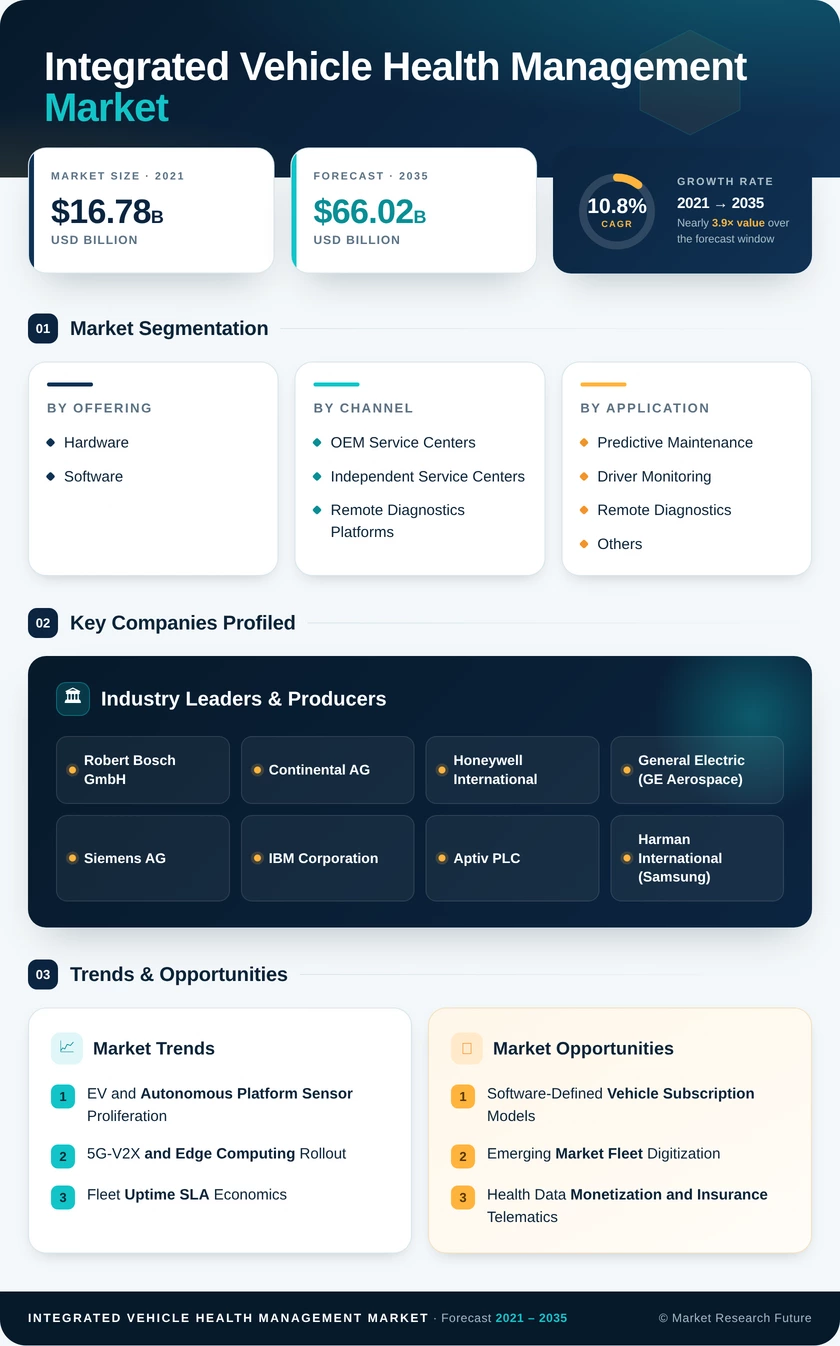
| By Offering | Hardware, Software | Hardware (58.8% share, 2024) | Software (13.7% CAGR) |
| By Channel | OEM Service Centers, Independent Service Centers, Remote Diagnostics Platforms | OEM Service Centers (44.9% share, 2024) | Remote Diagnostics Platforms (16.5% CAGR) |
| By Application | Predictive Maintenance, Driver Monitoring, Remote Diagnostics, Others | Predictive Maintenance (33.7% share, 2024) | Driver Monitoring (18.1% CAGR) |
| By End-User | OEMs, Fleet Operators, Service Providers, Others | OEMs (38.2% share, 2024) | Service Providers (15.8% CAGR) |
| By Vehicle Type | Passenger Vehicles, Light Commercial Vehicles, Medium & Heavy Commercial Vehicles | Passenger Vehicles (48.4% share, 2024) | Medium & Heavy Commercial Vehicles (13.1% CAGR) |
| By Geography | North America, Europe, Asia-Pacific, South America, Middle East & Africa | Asia-Pacific (35.4% share, 2024) | Asia-Pacific (14.8% CAGR) |
Market Segmentation Overview
By Offering
| Sub-Segment | Key Trend |
| Hardware | Sensor-dense EV and autonomous platforms driving per-vehicle content increases |
| Software | Transition from perpetual licenses to recurring SaaS diagnostic subscriptions |
Hardware encompasses the physical sensor arrays, ECU modules, communication gateways, and wiring harnesses that capture vehicle health data at the component level. Software covers cloud analytics engines, edge inference models, OTA update management platforms, and fleet health dashboard applications.
By Channel
| Sub-Segment | Key Trend |
| OEM Service Centers | Proprietary data access and warranty integration maintain channel dominance |
| Independent Service Centers | Aftermarket cost competitiveness; growing access to OEM-equivalent data via regulations |
| Remote Diagnostics Platforms | Fleet demand for centralized multi-brand health dashboards |
OEM service centers retain share through exclusive access to deep vehicle health data, while independent centers grow as right-to-repair legislation opens diagnostic access. Remote diagnostics platforms are the disruption vector, enabling fault triage without physical vehicle presence.
By Application
| Sub-Segment | Key Trend |
| Predictive Maintenance | ML-driven remaining-useful-life predictions reduce unplanned downtime 25–35% |
| Driver Monitoring | EU GSR 2019/2144 mandates cabin attention detection for new vehicles |
| Remote Diagnostics | Fleet management integration; OTA fault code analysis |
| Others | Emissions compliance tracking; warranty analytics |
Predictive maintenance remains the anchor application due to its immediate and measurable ROI. Driver monitoring is scaling rapidly as regulatory mandates expand from Europe to China and India.
By End-User
| Sub-Segment | Key Trend |
| OEMs | Embedding IVHM into base vehicle platforms as standard feature |
| Fleet Operators | Uptime SLAs in logistics contracts drive non-discretionary demand |
| Service Providers | Third-party telematics platforms serve mixed-fleet operators |
| Others | Government, defense, and specialty vehicle applications |
OEMs capture the largest share through factory-embedded health modules, while service providers grow fastest by offering brand-agnostic fleet health analytics.
By Vehicle Type
| Sub-Segment | Key Trend |
| Passenger Vehicles | Connected-car features and consumer health dashboard demand |
| Light Commercial Vehicles | Last-mile delivery fleet health management |
| Medium & Heavy Commercial Vehicles | Highest per-vehicle downtime cost drives strongest CAGR |
Passenger vehicles lead by volume, but the economic case for health management is strongest in commercial segments where a single breakdown can cost hundreds of dollars per hour in lost productivity.