

Semiconductor & Electronics Market Segmentation
Semiconductor & Electronics By Type (USD Billion, 2025-2035)
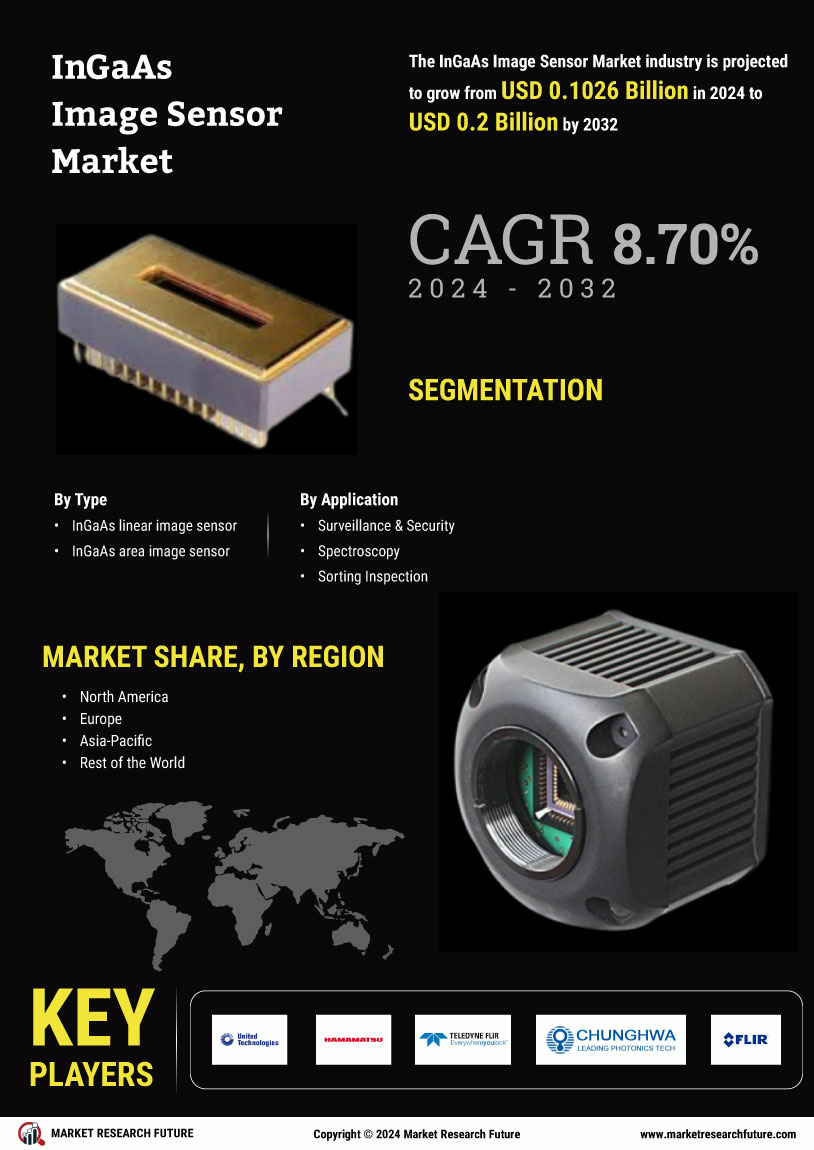
- InGaAs linear image sensor
- InGaAs area image sensor
Semiconductor & Electronics By Application (USD Billion, 2025-2035)
- Surveillance & Security
- Spectroscopy
- Sorting Inspection
- Optical Coherence Tomography
- Fiber Optic Communication


