InGaAs Camera Market (2026 – 2035)

ID: MRFR/SEM/6330-CR 111 Pages Ankit Gupta Last Updated: September 15, 2026
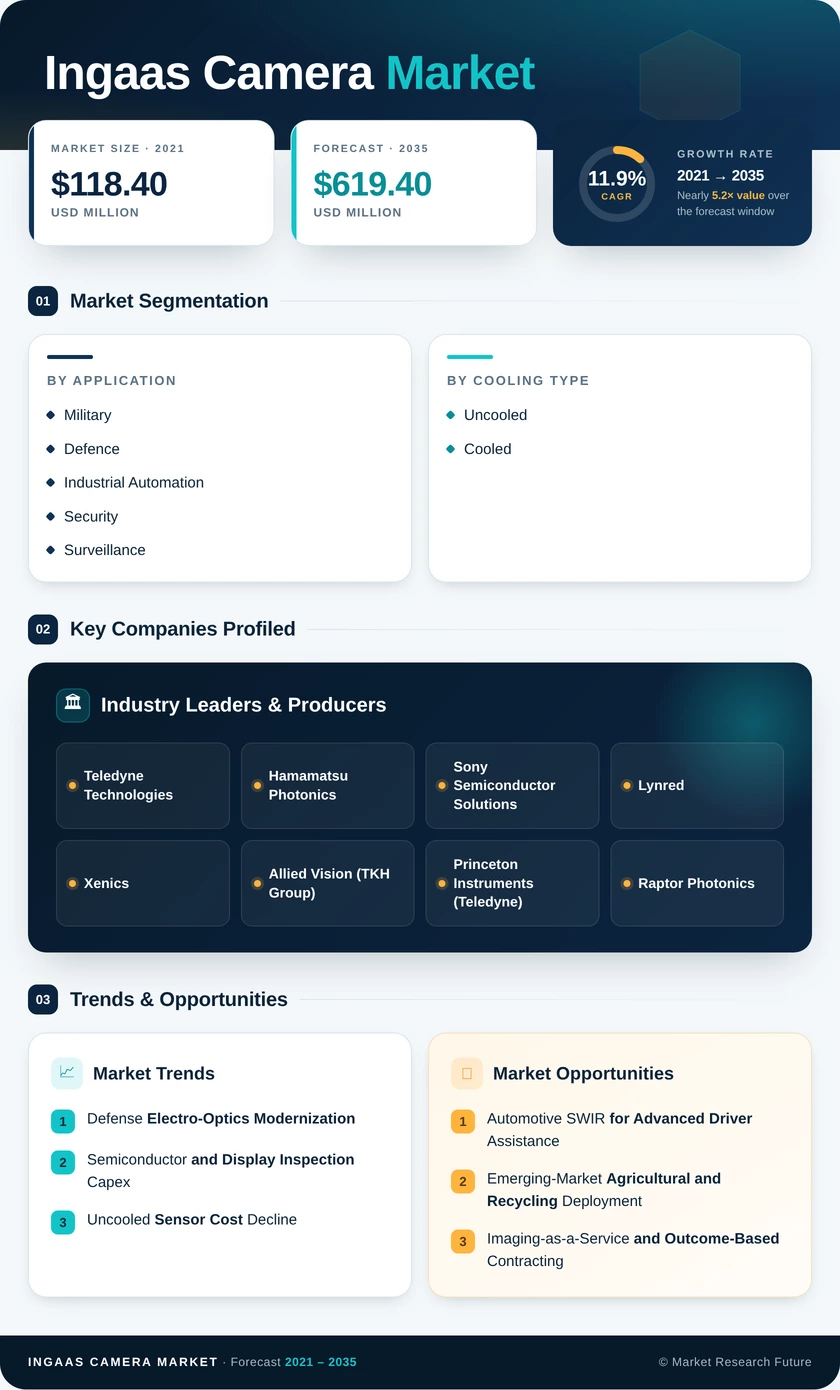
InGaAs Camera Market Size, Share and Research Report By Application (Military and Defence, Industrial Automation, Security and Surveillance, Other Applications), By Cooling Type (Uncooled, Cooled) and By Regional (North America, Europe, Asia-Pacific, South America, Middle East & Africa) - Industry Forecast to 2035.
InGaAs Camera Market
Market Size
Forecast Period2026-2035
CAGR (2026-2035)11.9%
2025 Market SizeUSD 185.9 Million
2035 Market SizeUSD 619.4 Million
Key Players
Teledyne Technologies
Hamamatsu Photonics
Sony Semiconductor Solutions
Lynred
Xenics
Allied Vision
Opportunities
  • Automotive SWIR for Advanced Driver Assistance
  • Emerging-Market Agricultural and Recycling Deployment
  • Imaging-as-a-Service and Outcome-Based Contracting
  1. 1 Market Summary | |
    1. 1.1 Study Assumptions & Market Definition | |
    2. 1.2 Scope of the Study | |
    3. 1.3 Research Methodology | |
  2. 2 Key Report Takeaways | |
    1. 2.1 By Application | |
    2. 2.2 By Cooling Type | |
    3. 2.3 By Region | |
  3. 3 Market Size and Forecast (2021–2035) | |
    1. 3.1 Historical Market Size (2021–2024) | |
    2. 3.2 Base Year Estimate (2025) | |
    3. 3.3 Forecast Market Size (2026–2035) | |
    4. 3.4 Year-over-Year Growth Analysis | |
  4. 4 Driver Impact Analysis | |
    1. 4.1 Defense Electro-Optics Modernization | |
    2. 4.2 Semiconductor and Display Inspection Capex | |
    3. 4.3 Uncooled Sensor Cost Decline | |
    4. 4.4 Lithium Battery Quality Inspection Mandates | |
    5. 4.5 Food and Agricultural Sorting Automation | |
    6. 4.6 Solar Cell and PV Manufacturing Scale-Up | |
    7. 4.7 Hyperspectral Imaging in Life Sciences | |
  5. 5 Restraints Impact Analysis | |
    1. 5.1 High Unit Acquisition Cost | |
    2. 5.2 Export Control and ITAR Restrictions | |
    3. 5.3 Indium Supply Concentration | |
    4. 5.4 Competing Sensor Technologies | |
    5. 5.5 Integration and Calibration Complexity | |
  6. 6 Opportunities | |
    1. 6.1 Automotive SWIR for Advanced Driver Assistance | |
    2. 6.2 Emerging-Market Agricultural and Recycling Deployment | |
    3. 6.3 Imaging-as-a-Service and Outcome-Based Contracting | |
    4. 6.4 Semiconductor Advanced Packaging Inspection | |
    5. 6.5 Space and High-Altitude Earth Observation | |
  7. 7 Regional Market Share and Country-Level Analysis | |
    1. 7.1 North America | | |
      1. 7.1.1 US | | |
      2. 7.1.2 Canada | | |
      3. 7.1.3 Mexico | |
    2. 7.2 Europe | | |
      1. 7.2.1 Germany | | |
      2. 7.2.2 UK | | |
      3. 7.2.3 France | | |
      4. 7.2.4 Italy | | |
      5. 7.2.5 Spain | | |
      6. 7.2.6 Nordic Countries | | |
      7. 7.2.7 Russia | | |
      8. 7.2.8 Rest of Europe | |
    3. 7.3 Asia-Pacific | | |
      1. 7.3.1 China | | |
      2. 7.3.2 India | | |
      3. 7.3.3 Japan | | |
      4. 7.3.4 South Korea | | |
      5. 7.3.5 ASEAN | | |
      6. 7.3.6 Rest of Asia-Pacific | |
    4. 7.4 South America | | |
      1. 7.4.1 Brazil | | |
      2. 7.4.2 Argentina | | |
      3. 7.4.3 Rest of South America | |
    5. 7.5 Middle East & Africa | | |
      1. 7.5.1 Saudi Arabia | | |
      2. 7.5.2 UAE | | |
      3. 7.5.3 South Africa | | |
      4. 7.5.4 Egypt | | |
      5. 7.5.5 Rest of MEA | |
  8. 8 Future Outlook (2026–2035) | |
    1. 8.1 Embedded Intelligence and Autonomous Inspection | |
    2. 8.2 Detector Cost Curves and Volume Applications | |
    3. 8.3 Energy Transition Manufacturing Buildout | |
    4. 8.4 Emissions Monitoring and Regulatory Reporting | |
  9. 9 Segmentation Analysis | |
    1. 9.1 By Application | | |
      1. 9.1.1 Military and Defence | | |
      2. 9.1.2 Industrial Automation | | |
      3. 9.1.3 Security and Surveillance | | |
      4. 9.1.4 Other Applications | |
    2. 9.2 By Cooling Type | | |
      1. 9.2.1 Uncooled | | |
      2. 9.2.2 Cooled | |
  10. 10 Competitive Landscape | |
    1. 10.1 Market Concentration Analysis | |
    2. 10.2 Competitive Benchmarking Matrix | |
    3. 10.3 Company Profiles | | |
      1. 10.3.1 Teledyne Technologies | | |
      2. 10.3.2 Hamamatsu Photonics | | |
      3. 10.3.3 Sony Semiconductor Solutions | | |
      4. 10.3.4 Lynred | | |
      5. 10.3.5 Xenics | | |
      6. 10.3.6 Allied Vision | | |
      7. 10.3.7 Princeton Instruments | | |
      8. 10.3.8 Raptor Photonics | | |
      9. 10.3.9 Photonic Science | | |
      10. 10.3.10 First Light Imaging | | |
      11. 10.3.11 New Imaging Technologies | |
  11. 11 Recent News & Developments | |
  12. 12 Report Scope and Methodology | |
    1. 12.1 Study Period & Base Year | |
    2. 12.2 Data Sources & Citations | |
    3. 12.3 Abbreviations | |
  13. 13 Detailed Sources and Citations | |
  14. 14 Frequently Asked Questions | | LIST OF TABLES | |
  15. TABLE 1 Global InGaAs Camera Market Size & Forecast, by Revenue (USD Million), 2021–2035 | |
  16. TABLE 2 Global InGaAs Camera Market – Year-over-Year Growth Analysis, 2021–2035 | |
  17. TABLE 3 Driver Impact Analysis – Global InGaAs Camera Market, 2026–2035 | |
  18. TABLE 4 Restraint Impact Analysis – Global InGaAs Camera Market, 2026–2035 | |
  19. TABLE 5 Global InGaAs Camera Market Size, by Region, 2021–2035 (USD Million) | |
  20. TABLE 6 North America InGaAs Camera Market Size, by Country, 2021–2035 (USD Million) | |
  21. TABLE 7 Europe InGaAs Camera Market Size, by Country, 2021–2035 (USD Million) | |
  22. TABLE 8 Asia-Pacific InGaAs Camera Market Size, by Country, 2021–2035 (USD Million) | |
  23. TABLE 9 South America InGaAs Camera Market Size, by Country, 2021–2035 (USD Million) | |
  24. TABLE 10 Middle East & Africa InGaAs Camera Market Size, by Country, 2021–2035 (USD Million) | |
  25. TABLE 11 Global InGaAs Camera Market Size, by Application, 2021–2035 (USD Million) | |
  26. TABLE 12 Global InGaAs Camera Market Size, by Cooling Type, 2021–2035 (USD Million) | |
  27. TABLE 13 North America InGaAs Camera Market Size, by Application, 2021–2035 (USD Million) | |
  28. TABLE 14 North America InGaAs Camera Market Size, by Cooling Type, 2021–2035 (USD Million) | |
  29. TABLE 15 Europe InGaAs Camera Market Size, by Application, 2021–2035 (USD Million) | |
  30. TABLE 16 Europe InGaAs Camera Market Size, by Cooling Type, 2021–2035 (USD Million) | |
  31. TABLE 17 Asia-Pacific InGaAs Camera Market Size, by Application, 2021–2035 (USD Million) | |
  32. TABLE 18 Asia-Pacific InGaAs Camera Market Size, by Cooling Type, 2021–2035 (USD Million) | |
  33. TABLE 19 South America InGaAs Camera Market Size, by Application, 2021–2035 (USD Million) | |
  34. TABLE 20 Middle East & Africa InGaAs Camera Market Size, by Application, 2021–2035 (USD Million) | |
  35. TABLE 21 Competitive Benchmarking Matrix – Global InGaAs Camera Market, 2026 | |
  36. TABLE 22 Company Profiles – Key Players, Global InGaAs Camera Market | |
  37. TABLE 23 Recent Developments & Strategic Announcements, 2023–2025 | |
  38. TABLE 24 Report Scope & Methodology Summary | |
  39. TABLE 25 Detailed Sources and Citations | | LIST OF FIGURES | |
  40. FIGURE 1 Global InGaAs Camera Market – Market Dynamics Overview | |
  41. FIGURE 2 Global InGaAs Camera Market – Industry Value Chain Analysis | |
  42. FIGURE 3 Global InGaAs Camera Market – Porter's Five Forces Analysis | |
  43. FIGURE 4 Global InGaAs Camera Market Size Trend, 2021–2035 (USD Million) | |
  44. FIGURE 5 Global InGaAs Camera Market – Year-over-Year Growth Trend, 2022–2035 | |
  45. FIGURE 6 Market Share by Application Segment, 2025 vs 2035 | |
  46. FIGURE 7 Market Share by Cooling Type Segment, 2025 vs 2035 | |
  47. FIGURE 8 Regional Market Share Distribution, 2025 | |
  48. FIGURE 9 Regional Market Share Distribution, 2035 | |
  49. FIGURE 10 Asia-Pacific Country-Level Growth Comparison, 2026–2035 | |
  50. FIGURE 11 Competitive Landscape – Estimated Revenue Share Positioning, 2026 | |
  51. FIGURE 12 Driver and Restraint Impact Weighting Chart

Segmentation Quick Reference

DimensionSub-SegmentsDominant SegmentFastest Growing Segment
By ApplicationMilitary and Defence; Industrial Automation; Security and Surveillance; Other ApplicationsMilitary and Defence (34.5% share)Industrial Automation (12.4% CAGR)
By Cooling TypeUncooled; CooledUncooled (61.2% share)Cooled (10.7% CAGR)


Market Segmentation Overview

By Application

Sub-SegmentKey Trend
Military and DefenceEnhanced vision systems for covert navigation and eye-safe laser designation
Industrial AutomationShift from statistical sampling to full inline inspection on semiconductor and battery lines
Security and SurveillancePerimeter and border systems specified for smoke, haze, and dust penetration
Other ApplicationsHyperspectral research, optical coherence tomography, and art authentication


Military and Defence leads on the strength of soldier-portable and vehicle-mounted programs where no alternative detector chemistry delivers both haze penetration and 1550 nm laser compatibility. Industrial Automation grows fastest because advanced packaging inspection and electrode coating control require imaging through silicon and coating layers that visible sensors cannot resolve. Security and Surveillance expands more slowly, constrained by unit cost relative to thermal alternatives in fixed installations. Other Applications remain small in volume but sustain premium pricing through research and medical instrumentation buyers with dedicated grant funding.

By Cooling Type

Sub-SegmentKey Trend
UncooledFalling dark current at room temperature widens the addressable application range
CooledThermoelectric and deep-cooled designs hold low-flux scientific and astronomical work


Uncooled configurations dominate because production lines and unmanned platforms cannot absorb the mass, power draw, and additional failure modes that thermoelectric cooling introduces. Cooled units grow at a respectable rate but through absolute expansion of research instrumentation budgets rather than share recapture — astronomers and spectroscopists buying long-exposure systems have no uncooled substitute where dark current sets the detection floor. As detector materials improve, the crossover point where cooling becomes necessary continues to move toward lower signal levels, steadily favoring uncooled designs among industrial and defense buyers.




Download PDF ×

We do not share your information with anyone. However, we may send you emails based on your report interest from time to time. You may contact us at any time to opt-out.