• Cat-intel
  • MedIntelliX
  • Resources
  • About Us
  • English
    Chinese
    French
    Japanese
    Korean
    German
    Spanish

    Industrial Boilers Market Size

    ID: MRFR/E&P/0477-HCR
    128 Pages
    Chitranshi Jaiswal
    September 2025

    Industrial boiler Market Research Report Information By Fuel Boiler type (Natural Gas, Coal, Oil, Others), By Boiler type (Fire-Tube, Water-Tube), By Rated Capacity (0.1 to 0.35 MW, 0.35 to 0.7 MW, 0.7 MW to 1 MW), By End-User (Food & Beverages, Chemicals, Metal, Plastic, Textile, Wood, Paper, District heating, and Others) and By Region -Global Forecast to 2035

    Share:
    Download PDF ×

    We do not share your information with anyone. However, we may send you emails based on your report interest from time to time. You may contact us at any time to opt-out.

    Industrial Boilers Market Infographic
    $ 4,950.0
    $ 5,950.0
    $ 7,250.0

    Industrial Boilers Size

    Industrial Boilers Market Growth Projections and Opportunities

    Everywhere in the world, people need more energy. This has a big impact on the global market for industrial boilers, which are used in many areas such as manufacturing, chemical processing, and power generation. Businesses need heating systems that are easy to use and work well as they get newer and bigger. This is making more people want industrial boilers. Making rules about the world is another important part of the market. Every government in the world has strict rules in place to try to lower waste and get people to do things that are better for the earth. Because they pollute the air when they burn, commercial boilers need to follow environmental rules. This is why there is a lot of interest in better heating systems that use less energy. This has caused new ideas and success in the area. One of the most important things that impacts the Industrial Boilers Market is the market. A lot of things are making the market grow, like higher pay, more factories, and better roads and bridges. The need for commercial boilers has gone through the roof, especially in emerging countries, as businesses need more and more energy. In rich countries, when businesses buy new boiler systems that work better, they often replace their old ones and improve their new ones. Big changes in the market for workplace boilers are also caused by the price and quantity of fuel. How much they cost to run and how bad they are for the environment depend on the fuel type used in industrial boilers. Businesses are looking into green and alternative energy sources because they are scared about running out of energy and the effects of fuel prices going up. Then, more and more commercial boilers are being made that can use different types of fuel, like natural gas, hydrogen, biofuel, and so on. The Industrial Boilers Market moves all the time to keep up with new products, services, and technologies. More and more boilers are getting digital parts added to them so they can be controlled, improved, and kept an eye on. As part of the greater push toward Industry 4.0 and the Internet of Things, smart boilers help cut down on energy use, improve efficiency, and keep things in good shape before they break. Competition and how quickly companies join are two more things that can change the Industrial Boilers business. Mergers, sales, deals, and the appearance of big players all change the level of competition in the market. The goods and prices that are sold then have an effect on the competition. In order to get ahead of the competition, companies in the market are giving better and more eco-friendly ways to heat their homes. As people worry more about the earth and climate change, they change what they buy and how much they spend. In the business world, people are always looking for technology that is better for the environment and cleaner. Boilers for businesses are the same. Because of this, boilers are being made that use less energy and leave behind less carbon.

    Industrial Boilers Market Size Graph

    Market Summary

    As per Market Research Future Analysis, the Global Industrial Boiler Market was valued at USD 4,679.0 Million in 2023 and is projected to grow to USD 9,407.5 Million by 2030, with a CAGR of 10.73% from 2024 to 2030. The market is driven by increasing demand in the food and beverage industry, clean technologies in the chemical sector, and the need for electricity. However, high capital investment and installation costs may hinder growth. The hospitality industry significantly contributes to market demand due to the necessity of steam boilers for hot water and heating. The Asia-Pacific region leads the market, fueled by rapid industrialization and urbanization in countries like China and India.

    Key Market Trends & Highlights

    Key trends influencing the Industrial Boiler Market include technological advancements and sector-specific demands.

    • Natural Gas segment projected to grow at a CAGR of 6.61% during the forecast period. Fire tube boilers held a 65.3% market share in 2022, favored for their efficiency and compact design. High-capacity boilers (0.7 to 1 MW) expected to dominate due to their application in medium to large industries. Chemical sector anticipated to maintain the largest market share, driven by diverse applications in steam and thermal energy.

    Market Size & Forecast

    2023 Market Size USD 4,679.0 Million
    2030 Market Size USD 9,407.5 Million
    CAGR (2024-2030) 10.73%
    Largest Regional Market Share in 2024 Asia-Pacific

    Major Players

    <p>Key players include Robert Bosch GmbH, IHI Corporation, General Electric Company, Alfa Laval, and Wuxi Zozen Boilers Co., Ltd.</p>

    Market Trends

    Increasing Demand from the Hospitality Industry

    The hospitality industry has a professional mandate to ensure that their guests always have access to hot water on demand, so steam boiler heat and hot water needs are essential for any resort or hotel. Steam boilers may also be used for a variety of other critical operations, such as maintaining a consistent temperature throughout the property, cleaning guest rooms and sanitation of towels, uniforms, and other laundry services, and foodservice and preparation, to name a few.

    Hotel steam boilers can suffer from heavy wear and tear, as well as scale accumulation, due to 24-7 usage and fluctuations and high pressure in the hot water system demand during times of peak usage. The hotel will be unable to provide critical services to its guests if the boiler system fails. As a result, steam boilers are a critical asset for the hospitality industry, driving the overall market.

    Some of the key factors for the growth of the hospitality industry in the major economies include rising disposable incomes, growth in international tourism, penetration of international hotel brands, and increased government investments for developing the tourism industry. In Asia Pacific region, Indonesia, Thailand, and Vietnam are leading the way in terms of development. The majority of new hotel rooms in South East Asia have been focused on major urban and suburban markets in the upper-midscale to upper-upscale market segments in recent years, resulting in an unprecedented hotel development boom.

    Thailand is the market leader in the hotel residence sector, accounting for 30% of the total supply forecasted for the region. It is the world's ninth-most visited country and Southeast Asia's most visited country. With five-star hotels, spas, and resorts, as well as medical tourism and wellness, Thailand has become a hotspot for luxury. In addition, the country has upgraded international airports in order to boost tourism.

    Europe is the second-most visited country in the world, with domestic hotels accounting for roughly 70% of the total hotel market. In addition, the Indonesian government is focusing on expanding its tourist destinations in order to increase foreign tourist arrivals and domestic trips (the new Balis). Furthermore, demand from international investors for both investment and lifestyle purposes has increased dramatically. Expansion of foreign property ownership reforms is expected to drive transaction volume even higher, given the region's favorable price competitiveness compared to other major markets.

    <p>The Global Industrial Boiler Market is poised for growth as industries increasingly prioritize energy efficiency and sustainability in their operations.</p>

    U.S. Department of Energy

    Industrial Boilers Market Market Drivers

    Market Growth Projections

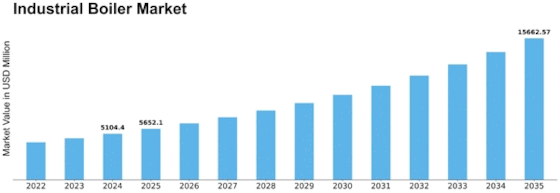
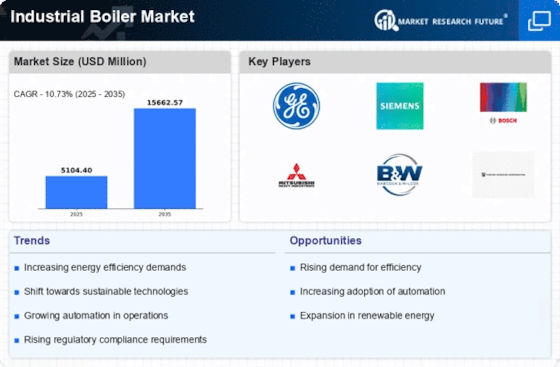
    The Global Industrial Boiler Market Industry is projected to experience substantial growth in the coming years. With an estimated market value of 5.1 USD Billion in 2024, the industry is poised for a remarkable expansion trajectory. The anticipated compound annual growth rate of 10.73 percent from 2025 to 2035 indicates a robust demand for industrial boilers across various sectors. This growth is driven by factors such as increasing energy efficiency requirements, technological advancements, and the expansion of manufacturing industries. As industries continue to invest in modern boiler systems, the market is likely to evolve, reflecting the changing dynamics of energy consumption and environmental sustainability.

    Rising Demand for Energy Efficiency

    The Global Industrial Boiler Market Industry experiences a notable surge in demand for energy-efficient solutions. Industries are increasingly focusing on reducing operational costs and minimizing environmental impact. This trend is driven by stringent regulations aimed at lowering greenhouse gas emissions. For instance, energy-efficient boilers can reduce fuel consumption by up to 20 percent, which translates into significant cost savings. As a result, the market is projected to reach 5.1 USD Billion in 2024, with a growing emphasis on sustainable practices across various sectors. This shift not only enhances operational efficiency but also aligns with global sustainability goals.

    Shift Towards Renewable Energy Sources

    The Global Industrial Boiler Market Industry is witnessing a paradigm shift towards renewable energy sources. Industries are increasingly exploring biomass, solar, and waste heat recovery systems as alternatives to traditional fossil fuels. This transition is driven by the need for sustainable energy solutions and the desire to reduce carbon footprints. For example, biomass boilers utilize organic materials, offering a renewable energy source that aligns with global sustainability goals. As this trend gains momentum, the market is expected to expand significantly, potentially reaching 15.7 USD Billion by 2035. This shift not only supports environmental initiatives but also enhances energy security for industries.

    Technological Advancements in Boiler Design

    Technological innovations play a pivotal role in shaping the Global Industrial Boiler Market Industry. The introduction of advanced boiler designs, such as modular and condensing boilers, enhances performance and reliability. These innovations allow for better heat recovery and lower emissions, catering to the evolving needs of industries. For example, the integration of smart technology enables real-time monitoring and predictive maintenance, reducing downtime. As industries adopt these cutting-edge solutions, the market is expected to witness substantial growth, potentially reaching 15.7 USD Billion by 2035. This technological evolution not only improves efficiency but also supports compliance with increasingly stringent regulations.

    Growth in Manufacturing and Process Industries

    The Global Industrial Boiler Market Industry is significantly influenced by the expansion of manufacturing and process industries. As these sectors grow, the demand for steam and hot water generation increases, driving the need for industrial boilers. Industries such as food processing, pharmaceuticals, and chemicals rely heavily on efficient boiler systems for their operations. The continuous growth in these sectors indicates a robust market potential, with projections suggesting a compound annual growth rate of 10.73 percent from 2025 to 2035. This growth trajectory underscores the critical role of industrial boilers in supporting production processes and enhancing overall operational efficiency.

    Regulatory Compliance and Environmental Standards

    Regulatory compliance is a crucial driver for the Global Industrial Boiler Market Industry. Governments worldwide are implementing stringent environmental regulations to curb emissions and promote cleaner technologies. Industries are compelled to adopt boilers that meet these standards, leading to increased investments in advanced boiler systems. For instance, the implementation of emission reduction targets has prompted many companies to upgrade their existing boiler systems. This trend not only ensures compliance but also enhances operational efficiency. As a result, the market is poised for growth, with a projected value of 5.1 USD Billion in 2024, reflecting the industry's commitment to sustainability and regulatory adherence.

    Market Segment Insights

    Industrial boiler by Boiler type Insights

    <p>The Industrial boiler Market segmentation, based on the boiler type, the Industrial boiler Market has been divided into Natural Gas, Coal, Oil, and Others. In 2023, the Natural Gas segment drove the Industrial boilers Market by holding a substantial market share in global market. It is projected to register a CAGR of 6.61% during the projected timeframe. the global industrial boilers market has been segmented into fire tube and water tube. The fire tube segment is expected to hold the largest market share during the forecast period. In 2022, the fire segment held a 65.3% share of the global market.</p>

    <p>The fire tube segment is attributed to held the largest market share because, the design of fire tube boilers is typically more efficient than other boiler types, making them a suitable option for installations with limited space. This makes inspection and maintenance easy as the pipes can be cleaned and maintained outside.</p>

    <p>Moreover, it can produce steam quickly due to its design, which allows for rapid heat transfer from the hot gases to the water. Fire-tube boilers remain a popular choice for many industrial applications, especially in smaller-scale installations where their compact design and ease of maintenance are advantageous.</p>

    Industrial boiler By Rated Capacity Insights

    <p>Based on the Rated Capacity, the global industrial boilers market has been segmented into 0.1 to 0.35 MW, 0.35 to 0.7 MW, and 0.7 to 1 MW. The 0.7 to 1 MW segment is expected to hold the largest market share during the forecast period. This high share is attributable as the boilers of this capacity range are larger and are typically used in medium to large industrial applications where higher heat output is required. It can be utilized in industrial operations with higher heat demand, larger commercial facilities, or district heating systems.</p>

    Industrial boiler By Temperature Insights

    <p>Based on Temperature, the global industrial boilers market has been segmented into low, medium and high. The high segment holds the largest market share during the forecast period. The High segment is attributed to held the largest market share because, these boilers find application in <a href="https://www.marketresearchfuture.com/reports/power-generation-equipment-market-28763">power generation</a>, chemical processing, petroleum, and other industries across different industries. These boilers are engineered to withstand extreme pressure, which makes them suitable for heating water or steam. The industrial process can be fulfilled by this boiler with high capacity.</p>

    Industrial boiler By End User Insights

    <p>Based on end-user, the global industrial boilers market has been segmented into chemical, food&amp; Beverages, metal, plastics, Textile, wood, paper, district heating and others. The Chemicals segment hold the largest market share during the forecast period. The Chemicals segment is attributed to held the largest market share because in the chemical industry, industrial boilers play a vital role in various processes, providing steam, hot water, and thermal energy for a wide range of applications that include <a href="https://www.marketresearchfuture.com/reports/heat-transfer-fluid-market-1571">Heat Transfer</a>, Steam Generation, Power Generation, Boiler Feedwater Treatment, Process Heating, and Specialized Process.</p>

    Get more detailed insights about Industrial Boilers Market Research Report – Global Forecast till 2030

    Regional Insights

    Based on Region, the Industrial boiler market is segmented into North America, Europe, Asia-Pacific, Middle East & Africa, and Latin America. The Asia Pacific Industrial boiler market held the maximum market share and is also expected to account for the significant revenue share during the forecast period. The Asia-Pacific segment hold the largest market share during the forecast period. The Asia-Pacific segment is attributed to held the largest market share because the industrial boiler market in Asia-Pacific is growing due to rapid industrialization, urbanization, and economic growth in countries such as China, India, Japan, Korea, and other Asian countries.

    Manufacturing, chemical processing, and food processing are among the sectors where industrial boilers are gaining popularity. 

    Key Players and Competitive Insights

    In the Industrial boilers market, several key players have established themselves as major contributors to the industry's growth and innovation. Among these prominent players are Robert Bosch GmbH, IHI Corporation, General Electric Company, GETABEC Public Company Limited, Thai Steam Service & Supply Co. Ltd, Alfa Laval, Wuxi Zozen Boilers Co., Ltd, Atlas Copco AB, and others holding particularly strong positions.

    The competitive landscape offers an analysis of the key developments by the companies operating in the global market in the last three years. The market for Steam Boiler is projected to witness healthy growth during the forecast period, owing to the increasing demand from the healthcare sector. The market represents strong numbers in terms of consumption. 

    Alfa Laval: Alfa Laval is a global leader in producing high-quality products for heat transfer, Boilers, separation, and fluid handling. The company offers products in 3 segments: energy, food & water, and marine. The products, systems, and services of Alfa Laval are sold in more than 100 countries, and the company has a presence throughout North America, Europe, Asia-Pacific, Latin America, and Middle East & Africa. The production system of Alfa Laval is built on its three core technologies to guarantee the highest possible capacity utilization throughout all its manufacturing facilities.

    All divisions market products, which can be applied to numerous processes and fields. The company's operations are concentrated on key production chain tasks like enhancing the manufacturing footprint generally, automation, digitization, and sustainability concerns. The work related to the supply chain is handled by operations development.

    Wuxi ZOZEN Boilers Co., Ltd: Wuxi ZOZEN Boilers Co., Ltd. has been committed to manufacturing, researching, and developing industrial boilers since its foundation in 1988.  The company has eight modern workshops with an annual capacity of 12,000 tons/hour, and the annual output is USD 100 million. The company's business segment includes gas/oil boilers, coal boilers, biomass boilers, thermal oil heaters, and auxiliary parts. ZOZEN has obtained over 50 national patents, ASME "S" and "U" stamps and many other international certificates.  

    Key Companies in the Industrial Boilers Market market include

    Industry Developments

    Future Outlook

    Industrial Boilers Market Future Outlook

    <p>The Global Industrial Boiler Market is poised for growth at 10.73% CAGR from 2024 to 2035, driven by rising energy demands, technological advancements, and regulatory support for sustainable practices.</p>

    New opportunities lie in:

    • <p>Invest in smart boiler technologies to enhance efficiency and reduce emissions. Expand into emerging markets with tailored solutions for local industries. Develop hybrid systems integrating renewable energy sources to meet evolving customer needs.</p>

    <p>By 2035, the market is expected to achieve robust growth, reflecting a dynamic and innovative landscape.</p>

    Market Segmentation

    Industrial Boiler type Outlook

    • Fire-Tube
    • Water-Tube

    Industrial boiler End user Outlook

    • Food & Beverages
    • Chemicals
    • Metal
    • Plastic
    • Textile
    • Wood
    • Paper
    • District Energy
    • Other

    Industrial boiler Regional Outlook

    • {"North America"=>["US"
    • "Canada"]}
    • {"Europe"=>["Germany"
    • "UK"
    • "France"
    • "Spain"
    • "Italy"
    • "Russia"
    • "Rest of Europe"]}
    • {"Asia-Pacific"=>["China"
    • "Japan"
    • "India"
    • "South Korea"
    • "Rest of Asia-Pacific"]}
    • {"Latin America"=>["Brazil"
    • "Mexico"
    • "Argentina"
    • "Rest of Latin America"]}
    • {"Middle East & Africa"=>["GCC Countries"
    • "South Africa"
    • "Rest of Middle East & Africa"]}

    Industrial boiler Fuel Type Outlook

    • Natural Gas
    • Oil
    • Coal
    • Others

    Industrial boiler Temperature Outlook

    • Low
    • Medium
    • High

    Industrial boiler Rated Capacity Outlook

    • 1 to 0.35 MW
    • 35 to 0.7 MW
    • 7 to 1 MW

    Report Scope

    Report Attribute/MetricDetails
    Market Size 2023USD 4,679.0 Million
    Market Size 2024USD 5,104.4 Million
    Market Size 2030USD 9,407.5 Million
    Compound Annual Growth Rate (CAGR)10.73% (2024-2030)
    Base Year2023
    Forecast Period2024-2030
    Historical Data2019 to 2022
    Forecast UnitsValue (USD Million)
    Report CoverageRevenue Forecast, Competitive Landscape, Growth Factors, and Trends
    Segments CoveredBoiler type, Rated Capacity, End User, Temperature, and Region
    Geographies CoveredNorth America, Europe, Asia Pacific, south America, middle east & Africa
    Countries CoveredUS, Canada, Germany, UK, France, Spain, Italy, Russia, China, Japan, India, South Korea, Brazil, Mexico, Argentina, South Africa, GCC countries
    Key Companies ProfiledAlfa Laval, Wuxi ZOZEN Boilers Co., Ltd, Atlas Copco, Isaac Boilers Private Limited, Hurst Boiler and Welding Company, Inc., Ural-Power, Viessmann, Precision Boilers, EPCB Boiler, Hoval, IHI Corporation, Thermax Ltd., Robert Bosch GmbH, General Electric Company, Henan Province Sitong Boiler Co., Ltd.
    Key Market Opportunities·         Increasing demand for compact steam boilers
    Key Market Dynamics·         Increasing demand from the hospitality industry

    Market Highlights

    Author

    Chitranshi Jaiswal
    Research Analyst Level I

    She holds an experience of about 6+ years in market research and business consulting, working under the spectrum of information communication technology, telecommunications and semiconductor domains. aarti conceptualizes and implements a scalable business strategy and provides strategic leadership to the clients. her expertise lies in market estimation, competitive intelligence, pipeline analysis, customer assessment, etc.

    Leave a Comment

    Latest Comments

    John Doe
    john@example.com

    This is a great article! Really helped me understand the topic better.

    Posted on July 23, 2025, 10:15 AM
    Jane Smith
    jane@domain.com

    Thanks for sharing this. I’ve bookmarked it for later reference.

    Posted on July 22, 2025, 7:45 PM

    FAQs

    How much is the Industrial boiler Market?

    Industrial boiler Market Size USD 4,679.0 Million in 2023.

    What is the growth rate of the Industrial boiler Market?

    Growth rate of the Industrial boiler Market is 10.43% by 2030.

    Which region held the largest market share in the Industrial boiler Market?

    Asia-Pacific held the largest market share in the Industrial boiler Market.

    Who are the key players in the Industrial boiler Market?

    Alfa Laval, Wuxi ZOZEN Boilers Co., Ltd, Atlas Copco, Isaac Boilers Private Limited, General Electric Corporation.

    Which Boiler type had the largest market share in the Industrial boiler Market?

    Fire tube Boiler type had the largest market share in the Industrial boiler Market.

    Which fuel type had the largest market share in the Industrial boiler Market?

    Natural Gas had the largest market share in the Industrial boiler Market.

    1. --- "Table of Contents
    2. Executive Summary 17
      1. MARKET ATTRACTIVINESS ANALYSIS 19
      2. GLOBAL INDUSTRIAL BOILERS MARKET, BY BOILER TYPE 20
      3. GLOBAL INDUSTRIAL BOILERS MARKET, BY RATED CAPACITY 21
      4. GLOBAL INDUSTRIAL BOILERS MARKET, BY TEMPERATURE 22
      5. GLOBAL INDUSTRIAL BOILERS MARKET, BY END-USERS 23
      6. GLOBAL INDUSTRIAL BOILERS MARKET, BY REGIONS 24
    3. Market Introduction 25
      1. DEFINITION 25
      2. Scope of the Study 26
      3. RESEARCH OBJECTIVE 26
      4. MARKET STRUCTURE 26
    4. Research Methodology 27
      1. RESEARCH PROCESS 27
      2. PRIMARY RESEARCH 28
      3. SECONDARY RESEARCH 29
      4. MARKET SIZE ESTIMATION 30
      5. FORECAST MODEL 31
      6. LIST OF ASSUMPTIONS 32
    5. GLOBAL INDUSTRIAL BOILER MARKET, BY FUEL TYPE 33
      1. GLOBAL INDUSTRIAL BOILER MARKET SIZE, MARKET ESTIMATES & FORECAST BY FUEL TYPE, 2019-2030 33
        1. GLOBAL INDUSTRIAL BOILER MARKETSIZE: MARKET ESTIMATES & FORECAST BY FUEL TYPE, 2019-2030 33
        2. NATURAL GAS 33
        3. OIL 34
        4. COAL 34
        5. OTHERS 34
    6. GLOBAL INDUSTRIAL BOILER MARKET, BY BOILER TYPE 35
      1. GLOBAL INDUSTRIAL BOILER MARKET SIZE, MARKET ESTIMATES & FORECAST BY BOILER TYPE, 2019-2030 35
        1. GLOBAL INDUSTRIAL BOILER MARKETSIZE: MARKET ESTIMATES & FORECAST BY BOILER TYPE, 2019-2030 35
        2. FIRE-TUBE 35
        3. WATER-TUBE 36
    7. GLOBAL INDUSTRIAL BOILER MARKET, BY RATED CAPACITY 37
      1. GLOBAL INDUSTRIAL BOILER MARKET SIZE, MARKET ESTIMATES & FORECAST BY RATED CAPACITY, 2019-2030 37
        1. GLOBAL INDUSTRIAL BOILER MARKETSIZE: MARKET ESTIMATES & FORECAST BY RATED CAPACITY, 2019-2030 37
        2. 0.1 TO 0.35 MW 37
        3. 0.35 TO 0.7 MW 38
        4. 0.7 TO 1 MW 38
    8. GLOBAL INDUSTRIAL BOILER MARKET, BY TEMPERATURE 39
      1. GLOBAL INDUSTRIAL BOILER MARKET SIZE, MARKET ESTIMATES & FORECAST BY TEMPERATURE, 2019-2030 39
        1. GLOBAL INDUSTRIAL BOILER MARKETSIZE: MARKET ESTIMATES & FORECAST BY TEMPERATURE, 2019-2030 39
        2. LOW 39
        3. MEDIUM 40
        4. HIGH 40
    9. GLOBAL INDUSTRIAL BOILER MARKET, BY END-USER 41
      1. GLOBAL INDUSTRIAL BOILER MARKET SIZE, MARKET ESTIMATES & FORECAST BY END-USER, 2019-2030 42
        1. GLOBAL INDUSTRIAL BOILER MARKETSIZE: MARKET ESTIMATES & FORECAST BY END-USER, 2019-2030 42
        2. FOOD AND BEVERAGES 42
        3. CHEMICALS 42
        4. PLASTIC 43
        5. TEXTILE 43
        6. WOOD 43
        7. PAPER 43
        8. DISTRICT ENERGY 43
        9. OTHERS 43
    10. GLOBAL INDUSTRIAL BOILER MARKET, BY REGION 45
      1. NORTH AMERICA 46
        1. US 48
        2. CANADA 49
        3. MEXICO 51
      2. EUROPE 53
        1. GERMANY 55
        2. FRANCE 57
        3. ITALY 59
        4. UK 61
        5. SPAIN 63
        6. RUSSIA 65
        7. REST OF EUROPE 67
      3. ASIA-PACIFIC 69
        1. CHINA 71
        2. INDIA 73
        3. JAPAN 75
        4. SOUTH KOREA 77
        5. AUSTRALIA 79
        6. INDONESIA 81
        7. PHILIPPINES 83
        8. VIETNAM 85
        9. THAILAND 87
        10. MYANMAR 89
        11. SINGAPORE 91
        12. REST OF ASIA-PACIFIC 93
      4. SOUTH AMERICA 95
        1. BRAZIL 97
        2. ARGENTINA 99
        3. REST OF SOUTH AMERICA 101
      5. MIDDLE EAST & AFRICA 103
        1. SAUDI ARABIA 106
        2. UAE 108
        3. SOUTH AFRICA 110
        4. REST OF MIDDLE EAST & AFRICA 112
    11. COMPANY PROFILES 114
      1. ALFA LAVAL AB 114
        1. COMPANY OVERVIEW 114
        2. FINANCIAL OVERVIEW 115
        3. PRODUCTS OFFERED 115
        4. KEY DEVELOPMENTS 116
        5. SWOT ANALYSIS 116
        6. KEY STRATEGIES 117
      2. WUXI ZOZEN BOILERS CO., LTD. 118
        1. COMPANY OVERVIEW 118
        2. PRODUCTS OFFERED 118
        3. SWOT ANALYSIS 119
        4. KEY STRATEGIES 119
      3. ATLAS COPCO AB 120
        1. COMPANY OVERVIEW 120
        2. FINANCIAL OVERVIEW 121
        3. PRODUCTS OFFERED 121
        4. KEY DEVELOPMENTS 122
        5. SWOT ANALYSIS 122
        6. KEY STRATEGIES 122
      4. ISAAC BOILERS PVT. LTD 123
        1. COMPANY OVERVIEW 123
        2. FINANCIAL OVERVIEW 123
        3. PRODUCTS OFFERED 123
        4. KEY DEVELOPMENTS 123
        5. SWOT ANALYSIS 124
        6. KEY STRATEGIES 124
      5. HURST BOILER & WELDING CO, INC. 125
        1. COMPANY OVERVIEW 125
        2. FINANCIAL OVERVIEW 125
        3. PRODUCTS OFFERED 125
        4. KEY DEVELOPMENTS 126
        5. SWOT ANALYSIS 127
        6. KEY STRATEGIES 127
      6. URAL-POWER 128
        1. COMPANY OVERVIEW 128
        2. FINANCIAL OVERVIEW 128
        3. PRODUCTS OFFERED 128
        4. KEY DEVELOPMENTS 128
        5. SWOT ANALYSIS 129
        6. KEY STRATEGIES 129
      7. VIESSMANN 130
        1. COMPANY OVERVIEW 130
        2. FINANCIAL OVERVIEW 130
        3. PRODUCTS OFFERED 130
        4. KEY DEVELOPMENTS 130
        5. SWOT ANALYSIS 131
        6. KEY STRATEGIES 131
      8. PRECISION BOILERS 132
        1. COMPANY OVERVIEW 132
        2. FINANCIAL OVERVIEW 132
        3. PRODUCTS OFFERED 132
        4. KEY DEVELOPMENTS 133
        5. SWOT ANALYSIS 133
        6. KEY STRATEGIES 133
      9. HOVAL 134
        1. COMPANY OVERVIEW 134
        2. FINANCIAL OVERVIEW 134
        3. PRODUCTS OFFERED 134
        4. KEY DEVELOPMENTS 134
        5. SWOT ANALYSIS 135
        6. KEY STRATEGIES 135
      10. HYUNDAI HEAVY INDUSTRIES 136
        1. COMPANY OVERVIEW 136
        2. FINANCIAL OVERVIEW 136
        3. PRODUCTS OFFERED 137
        4. KEY DEVELOPMENTS 137
        5. SWOT ANALYSIS 138
        6. KEY STRATEGY 138
      11. IHI CORPORATION 139
        1. COMPANY OVERVIEW 139
        2. FINANCIAL OVERVIEW 140
        3. PRODUCTS OFFERED 140
        4. KEY DEVELOPMENTS 141
        5. SWOT ANALYSIS 141
        6. KEY STRATEGY 142
      12. THERMAX LTD. 143
        1. COMPANY OVERVIEW 143
        2. FINANCIAL OVERVIEW 144
        3. PRODUCTS OFFERED 144
        4. KEY DEVELOPMENTS 145
        5. SWOT ANALYSIS 145
        6. KEY STRATEGY 145
      13. ROBERT BOSCH GMBH 146
        1. COMPANY OVERVIEW 146
        2. FINANCIAL OVERVIEW 147
        3. PRODUCTS OFFERED 148
        4. KEY DEVELOPMENTS 148
        5. SWOT ANALYSIS 149
        6. KEY STRATEGY 149
      14. GENERAL ELECTRIC COMPANY 150
        1. COMPANY OVERVIEW 150
        2. FINANCIAL OVERVIEW 151
        3. PRODUCTS OFFERED 151
        4. KEY DEVELOPMENTS 152
        5. SWOT ANALYSIS 152
        6. KEY STRATEGY 153
      15. HARBIN ELECTRIC COMPANY LTD. 154
        1. COMPANY OVERVIEW 154
        2. FINANCIAL OVERVIEW 155
        3. PRODUCTS OFFERED 155
        4. KEY DEVELOPMENTS 156
        5. SWOT ANALYSIS 156
        6. KEY STRATEGY 157
      16. JOHN WOOD GROUP PLC 158
        1. COMPANY OVERVIEW 158
        2. FINANCIAL OVERVIEW 159
        3. PRODUCTS OFFERED 159
        4. KEY DEVELOPMENTS 160
        5. SWOT ANALYSIS 161
        6. KEY STRATEGY 161
    12. List of Tables and Figures
      1. LIST OF TABLES
      2. TABLE 1 MARKET SYNOPSIS 19
      3. TABLE 2 LIST OF ASSUMPTIONS 32
      4. TABLE 3 GLOBAL INDUSTRIAL BOILER MARKETESTIMATES & FORECAST, BY FUEL TYPE, 2019-2030 (USD MILLION) 33
      5. TABLE 4 GLOBAL INDUSTRIAL BOILER MARKETESTIMATES & FORECAST, BY BOILER TYPE, 2019-2030 (USD MILLION) 35
      6. TABLE 5 GLOBAL INDUSTRIAL BOILER MARKETESTIMATES & FORECAST, BY RATED CAPACITY, 2019-2030 (USD MILLION) 37
      7. TABLE 6 GLOBAL INDUSTRIAL BOILER MARKETESTIMATES & FORECAST, BY TEMPERATURE, 2019-2030 (USD MILLION) 39
      8. TABLE 7 GLOBAL INDUSTRIAL BOILER MARKETESTIMATES & FORECAST, BY END-USER, 2019-2030 (USD MILLION) 42
      9. TABLE 8 GLOBAL INDUSTRIAL BOILER MARKET SIZE, BY REGION, 2019-2030 (USD MILLION) 45
      10. TABLE 9 NORTH AMERICA: INDUSTRIAL BOILER MARKET SIZE, BY COUNTRY, 2019-2030 (USD MILLION) 46
      11. TABLE 10 NORTH AMERICA INDUSTRIAL BOILER MARKET ESTIMATES & FORECAST, BY FUEL TYPE, 2019-2030 (USD MILLION) 46
      12. TABLE 11 NORTH AMERICA INDUSTRIAL BOILER MARKET ESTIMATES & FORECAST, BY BOILER TYPE, 2019-2030 (USD MILLION) 46
      13. TABLE 12 NORTH AMERICA INDUSTRIAL BOILER MARKET ESTIMATES & FORECAST, BY RATED CAPACITY, 2019-2030 (USD MILLION) 47
      14. TABLE 13 NORTH AMERICA INDUSTRIAL BOILER MARKET ESTIMATES & FORECAST, BY TEMPERATURE, 2019-2030 (USD MILLION) 47
      15. TABLE 14 NORTH AMERICA INDUSTRIAL BOILER MARKET ESTIMATES & FORECAST, BY END-USER, 2019-2030 (USD MILLION) 47
      16. TABLE 15 US INDUSTRIAL BOILER MARKET ESTIMATES & FORECAST, BY FUEL TYPE, 2019-2030 (USD MILLION) 48
      17. TABLE 16 US INDUSTRIAL BOILER MARKET ESTIMATES & FORECAST, BY BOILER TYPE, 2019-2030 (USD MILLION) 48
      18. TABLE 17 US INDUSTRIAL BOILER MARKET ESTIMATES & FORECAST, BY RATED CAPACITY, 2019-2030 (USD MILLION) 48
      19. TABLE 18 US INDUSTRIAL BOILER MARKET ESTIMATES & FORECAST, BY TEMPERATURE, 2019-2030 (USD MILLION) 49
      20. TABLE 19 US INDUSTRIAL BOILER MARKET ESTIMATES & FORECAST, BY END-USER, 2019-2030 (USD MILLION) 49
      21. TABLE 20 CANADA INDUSTRIAL BOILER MARKET ESTIMATES & FORECAST, BY FUEL TYPE, 2019-2030 (USD MILLION) 49
      22. TABLE 21 CANADA INDUSTRIAL BOILER MARKET ESTIMATES & FORECAST, BY BOILER TYPE, 2019-2030 (USD MILLION) 50
      23. TABLE 22 CANADA INDUSTRIAL BOILER MARKET ESTIMATES & FORECAST, BY RATED CAPACITY, 2019-2030 (USD MILLION) 50
      24. TABLE 23 CANADA INDUSTRIAL BOILER MARKET ESTIMATES & FORECAST, BY TEMPERATURE, 2019-2030 (USD MILLION) 50
      25. TABLE 24 CANADA INDUSTRIAL BOILER MARKET ESTIMATES & FORECAST, BY END-USER, 2019-2030 (USD MILLION) 51
      26. TABLE 25 MEXICO INDUSTRIAL BOILER MARKET ESTIMATES & FORECAST, BY FUEL TYPE, 2019-2030 (USD MILLION) 51
      27. TABLE 26 MEXICO INDUSTRIAL BOILER MARKET ESTIMATES & FORECAST, BY BOILER TYPE, 2019-2030 (USD MILLION) 51
      28. TABLE 27 MEXICO INDUSTRIAL BOILER MARKET ESTIMATES & FORECAST, BY RATED CAPACITY, 2019-2030 (USD MILLION) 52
      29. TABLE 28 MEXICO INDUSTRIAL BOILER MARKET ESTIMATES & FORECAST, BY TEMPERATURE, 2019-2030 (USD MILLION) 52
      30. TABLE 29 MEXICO INDUSTRIAL BOILER MARKET ESTIMATES & FORECAST, BY END-USER, 2019-2030 (USD MILLION) 52
      31. TABLE 30 EUROPE: INDUSTRIAL BOILER MARKET SIZE, BY COUNTRY, 2019-2030 (USD MILLION) 53
      32. TABLE 31 EUROPE INDUSTRIAL BOILER MARKET ESTIMATES & FORECAST, BY FUEL TYPE, 2019-2030 (USD MILLION) 53
      33. TABLE 32 EUROPE INDUSTRIAL BOILER MARKET ESTIMATES & FORECAST, BY BOILER TYPE, 2019-2030 (USD MILLION) 53
      34. TABLE 33 EUROPE INDUSTRIAL BOILER MARKET ESTIMATES & FORECAST, BY RATED CAPACITY, 2019-2030 (USD MILLION) 54
      35. TABLE 34 EUROPE INDUSTRIAL BOILER MARKET ESTIMATES & FORECAST, BY TEMPERATURE, 2019-2030 (USD MILLION) 54
      36. TABLE 35 EUROPE INDUSTRIAL BOILER MARKET ESTIMATES & FORECAST, BY END-USER, 2019-2030 (USD MILLION) 54
      37. TABLE 36 GERMANY INDUSTRIAL BOILER MARKET ESTIMATES & FORECAST, BY FUEL TYPE, 2019-2030 (USD MILLION) 55
      38. TABLE 37 GERMANY INDUSTRIAL BOILER MARKET ESTIMATES & FORECAST, BY BOILER TYPE, 2019-2030 (USD MILLION) 55
      39. TABLE 38 GERMANY INDUSTRIAL BOILER MARKET ESTIMATES & FORECAST, BY RATED CAPACITY, 2019-2030 (USD MILLION) 55
      40. TABLE 39 GERMANY INDUSTRIAL BOILER MARKET ESTIMATES & FORECAST, BY TEMPERATURE, 2019-2030 (USD MILLION) 56
      41. TABLE 40 GERMANY INDUSTRIAL BOILER MARKET ESTIMATES & FORECAST, BY END-USER, 2019-2030 (USD MILLION) 56
      42. TABLE 41 FRANCE INDUSTRIAL BOILER MARKET ESTIMATES & FORECAST, BY FUEL TYPE, 2019-2030 (USD MILLION) 57
      43. TABLE 42 FRANCE INDUSTRIAL BOILER MARKET ESTIMATES & FORECAST, BY BOILER TYPE, 2019-2030 (USD MILLION) 57
      44. TABLE 43 FRANCE INDUSTRIAL BOILER MARKET ESTIMATES & FORECAST, BY RATED CAPACITY, 2019-2030 (USD MILLION) 57
      45. TABLE 44 FRANCE INDUSTRIAL BOILER MARKET ESTIMATES & FORECAST, BY TEMPERATURE, 2019-2030 (USD MILLION) 58
      46. TABLE 45 FRANCE INDUSTRIAL BOILER MARKET ESTIMATES & FORECAST, BY END-USER, 2019-2030 (USD MILLION) 58
      47. TABLE 46 ITALY INDUSTRIAL BOILER MARKET ESTIMATES & FORECAST, BY FUEL TYPE, 2019-2030 (USD MILLION) 59
      48. TABLE 47 ITALY INDUSTRIAL BOILER MARKET ESTIMATES & FORECAST, BY BOILER TYPE, 2019-2030 (USD MILLION) 59
      49. TABLE 48 ITALY INDUSTRIAL BOILER MARKET ESTIMATES & FORECAST, BY RATED CAPACITY, 2019-2030 (USD MILLION) 59
      50. TABLE 49 ITALY INDUSTRIAL BOILER MARKET ESTIMATES & FORECAST, BY TEMPERATURE, 2019-2030 (USD MILLION) 60
      51. TABLE 50 ITALY INDUSTRIAL BOILER MARKET ESTIMATES & FORECAST, BY END-USER, 2019-2030 (USD MILLION) 60
      52. TABLE 51 UK INDUSTRIAL BOILER MARKET ESTIMATES & FORECAST, BY FUEL TYPE, 2019-2030 (USD MILLION) 61
      53. TABLE 52 UK INDUSTRIAL BOILER MARKET ESTIMATES & FORECAST, BY BOILER TYPE, 2019-2030 (USD MILLION) 61
      54. TABLE 53 UK INDUSTRIAL BOILER MARKET ESTIMATES & FORECAST, BY RATED CAPACITY, 2019-2030 (USD MILLION) 61
      55. TABLE 54 UK INDUSTRIAL BOILER MARKET ESTIMATES & FORECAST, BY TEMPERATURE, 2019-2030 (USD MILLION) 62
      56. TABLE 55 UK INDUSTRIAL BOILER MARKET ESTIMATES & FORECAST, BY END-USER, 2019-2030 (USD MILLION) 62
      57. TABLE 56 SPAIN INDUSTRIAL BOILER MARKET ESTIMATES & FORECAST, BY FUEL TYPE, 2019-2030 (USD MILLION) 63
      58. TABLE 57 SPAIN INDUSTRIAL BOILER MARKET ESTIMATES & FORECAST, BY BOILER TYPE, 2019-2030 (USD MILLION) 63
      59. TABLE 58 SPAIN INDUSTRIAL BOILER MARKET ESTIMATES & FORECAST, BY RATED CAPACITY, 2019-2030 (USD MILLION) 63
      60. TABLE 59 SPAIN INDUSTRIAL BOILER MARKET ESTIMATES & FORECAST, BY TEMPERATURE, 2019-2030 (USD MILLION) 64
      61. TABLE 60 SPAIN INDUSTRIAL BOILER MARKET ESTIMATES & FORECAST, BY END-USER, 2019-2030 (USD MILLION) 64
      62. TABLE 61 RUSSIA INDUSTRIAL BOILER MARKET ESTIMATES & FORECAST, BY FUEL TYPE, 2019-2030 (USD MILLION) 65
      63. TABLE 62 RUSSIA INDUSTRIAL BOILER MARKET ESTIMATES & FORECAST, BY BOILER TYPE, 2019-2030 (USD MILLION) 65
      64. TABLE 63 RUSSIA INDUSTRIAL BOILER MARKET ESTIMATES & FORECAST, BY RATED CAPACITY, 2019-2030 (USD MILLION) 65
      65. TABLE 64 RUSSIA INDUSTRIAL BOILER MARKET ESTIMATES & FORECAST, BY TEMPERATURE, 2019-2030 (USD MILLION) 66
      66. TABLE 65 RUSSIA INDUSTRIAL BOILER MARKET ESTIMATES & FORECAST, BY END-USER, 2019-2030 (USD MILLION) 66
      67. TABLE 66 REST OF EUROPE INDUSTRIAL BOILER MARKET ESTIMATES & FORECAST, BY FUEL TYPE, 2019-2030 (USD MILLION) 67
      68. TABLE 67 REST OF EUROPE INDUSTRIAL BOILER MARKET ESTIMATES & FORECAST, BY BOILER TYPE, 2019-2030 (USD MILLION) 67
      69. TABLE 68 REST OF EUROPE INDUSTRIAL BOILER MARKET ESTIMATES & FORECAST, BY RATED CAPACITY, 2019-2030 (USD MILLION) 67
      70. TABLE 69 REST OF EUROPE INDUSTRIAL BOILER MARKET ESTIMATES & FORECAST, BY TEMPERATURE, 2019-2030 (USD MILLION) 68
      71. TABLE 70 REST OF EUROPE INDUSTRIAL BOILER MARKET ESTIMATES & FORECAST, BY END-USER, 2019-2030 (USD MILLION) 68
      72. TABLE 71 ASIA-PACIFIC: INDUSTRIAL BOILER MARKET SIZE, BY COUNTRY, 2019-2030 (USD MILLION) 69
      73. TABLE 72 REST OF EUROPE INDUSTRIAL BOILER MARKET ESTIMATES & FORECAST, BY FUEL TYPE, 2019-2030 (USD MILLION) 69
      74. TABLE 73 REST OF EUROPE INDUSTRIAL BOILER MARKET ESTIMATES & FORECAST, BY BOILER TYPE, 2019-2030 (USD MILLION) 70
      75. TABLE 74 REST OF EUROPE INDUSTRIAL BOILER MARKET ESTIMATES & FORECAST, BY RATED CAPACITY, 2019-2030 (USD MILLION) 70
      76. TABLE 75 REST OF EUROPE INDUSTRIAL BOILER MARKET ESTIMATES & FORECAST, BY TEMPERATURE, 2019-2030 (USD MILLION) 70
      77. TABLE 76 REST OF EUROPE INDUSTRIAL BOILER MARKET ESTIMATES & FORECAST, BY END-USER, 2019-2030 (USD MILLION) 71
      78. TABLE 77 CHINA INDUSTRIAL BOILER MARKET ESTIMATES & FORECAST, BY FUEL TYPE, 2019-2030 (USD MILLION) 71
      79. TABLE 78 CHINA INDUSTRIAL BOILER MARKET ESTIMATES & FORECAST, BY BOILER TYPE, 2019-2030 (USD MILLION) 71
      80. TABLE 79 CHINA INDUSTRIAL BOILER MARKET ESTIMATES & FORECAST, BY RATED CAPACITY, 2019-2030 (USD MILLION) 72
      81. TABLE 80 CHINA INDUSTRIAL BOILER MARKET ESTIMATES & FORECAST, BY TEMPERATURE, 2019-2030 (USD MILLION) 72
      82. TABLE 81 CHINA INDUSTRIAL BOILER MARKET ESTIMATES & FORECAST, BY END-USER, 2019-2030 (USD MILLION) 72
      83. TABLE 82 INDIA INDUSTRIAL BOILER MARKET ESTIMATES & FORECAST, BY FUEL TYPE, 2019-2030 (USD MILLION) 73
      84. TABLE 83 INDIA INDUSTRIAL BOILER MARKET ESTIMATES & FORECAST, BY BOILER TYPE, 2019-2030 (USD MILLION) 73
      85. TABLE 84 INDIA INDUSTRIAL BOILER MARKET ESTIMATES & FORECAST, BY RATED CAPACITY, 2019-2030 (USD MILLION) 73
      86. TABLE 85 INDIA INDUSTRIAL BOILER MARKET ESTIMATES & FORECAST, BY TEMPERATURE, 2019-2030 (USD MILLION) 74
      87. TABLE 86 INDIA INDUSTRIAL BOILER MARKET ESTIMATES & FORECAST, BY END-USER, 2019-2030 (USD MILLION) 74
      88. TABLE 87 JAPAN INDUSTRIAL BOILER MARKET ESTIMATES & FORECAST, BY FUEL TYPE, 2019-2030 (USD MILLION) 75
      89. TABLE 88 JAPAN INDUSTRIAL BOILER MARKET ESTIMATES & FORECAST, BY BOILER TYPE, 2019-2030 (USD MILLION) 75
      90. TABLE 89 JAPAN INDUSTRIAL BOILER MARKET ESTIMATES & FORECAST, BY RATED CAPACITY, 2019-2030 (USD MILLION) 75
      91. TABLE 90 JAPAN INDUSTRIAL BOILER MARKET ESTIMATES & FORECAST, BY TEMPERATURE, 2019-2030 (USD MILLION) 76
      92. TABLE 91 JAPAN INDUSTRIAL BOILER MARKET ESTIMATES & FORECAST, BY END-USER, 2019-2030 (USD MILLION) 76
      93. TABLE 92 SOUTH KOREA INDUSTRIAL BOILER MARKET ESTIMATES & FORECAST, BY FUEL TYPE, 2019-2030 (USD MILLION) 77
      94. TABLE 93 SOUTH KOREA INDUSTRIAL BOILER MARKET ESTIMATES & FORECAST, BY BOILER TYPE, 2019-2030 (USD MILLION) 77
      95. TABLE 94 SOUTH KOREA INDUSTRIAL BOILER MARKET ESTIMATES & FORECAST, BY RATED CAPACITY, 2019-2030 (USD MILLION) 77
      96. TABLE 95 SOUTH KOREA INDUSTRIAL BOILER MARKET ESTIMATES & FORECAST, BY TEMPERATURE, 2019-2030 (USD MILLION) 78
      97. TABLE 96 SOUTH KOREA INDUSTRIAL BOILER MARKET ESTIMATES & FORECAST, BY END-USER, 2019-2030 (USD MILLION) 78
      98. TABLE 97 AUSTRALIA INDUSTRIAL BOILER MARKET ESTIMATES & FORECAST, BY FUEL TYPE, 2019-2030 (USD MILLION) 79
      99. TABLE 98 AUSTRALIA INDUSTRIAL BOILER MARKET ESTIMATES & FORECAST, BY BOILER TYPE, 2019-2030 (USD MILLION) 79
      100. TABLE 99 AUSTRALIA INDUSTRIAL BOILER MARKET ESTIMATES & FORECAST, BY RATED CAPACITY, 2019-2030 (USD MILLION) 79
      101. TABLE 100 AUSTRALIA INDUSTRIAL BOILER MARKET ESTIMATES & FORECAST, BY TEMPERATURE, 2019-2030 (USD MILLION) 80
      102. TABLE 101 AUSTRALIA INDUSTRIAL BOILER MARKET ESTIMATES & FORECAST, BY END-USER, 2019-2030 (USD MILLION) 80
      103. TABLE 102 INDONESIA INDUSTRIAL BOILER MARKET ESTIMATES & FORECAST, BY FUEL TYPE, 2019-2030 (USD MILLION) 81
      104. TABLE 103 INDONESIA INDUSTRIAL BOILER MARKET ESTIMATES & FORECAST, BY BOILER TYPE, 2019-2030 (USD MILLION) 81
      105. TABLE 104 INDONESIA INDUSTRIAL BOILER MARKET ESTIMATES & FORECAST, BY RATED CAPACITY, 2019-2030 (USD MILLION) 81
      106. TABLE 105 INDONESIA INDUSTRIAL BOILER MARKET ESTIMATES & FORECAST, BY TEMPERATURE, 2019-2030 (USD MILLION) 82
      107. TABLE 106 INDONESIA INDUSTRIAL BOILER MARKET ESTIMATES & FORECAST, BY END-USER, 2019-2030 (USD MILLION) 82
      108. TABLE 107 PHILIPPINES INDUSTRIAL BOILER MARKET ESTIMATES & FORECAST, BY FUEL TYPE, 2019-2030 (USD MILLION) 83
      109. TABLE 108 PHILIPPINES INDUSTRIAL BOILER MARKET ESTIMATES & FORECAST, BY BOILER TYPE, 2019-2030 (USD MILLION) 83
      110. TABLE 109 PHILIPPINES INDUSTRIAL BOILER MARKET ESTIMATES & FORECAST, BY RATED CAPACITY, 2019-2030 (USD MILLION) 83
      111. TABLE 110 PHILIPPINES INDUSTRIAL BOILER MARKET ESTIMATES & FORECAST, BY TEMPERATURE, 2019-2030 (USD MILLION) 84
      112. TABLE 111 PHILIPPINES INDUSTRIAL BOILER MARKET ESTIMATES & FORECAST, BY END-USER, 2019-2030 (USD MILLION) 84
      113. TABLE 112 VIETNAM INDUSTRIAL BOILER MARKET ESTIMATES & FORECAST, BY FUEL TYPE, 2019-2030 (USD MILLION) 85
      114. TABLE 113 VIETNAM INDUSTRIAL BOILER MARKET ESTIMATES & FORECAST, BY BOILER TYPE, 2019-2030 (USD MILLION) 85
      115. TABLE 114 VIETNAM INDUSTRIAL BOILER MARKET ESTIMATES & FORECAST, BY RATED CAPACITY, 2019-2030 (USD MILLION) 85
      116. TABLE 115 VIETNAM INDUSTRIAL BOILER MARKET ESTIMATES & FORECAST, BY TEMPERATURE, 2019-2030 (USD MILLION) 86
      117. TABLE 116 VIETNAM INDUSTRIAL BOILER MARKET ESTIMATES & FORECAST, BY END-USER, 2019-2030 (USD MILLION) 86
      118. TABLE 117 THAILAND INDUSTRIAL BOILER MARKET ESTIMATES & FORECAST, BY FUEL TYPE, 2019-2030 (USD MILLION) 87
      119. TABLE 118 THAILAND INDUSTRIAL BOILER MARKET ESTIMATES & FORECAST, BY BOILER TYPE, 2019-2030 (USD MILLION) 87
      120. TABLE 119 THAILAND INDUSTRIAL BOILER MARKET ESTIMATES & FORECAST, BY RATED CAPACITY, 2019-2030 (USD MILLION) 87
      121. TABLE 120 THAILAND INDUSTRIAL BOILER MARKET ESTIMATES & FORECAST, BY TEMPERATURE, 2019-2030 (USD MILLION) 88
      122. TABLE 121 THAILAND INDUSTRIAL BOILER MARKET ESTIMATES & FORECAST, BY END-USER, 2019-2030 (USD MILLION) 88
      123. TABLE 122 MYANMAR INDUSTRIAL BOILER MARKET ESTIMATES & FORECAST, BY FUEL TYPE, 2019-2030 (USD MILLION) 89
      124. TABLE 123 MYANMAR INDUSTRIAL BOILER MARKET ESTIMATES & FORECAST, BY BOILER TYPE, 2019-2030 (USD MILLION) 89
      125. TABLE 124 MYANMAR INDUSTRIAL BOILER MARKET ESTIMATES & FORECAST, BY RATED CAPACITY, 2019-2030 (USD MILLION) 89
      126. TABLE 125 MYANMAR INDUSTRIAL BOILER MARKET ESTIMATES & FORECAST, BY TEMPERATURE, 2019-2030 (USD MILLION) 90
      127. TABLE 126 MYANMAR INDUSTRIAL BOILER MARKET ESTIMATES & FORECAST, BY END-USER, 2019-2030 (USD MILLION) 90
      128. TABLE 127 SINGAPORE INDUSTRIAL BOILER MARKET ESTIMATES & FORECAST, BY FUEL TYPE, 2019-2030 (USD MILLION) 91
      129. TABLE 128 SINGAPORE INDUSTRIAL BOILER MARKET ESTIMATES & FORECAST, BY BOILER TYPE, 2019-2030 (USD MILLION) 91
      130. TABLE 129 SINGAPORE INDUSTRIAL BOILER MARKET ESTIMATES & FORECAST, BY RATED CAPACITY, 2019-2030 (USD MILLION) 91
      131. TABLE 130 SINGAPORE INDUSTRIAL BOILER MARKET ESTIMATES & FORECAST, BY TEMPERATURE, 2019-2030 (USD MILLION) 92
      132. TABLE 131 SINGAPORE INDUSTRIAL BOILER MARKET ESTIMATES & FORECAST, BY END-USER, 2019-2030 (USD MILLION) 92
      133. TABLE 132 REST OF ASIA PACIFIC INDUSTRIAL BOILER MARKET ESTIMATES & FORECAST, BY FUEL TYPE, 2019-2030 (USD MILLION) 93
      134. TABLE 133 REST OF ASIA PACIFIC INDUSTRIAL BOILER MARKET ESTIMATES & FORECAST, BY BOILER TYPE, 2019-2030 (USD MILLION) 93
      135. TABLE 134 REST OF ASIA PACIFIC INDUSTRIAL BOILER MARKET ESTIMATES & FORECAST, BY RATED CAPACITY, 2019-2030 (USD MILLION) 93
      136. TABLE 135 REST OF ASIA PACIFIC INDUSTRIAL BOILER MARKET ESTIMATES & FORECAST, BY TEMPERATURE, 2019-2030 (USD MILLION) 94
      137. TABLE 136 REST OF ASIA PACIFIC INDUSTRIAL BOILER MARKET ESTIMATES & FORECAST, BY END-USER, 2019-2030 (USD MILLION) 94
      138. TABLE 137 SOUTH AMERICA: INDUSTRIAL BOILER MARKET SIZE, BY COUNTRY, 2019-2030 (USD MILLION) 95
      139. TABLE 138 SOUTH AMERICA INDUSTRIAL BOILER MARKET ESTIMATES & FORECAST, BY FUEL TYPE, 2019-2030 (USD MILLION) 95
      140. TABLE 139 SOUTH AMERICA INDUSTRIAL BOILER MARKET ESTIMATES & FORECAST, BY BOILER TYPE, 2019-2030 (USD MILLION) 95
      141. TABLE 140 SOUTH AMERICA INDUSTRIAL BOILER MARKET ESTIMATES & FORECAST, BY RATED CAPACITY, 2019-2030 (USD MILLION) 96
      142. TABLE 141 SOUTH AMERICA INDUSTRIAL BOILER MARKET ESTIMATES & FORECAST, BY TEMPERATURE, 2019-2030 (USD MILLION) 96
      143. TABLE 142 SOUTH AMERICA INDUSTRIAL BOILER MARKET ESTIMATES & FORECAST, BY END-USER, 2019-2030 (USD MILLION) 96
      144. TABLE 143 BRAZIL INDUSTRIAL BOILER MARKET ESTIMATES & FORECAST, BY FUEL TYPE, 2019-2030 (USD MILLION) 97
      145. TABLE 144 BRAZIL INDUSTRIAL BOILER MARKET ESTIMATES & FORECAST, BY BOILER TYPE, 2019-2030 (USD MILLION) 97
      146. TABLE 145 BRAZIL INDUSTRIAL BOILER MARKET ESTIMATES & FORECAST, BY RATED CAPACITY, 2019-2030 (USD MILLION) 97
      147. TABLE 146 BRAZIL INDUSTRIAL BOILER MARKET ESTIMATES & FORECAST, BY TEMPERATURE, 2019-2030 (USD MILLION) 98
      148. TABLE 147 BRAZIL INDUSTRIAL BOILER MARKET ESTIMATES & FORECAST, BY END-USER, 2019-2030 (USD MILLION) 98
      149. TABLE 148 ARGENTINA INDUSTRIAL BOILER MARKET ESTIMATES & FORECAST, BY FUEL TYPE, 2019-2030 (USD MILLION) 99
      150. TABLE 149 ARGENTINA INDUSTRIAL BOILER MARKET ESTIMATES & FORECAST, BY BOILER TYPE, 2019-2030 (USD MILLION) 99
      151. TABLE 150 ARGENTINA INDUSTRIAL BOILER MARKET ESTIMATES & FORECAST, BY RATED CAPACITY, 2019-2030 (USD MILLION) 99
      152. TABLE 151 ARGENTINA INDUSTRIAL BOILER MARKET ESTIMATES & FORECAST, BY TEMPERATURE, 2019-2030 (USD MILLION) 100
      153. TABLE 152 ARGENTINA INDUSTRIAL BOILER MARKET ESTIMATES & FORECAST, BY END-USER, 2019-2030 (USD MILLION) 100
      154. TABLE 153 REST OF SOUTH AMERICA INDUSTRIAL BOILER MARKET ESTIMATES & FORECAST, BY FUEL TYPE, 2019-2030 (USD MILLION) 101
      155. TABLE 154 REST OF SOUTH AMERICA INDUSTRIAL BOILER MARKET ESTIMATES & FORECAST, BY BOILER TYPE, 2019-2030 (USD MILLION) 101
      156. TABLE 155 REST OF SOUTH AMERICA INDUSTRIAL BOILER MARKET ESTIMATES & FORECAST, BY RATED CAPACITY, 2019-2030 (USD MILLION) 101
      157. TABLE 156 REST OF SOUTH AMERICA INDUSTRIAL BOILER MARKET ESTIMATES & FORECAST, BY TEMPERATURE, 2019-2030 (USD MILLION) 102
      158. TABLE 157 REST OF SOUTH AMERICA INDUSTRIAL BOILER MARKET ESTIMATES & FORECAST, BY END-USER, 2019-2030 (USD MILLION) 102
      159. TABLE 158 MIDDLE EAST & AFRICA: INDUSTRIAL BOILER MARKET SIZE, BY COUNTRY, 2019-2030 (USD MILLION) 103
      160. TABLE 159 MIDDLE EAST & AFRICA INDUSTRIAL BOILER MARKET ESTIMATES & FORECAST, BY FUEL TYPE, 2019-2030 (USD MILLION) 103
      161. TABLE 160 MIDDLE EAST & AFRICA INDUSTRIAL BOILER MARKET ESTIMATES & FORECAST, BY BOILER TYPE, 2019-2030 (USD MILLION) 103
      162. TABLE 161 MIDDLE EAST & AFRICA INDUSTRIAL BOILER MARKET ESTIMATES & FORECAST, BY RATED CAPACITY, 2019-2030 (USD MILLION) 105
      163. TABLE 162 MIDDLE EAST & AFRICA INDUSTRIAL BOILER MARKET ESTIMATES & FORECAST, BY TEMPERATURE, 2019-2030 (USD MILLION) 105
      164. TABLE 163 MIDDLE EAST & AFRICA INDUSTRIAL BOILER MARKET ESTIMATES & FORECAST, BY END-USER, 2019-2030 (USD MILLION) 105
      165. TABLE 164 SAUDI ARABIA INDUSTRIAL BOILER MARKET ESTIMATES & FORECAST, BY FUEL TYPE, 2019-2030 (USD MILLION) 106
      166. TABLE 165 SAUDI ARABIA INDUSTRIAL BOILER MARKET ESTIMATES & FORECAST, BY BOILER TYPE, 2019-2030 (USD MILLION) 106
      167. TABLE 166 SAUDI ARABIA INDUSTRIAL BOILER MARKET ESTIMATES & FORECAST, BY RATED CAPACITY, 2019-2030 (USD MILLION) 106
      168. TABLE 167 SAUDI ARABIA INDUSTRIAL BOILER MARKET ESTIMATES & FORECAST, BY TEMPERATURE, 2019-2030 (USD MILLION) 107
      169. TABLE 168 SAUDI ARABIA INDUSTRIAL BOILER MARKET ESTIMATES & FORECAST, BY END-USER, 2019-2030 (USD MILLION) 107
      170. TABLE 169 UAE INDUSTRIAL BOILER MARKET ESTIMATES & FORECAST, BY FUEL TYPE, 2019-2030 (USD MILLION) 108
      171. TABLE 170 UAE INDUSTRIAL BOILER MARKET ESTIMATES & FORECAST, BY BOILER TYPE, 2019-2030 (USD MILLION) 108
      172. TABLE 171 UAE INDUSTRIAL BOILER MARKET ESTIMATES & FORECAST, BY RATED CAPACITY, 2019-2030 (USD MILLION) 108
      173. TABLE 172 UAE INDUSTRIAL BOILER MARKET ESTIMATES & FORECAST, BY TEMPERATURE, 2019-2030 (USD MILLION) 109
      174. TABLE 173 UAE INDUSTRIAL BOILER MARKET ESTIMATES & FORECAST, BY END-USER, 2019-2030 (USD MILLION) 109
      175. TABLE 174 SOUTH AFRICA INDUSTRIAL BOILER MARKET ESTIMATES & FORECAST, BY FUEL TYPE, 2019-2030 (USD MILLION) 110
      176. TABLE 175 SOUTH AFRICA INDUSTRIAL BOILER MARKET ESTIMATES & FORECAST, BY BOILER TYPE, 2019-2030 (USD MILLION) 110
      177. TABLE 176 SOUTH AFRICA INDUSTRIAL BOILER MARKET ESTIMATES & FORECAST, BY RATED CAPACITY, 2019-2030 (USD MILLION) 110
      178. TABLE 177 SOUTH AFRICA INDUSTRIAL BOILER MARKET ESTIMATES & FORECAST, BY TEMPERATURE, 2019-2030 (USD MILLION) 111
      179. TABLE 178 SOUTH AFRICA INDUSTRIAL BOILER MARKET ESTIMATES & FORECAST, BY END-USER, 2019-2030 (USD MILLION) 111
      180. TABLE 179 REST OF MIDDLE EAST & AFRICA INDUSTRIAL BOILER MARKET ESTIMATES & FORECAST, BY FUEL TYPE, 2019-2030 (USD MILLION) 112
      181. TABLE 180 REST OF MIDDLE EAST & AFRICA INDUSTRIAL BOILER MARKET ESTIMATES & FORECAST, BY BOILER TYPE, 2019-2030 (USD MILLION) 112
      182. TABLE 181 REST OF MIDDLE EAST & AFRICA INDUSTRIAL BOILER MARKET ESTIMATES & FORECAST, BY RATED CAPACITY, 2019-2030 (USD MILLION) 112
      183. TABLE 182 REST OF MIDDLE EAST & AFRICA INDUSTRIAL BOILER MARKET ESTIMATES & FORECAST, BY TEMPERATURE, 2019-2030 (USD MILLION) 113
      184. TABLE 183 REST OF MIDDLE EAST & AFRICA INDUSTRIAL BOILER MARKET ESTIMATES & FORECAST, BY END-USER, 2019-2030 (USD MILLION) 113
      185. TABLE 184 ALFA LAVAL AB: PRODUCTS OFFERED 115
      186. TABLE 185 3M: KEY DEVELOPMENTS 116
      187. TABLE 186 WUXI ZOZEN BOILERS CO., LTD.: PRODUCTS OFFERED 118
      188. TABLE 187 ATLAS COPCO AB: PRODUCTS OFFERED 121
      189. TABLE 188 ATLAS COPCO AB: KEY DEVELOPMENTS 122
      190. TABLE 189 ISAAC BOILERS PVT. LTD: PRODUCT OFFERED 123
      191. TABLE 190 HURST BOILER & WELDING CO, INC.: PRODUCTS OFFERED 125
      192. TABLE 191 HURST BOILER & WELDING CO, INC.: KEY DEVELOPMENTS 126
      193. TABLE 192 URAL-POWER: PRODUCT OFFERED 128
      194. TABLE 193 VIESSMANN: PRODUCTS OFFERED 130
      195. TABLE 194 PRECISION BOILERS: PRODUCTS OFFERED 132
      196. TABLE 195 HOVAL: PRODUCTS OFFERED 134
      197. TABLE 196 HOVAL: KEY DEVELOPMENTS 134
      198. TABLE 197 HYUNDAI HEAVY INDUSTRIES: PRODUCTS OFFERED 137
      199. TABLE 198 HYUNDAI HEAVY INDUSTRIES: KEY DEVELOPMENTS 137
      200. TABLE 199 IHI CORPORATION: PRODUCTS OFFERED 140
      201. TABLE 200 IHI CORPORATION: KEY DEVELOPMENTS 141
      202. TABLE 201 THERMAX LTD.: PRODUCTS OFFERED 144
      203. TABLE 202 THERMAX LTD.: KEY DEVELOPMENTS 145
      204. TABLE 203 ROBERT BOSCH GMBH: PRODUCTS OFFERED 148
      205. TABLE 204 ROBERT BOSCH GMBH: KEY DEVELOPMENTS 148
      206. TABLE 205 GENERAL ELECTRIC COMPANY: PRODUCTS OFFERED 151
      207. TABLE 206 GENERAL ELECTRIC COMPANY: KEY DEVELOPMENTS 152
      208. TABLE 207 HARBIN ELECTRIC COMPANY LTD.: PRODUCTS OFFERED 155
      209. TABLE 208 HARBIN ELECTRIC COMPANY LTD.: KEY DEVELOPMENTS 156
      210. TABLE 209 JOHN WOOD GROUP PLC: PRODUCTS OFFERED 159
      211. TABLE 210 JOHN WOOD GROUP PLC: KEY DEVELOPMENTS 160 S LIST OF FIGURES
      212. FIGURE 1 GLOBAL INDUSTRIAL BOILERS MARKET ANALYSIS, BY FUEL TYPE 19
      213. FIGURE 2 GLOBAL INDUSTRIAL BOILERS MARKET ANALYSIS, BY BOILER TYPE 20
      214. FIGURE 3 GLOBAL INDUSTRIAL BOILERS MARKET ANALYSIS, BY RATED CAPACITY 21
      215. FIGURE 4 GLOBAL INDUSTRIAL BOILERS MARKET ANALYSIS, BY TEMPERATURE 22
      216. FIGURE 5 GLOBAL INDUSTRIAL BOILERS MARKET ANALYSIS, BY END-USERS 23
      217. FIGURE 6 GLOBAL INDUSTRIAL BOILERS MARKET ANALYSIS, BY REGIONS 24
      218. FIGURE 7 GLOBAL INDUSTRIAL BOILERS MARKET: STRUCTURE 26
      219. FIGURE 8 RESEARCH PROCESS 27
      220. FIGURE 9 TOP-DOWN & Bottom-up ApproachES 30
      221. FIGURE 10 GLOBAL INDUSTRIAL BOILER MARKET, BY FUEL TYPE, 2019 TO 2030 (USD MILLION) 33
      222. FIGURE 11 GLOBAL INDUSTRIAL BOILER MARKET, BY BOILER TYPE, 2019 TO 2030 (USD MILLION) 35
      223. FIGURE 12 GLOBAL INDUSTRIAL BOILER MARKET, BY RATED CAPACITY, 2019 TO 2030 (USD MILLION) 37
      224. FIGURE 13 GLOBAL INDUSTRIAL BOILER MARKET, BY TEMPERATURE, 2019 TO 2030 (USD MILLION) 39
      225. FIGURE 14 GLOBAL INDUSTRIAL BOILER MARKET, BY END-USER, 2019 TO 2030 (USD MILLION) 41
      226. FIGURE 15 GLOBAL INDUSTRIAL BOILER MARKET, BY REGION, 2021 TO 2030 (USD MILLION) 45
      227. FIGURE 16 ALFA LAVAL AB: FINANCIAL OVERVIEW SNAPSHOT 115
      228. FIGURE 17 ALFA LAVAL AB: SWOT ANALYSIS 116
      229. FIGURE 18 WUXI ZOZEN BOILERS CO., LTD.: SWOT ANALYSIS 119
      230. FIGURE 19 ATLAS COPCO AB: FINANCIAL OVERVIEW SNAPSHOT 121
      231. FIGURE 20 ATLAS COPCO AB: SWOT ANALYSIS 122
      232. FIGURE 21 ISAAC BOILERS PVT. LTD: SWOT ANALYSIS 124
      233. FIGURE 22 HURST BOILER & WELDING CO, INC.: SWOT ANALYSIS 127
      234. FIGURE 23 URAL-POWER: SWOT ANALYSIS 129
      235. FIGURE 24 VIESSMANN: SWOT ANALYSIS 131
      236. FIGURE 25 PRECISION BOILERS: SWOT ANALYSIS 133
      237. FIGURE 26 HOVAL: SWOT ANALYSIS 135
      238. FIGURE 27 HYUNDAI HEAVY INDUSTRIES: FINANCIAL OVERVIEW SNAPSHOT 136
      239. FIGURE 28 HYUNDAI HEAVY INDUSTRIES: SWOT ANALYSIS 138
      240. FIGURE 29 IHI CORPORATION: FINANCIAL OVERVIEW SNAPSHOT 140
      241. FIGURE 30 IHI CORPORATION: SWOT ANALYSIS 141
      242. FIGURE 31 THERMAX LTD.: FINANCIAL OVERVIEW SNAPSHOT 144
      243. FIGURE 32 THERMAX LTD.: SWOT ANALYSIS 145
      244. FIGURE 33 ROBERT BOSCH GMBH: FINANCIAL OVERVIEW SNAPSHOT 147
      245. FIGURE 34 ROBERT BOSCH GMBH: SWOT ANALYSIS 149
      246. FIGURE 35 GENERAL ELECTRIC COMPANY: FINANCIAL OVERVIEW SNAPSHOT 151
      247. FIGURE 36 GENERAL ELECTRIC COMPANY: SWOT ANALYSIS 152
      248. FIGURE 37 HARBIN ELECTRIC COMPANY LTD.: FINANCIAL OVERVIEW SNAPSHOT 155
      249. FIGURE 38 HARBIN ELECTRIC COMPANY LTD.: SWOT ANALYSIS 156
      250. FIGURE 39 JOHN WOOD GROUP PLC: FINANCIAL OVERVIEW SNAPSHOT 159
      251. FIGURE 40 JOHN WOOD GROUP PLC: SWOT ANALYSIS 161"

    Industrial Boilers Market Segmentation

    Industrial Boilers Fuel Type Outlook (USD Million, 2019-2030)

    • Natural Gas
    • Oil
    • Coal
    • Other

    Industrial Boilers Temperature (USD Million, 2019-2030)

    • low
    • Medium
    • High

    Industrial Boilers Rated Capacity (USD Million, 2019-2030)

    • 0.1 to 0.35 MW
    • 0.35 to 0.7 MW
    • 0.7 to 1 MW

    Industrial Boilers Boiler Type (USD Million, 2019-2030)

    • Fire-Tube
    • Water-Tube

    Industrial Boilers End-Use Industry Outlook

    • Food & Beverages
    • Chemicals
    • Metal
    • Plastic
    • Textile
    • Wood
    • Paper
    • District Energy
    • Other

    Industrial Boilers Regional Outlook (USD Million, 2019-2030)

    • North America Outlook (USD Million, 2019-2030)
      • North America Industrial Boilers Fuel Type Outlook (USD Million, 2019-2030)
        • Natural Gas
        • Oil
        • Coal
        • Other
      • North America Industrial Boilers Temperature Outlook (USD Million, 2019-2030)
        • Low
        • Medium
        • High
      • North America Industrial Boilers Boiler Type Outlook (USD Million, 2019-2030)
        • Fire-Tube
        • Water-Tube
      • North America Industrial Boilers Rated Capacity Outlook (USD Million, 2019-2030)
        • 1 to 0.35 MW
        • 35 to 0.7 MW
        • 7 to 1 MW
      • North America Industrial Boilers End-Use Industry Outlook (USD Million, 2019-2030)
        • Food & Beverages
        • Chemicals
        • Metal
        • Plastic
        • Textile
        • Wood
        • Paper
        • District Energy
        • Other
      • US Outlook (USD Million, 2019-2030)
      • US Industrial Boilers Fuel Type Outlook (USD Million, 2019-2030)
        • Natural Gas
        • Oil
        • Coal
        • Other
      • US Industrial Boilers Temperature Outlook (USD Million, 2019-2030)
        • Fire-Tube
        • Water-Tube
      • US Industrial Boilers Rated Capacity Outlook (USD Million, 2019-2030)
        • 1 to 0.35 MW
        • 35 to 0.7 MW
        • 7 to 1 MW
      • US Industrial Boilers Boiler Type Outlook (USD Million, 2019-2030)
        • Low
        • Medium
        • High
      • US Industrial Boilers End-Use Industry Outlook (USD Million, 2019-2030)
        • Food & Beverages
        • Chemicals
        • Metal
        • Plastic
        • Textile
        • Wood
        • Paper
        • District Energy
        • Other
      • Canada Outlook (USD Million, 2019-2030)
      • Canada Industrial Boilers Fuel Type Outlook (USD Million, 2019-2030)
        • Natural Gas
        • Oil
        • Coal
        • Other
      • Canada Industrial Boilers Temperature Outlook (USD Million, 2019-2030)
        • Low
        • Medium
        • High
      • Canada Industrial Boilers Temperature Outlook (USD Million, 2019-2030)
        • Fire-Tube
        • Water-Tube
      • Canada Industrial Boilers Rated Capacity Outlook (USD Million, 2019-2030)
        • 1 to 0.35 MW
        • 35 to 0.7 MW
        • 7 to 1 MW
      • Canada Industrial Boilers End-Use Industry Outlook (USD Million, 2019-2030)
        • Food & Beverages
        • Chemicals
        • Metal
        • Plastic
        • Textile
        • Wood
        • Paper
        • District Energy
        • Other
      • Europe Outlook (USD Million, 2019-2030)
        • Europe Industrial Boilers Fuel Type Outlook (USD Million, 2019-2030)
          • Natural Gas
          • Oil
          • Coal
          • Other
        • Europe Industrial Boilers Temperature Outlook (USD Million, 2019-2030)
          • Low
          • Medium
          • High
        • Europe Industrial Boilers Temperature Outlook (USD Million, 2019-2030)
          • Fire-Tube
          • Water-Tube
        • Europe Industrial Boilers Rated Capacity Outlook (USD Million, 2019-2030)
          • 1 to 0.35 MW
          • 35 to 0.7 MW
          • 7 to 1 MW
        • Europe Industrial Boilers End-Use Industry Outlook (USD Million, 2019-2030)
          • Food & Beverages
          • Chemicals
          • Metal
          • Plastic
          • Textile
          • Wood
          • Paper
          • District Energy
          • Other
        • Germany Outlook (USD Million, 2019-2030)
        • Germany Industrial Boilers Fuel Type Outlook (USD Million, 2019-2030)
          • Natural Gas
          • Oil
          • Coal
          • Other
        • Germany Industrial Boilers Temperature Outlook (USD Million, 2019-2030)
          • Low
          • Medium
          • High
        • Germany Industrial Boilers Temperature Outlook (USD Million, 2019-2030)
          • Fire-Tube
          • Water-Tube
        • Germany Industrial Boilers Rated Capacity Outlook (USD Million, 2019-2030)
          • 1 to 0.35 MW
          • 35 to 0.7 MW
          • 7 to 1 MW
        • Germany Industrial Boilers End-Use Industry Outlook (USD Million, 2019-2030)
          • Food & Beverages
          • Chemicals
          • Metal
          • Plastic
          • Textile
          • Wood
          • Paper
          • District Energy
          • Other
        • France Outlook (USD Million, 2019-2030)
        • France Industrial Boilers Fuel Type Outlook (USD Million, 2019-2030)
          • Natural Gas
          • Oil
          • Coal
          • Other
        • France Industrial Boilers Temperature Outlook (USD Million, 2019-2030)
          • Low
          • Medium
          • High
        • France Industrial Boilers Temperature Outlook (USD Million, 2019-2030)
          • Fire-Tube
          • Water-Tube
        • France Industrial Boilers Rated Capacity Outlook (USD Million, 2019-2030)
          • 1 to 0.35 MW
          • 35 to 0.7 MW
          • 7 to 1 MW
        • France Industrial Boilers End-Use Industry Outlook (USD Million, 2019-2030)
          • Food & Beverages
          • Chemicals
          • Metal
          • Plastic
          • Textile
          • Wood
          • Paper
          • District Energy
          • Other
        • Russia Outlook (USD Million, 2019-2030)
        • Russia Industrial Boilers Fuel Type Outlook (USD Million, 2019-2030)
          • Natural Gas
          • Oil
          • Coal
          • Other
        • Russia Industrial Boilers Temperature Outlook (USD Million, 2019-2030)
          • Low
          • Medium
          • High
        • Russia Industrial Boilers Temperature Outlook (USD Million, 2019-2030)
          • Fire-Tube
          • Water-Tube
        • Russia Industrial Boilers Rated Capacity Outlook (USD Million, 2019-2030)
          • 1 to 0.35 MW
          • 35 to 0.7 MW
          • 7 to 1 MW
        • Russia Industrial Boilers End-Use Industry Outlook (USD Million, 2019-2030)
          • Food & Beverages
          • Chemicals
          • Metal
          • Plastic
          • Textile
          • Wood
          • Paper
          • District Energy
          • Other
        • Italy Outlook (USD Million, 2019-2030)
        • Italy Industrial Boilers Fuel Type Outlook (USD Million, 2019-2030)
          • Natural Gas
          • Oil
          • Coal
          • Other
        • Italy Industrial Boilers Temperature Outlook (USD Million, 2019-2030)
          • Low
          • Medium
          • High
        • Italy Industrial Boilers Temperature Outlook (USD Million, 2019-2030)
          • Fire-Tube
          • Water-Tube
        • Italy Industrial Boilers Rated Capacity Outlook (USD Million, 2019-2030)
          • 1 to 0.35 MW
          • 35 to 0.7 MW
          • 7 to 1 MW
        • Italy Industrial Boilers End-Use Industry Outlook (USD Million, 2019-2030)
          • Food & Beverages
          • Chemicals
          • Metal
          • Plastic
          • Textile
          • Wood
          • Paper
          • District Energy
          • Other
        • Spain Outlook (USD Million, 2019-2030)
        • Spain Industrial Boilers Fuel Type Outlook (USD Million, 2019-2030)
          • Natural Gas
          • Oil
          • Coal
          • Other
        • Spain Industrial Boilers Temperature Outlook (USD Million, 2019-2030)
          • Low
          • Medium
          • High
        • Spain Industrial Boilers Temperature Outlook (USD Million, 2019-2030)
          • Fire-Tube
          • Water-Tube
        • Spain Industrial Boilers Rated Capacity Outlook (USD Million, 2019-2030)
          • 1 to 0.35 MW
          • 35 to 0.7 MW
          • 7 to 1 MW
        • Spain Industrial Boilers End-Use Industry Outlook (USD Million, 2019-2030)
          • Food & Beverages
          • Chemicals
          • Metal
          • Plastic
          • Textile
          • Wood
          • Paper
          • District Energy
          • Other
        • UK Outlook (USD Million, 2019-2030)
        • UK Industrial Boilers Fuel Type Outlook (USD Million, 2019-2030)
          • Natural Gas
          • Oil
          • Coal
          • Other
        • UK Industrial Boilers Temperature Outlook (USD Million, 2019-2030)
          • Low
          • Medium
          • High
        • UK Industrial Boilers Temperature Outlook (USD Million, 2019-2030)
          • Fire-Tube
          • Water-Tube
        • UK Industrial Boilers Rated Capacity Outlook (USD Million, 2019-2030)
          • 1 to 0.35 MW
          • 35 to 0.7 MW
          • 7 to 1 MW
        • UK Industrial Boilers End-Use Industry Outlook (USD Million, 2019-2030)
          • Food & Beverages
          • Chemicals
          • Metal
          • Plastic
          • Textile
          • Wood
          • Paper
          • District Energy
          • Other
        • Rest Of Europe Outlook (USD Million, 2019-2030)
        • Rest of Europe Industrial Boilers Fuel Type Outlook (USD Million, 2019-2030)
          • Natural Gas
          • Oil
          • Coal
          • Other
        • Rest of Europe Industrial Boilers Temperature Outlook (USD Million, 2019-2030)
          • Low
          • Medium
          • High
          •  
        • Rest of Europe Industrial Boilers Temperature Outlook (USD Million, 2019-2030)
          • Fire-Tube
          • Water-Tube
        • Rest of Europe Industrial Boilers Rated Capacity Outlook (USD Million, 2019-2030)
          • 1 to 0.35 MW
          • 35 to 0.7 MW
          • 7 to 1 MW
        • Rest of Europe Industrial Boilers End-Use Industry Outlook (USD Million, 2019-2030)
          • Food & Beverages
          • Chemicals
          • Metal
          • Plastic
          • Textile
          • Wood
          • Paper
          • District Energy
          • Other
        • Asia-Pacific Outlook (USD Million, 2019-2030)
          • Asia-Pacific Industrial Boilers Fuel Type Outlook (USD Million, 2019-2030)
            • Natural Gas
            • Oil
            • Coal
            • Other
          • Asia Pacific Industrial Boilers Temperature Outlook (USD Million, 2019-2030)
            • Low
            • Medium
            • High
          • Asia-Pacific Industrial Boilers Temperature Outlook (USD Million, 2019-2030)
            • Fire-Tube
            • Water-Tube
          • Asia-Pacific Industrial Boilers Rated Capacity Outlook (USD Million, 2019-2030)
            • 1 to 0.35 MW
            • 35 to 0.7 MW
            • 7 to 1 MW
          • Asia Pacific Industrial Boilers End-Use Industry Outlook (USD Million, 2019-2030)
            • Food & Beverages
            • Chemicals
            • Metal
            • Plastic
            • Textile
            • Wood
            • Paper
            • District Energy
            • Other
          • China Outlook (USD Million, 2019-2030)
          • China Industrial Boilers Fuel Type Outlook (USD Million, 2019-2030)
            • Natural Gas
            • Oil
            • Coal
            • Other
          • China Industrial Boilers Temperature Outlook (USD Million, 2019-2030)
            • Low
            • Medium
            • High
          • China Industrial Boilers Temperature Outlook (USD Million, 2019-2030)
            • Fire-Tube
            • Water-Tube
          • China Industrial Boilers Rated Capacity Outlook (USD Million, 2019-2030)
            • 1 to 0.35 MW
            • 35 to 0.7 MW
            • 7 to 1 MW
          • China Industrial Boilers End-Use Industry Outlook (USD Million, 2019-2030)
            • Food & Beverages
            • Chemicals
            • Metal
            • Plastic
            • Textile
            • Wood
            • Paper
            • District Energy
            • Other
          • Japan Outlook (USD Million, 2019-2030)
          • Japan Industrial Boilers Fuel Type Outlook (USD Million, 2019-2030)
            • Natural Gas
            • Oil
            • Coal
            • Others
          • Japan Industrial Boilers Temperature Outlook (USD Million, 2019-2030)
            • Low
            • Medium
            • High
          • Japan Industrial Boilers Temperature Outlook (USD Million, 2019-2030)
            • Fire-Tube
            • Water-Tube
          • Japan Industrial Boilers Rated Capacity Outlook (USD Million, 2019-2030)
            • 1 to 0.35 MW
            • 35 to 0.7 MW
            • 7 to 1 MW
          • Japan Industrial Boilers End-Use Industry Outlook (USD Million, 2019-2030)
            • Food & Beverages
            • Chemicals
            • Metal
            • Plastic
            • Textile
            • Wood
            • Paper
            • District Energy
            • Other
          • India Outlook (USD Million, 2019-2030)
          • India Industrial Boilers Fuel Type Outlook (USD Million, 2019-2030)
            • Natural Gas
            • Oil
            • Coal
            • Others
          • India Industrial Boilers Temperature Outlook (USD Million, 2019-2030)
            • Low
            • Medium
            • High
          • India Industrial Boilers Temperature Outlook (USD Million, 2019-2030)
            • Fire-Tube
            • Water-Tube
          • India Industrial Boilers Rated Capacity Outlook (USD Million, 2019-2030)
            • 1 to 0.35 MW
            • 35 to 0.7 MW
            • 7 to 1 MW
          • India Industrial Boilers End-Use Industry Outlook (USD Million, 2019-2030)
            • Food & Beverages
            • Chemicals
            • Metal
            • Plastic
            • Textile
            • Wood
            • Paper
            • District Energy
            • Other
          • Australia & New Zealand Outlook (USD Million, 2019-2030)
          • Australia & New Zealand Industrial Boilers Fuel Type Outlook (USD Million, 2019-2030)
            • Natural Gas
            • Oil
            • Coal
            • Other
          • Australia & New Zealand Industrial Boilers Temperature Outlook (USD Million, 2019-2030)
            • Low
            • Medium
            • High
          • Australia & New Zealand Industrial Boilers Temperature Outlook (USD Million, 2019-2030)
            • Fire-Tube
            • Water-Tube
          • Australia & New Zealand Industrial Boilers Rated Capacity Outlook (USD Million, 2019-2030)
            • 1 to 0.35 MW
            • 35 to 0.7 MW
            • 7 to 1 MW
          • Australia & New Zealand Industrial Boilers End-Use Industry Outlook (USD Million, 2019-2030)
            • Food & Beverages
            • Chemicals
            • Metal
            • Plastic
            • Textile
            • Wood
            • Paper
            • District Energy
            • Other
          • South Korea Outlook (USD Million, 2019-2030)
          • South Korea Industrial Boilers Fuel Type Outlook (USD Million, 2019-2030)
            • Natural Gas
            • Oil
            • Coal
            • Other
          • South Korea Industrial Boilers Temperature Outlook (USD Million, 2019-2030)
            • Low
            • Medium
            • High
          • South Korea Industrial Boilers Temperature Outlook (USD Million, 2019-2030)
            • Fire-Tube
            • Water-Tube
          • South Korea Industrial Boilers Rated Capacity Outlook (USD Million, 2019-2030)
            • 1 to 0.35 MW
            • 35 to 0.7 MW
            • 7 to 1 MW
          • South Korea Industrial Boilers End-Use Industry Outlook (USD Million, 2019-2030)
            • Food & Beverages
            • Chemicals
            • Metal
            • Plastic
            • Textile
            • Wood
            • Paper
            • District Energy
            • Other
          • Singapore Outlook (USD Million, 2019-2030)
          • Singapore Industrial Boilers Fuel Type Outlook (USD Million, 2019-2030)
            • Natural Gas
            • Oil
            • Coal
            • Others
          • Singapore Industrial Boilers Temperature Outlook (USD Million, 2019-2030)
            • Low
            • Medium
            • High
          • Singapore Industrial Boilers Temperature Outlook (USD Million, 2019-2030)
            • Fire-Tube
            • Water-Tube
          • Singapore Industrial Boilers Rated Capacity Outlook (USD Million, 2019-2030)
            • 1 to 0.35 MW
            • 35 to 0.7 MW
            • 7 to 1 MW
          • Singapore Industrial Boilers End-Use Industry Outlook (USD Million, 2019-2030)
            • Food & Beverages
            • Chemicals
            • Metal
            • Plastic
            • Textile
            • Wood
            • Paper
            • District Energy
            • Other
          • Malaysia Outlook (USD Million, 2019-2030)
          • Malaysia Industrial Boilers Fuel Type Outlook (USD Million, 2019-2030)
            • Natural Gas
            • Oil
            • Coal
            • Other
          • Malaysia Industrial Boilers Temperature Outlook (USD Million, 2019-2030)
            • Low
            • Medium
            • High
          • Malaysia Industrial Boilers Temperature Outlook (USD Million, 2019-2030)
            • Fire-Tube
            • Water-Tube
          • Malaysia Industrial Boilers Rated Capacity Outlook (USD Million, 2019-2030)
            • 1 to 0.35 MW
            • 35 to 0.7 MW
            • 7 to 1 MW
          • Malaysia Industrial Boilers End-Use Industry Outlook (USD Million, 2019-2030)
            • Food & Beverages
            • Chemicals
            • Metal
            • Plastic
            • Textile
            • Wood
            • Paper
            • District Energy
            • Other
          • Thailand Outlook (USD Million, 2019-2030)
          • Thailand Industrial Boilers Fuel Type Outlook (USD Million, 2019-2030)
            • Natural Gas
            • Oil
            • Coal
            • Other
          • Thailand Industrial Boilers Temperature Outlook (USD Million, 2019-2030)
            • Low
            • Medium
            • High
          • Thailand Industrial Boilers Temperature Outlook (USD Million, 2019-2030)
            • Fire-Tube
            • Water-Tube
          • Thailand Industrial Boilers Rated Capacity Outlook (USD Million, 2019-2030)
            • 1 to 0.35 MW
            • 35 to 0.7 MW
            • 7 to 1 MW
          • Thailand Industrial Boilers End-Use Industry Outlook (USD Million, 2019-2030)
            • Food & Beverages
            • Chemicals
            • Metal
            • Plastic
            • Textile
            • Wood
            • Paper
            • District Energy
            • Other
          • Phillipines Outlook (USD Million, 2019-2030)
          • Philippines Industrial Boilers Fuel Type Outlook (USD Million, 2019-2030)
            • Natural Gas
            • Oil
            • Coal
            • Other
          • Philippines Industrial Boilers Temperature Outlook (USD Million, 2019-2030)
            • Low
            • Medium
            • High
          • Philippines Industrial Boilers Temperature Outlook (USD Million, 2019-2030)
            • Fire-Tube
            • Water-Tube
          • Philippines Industrial Boilers Rated Capacity Outlook (USD Million, 2019-2030)
            • 1 to 0.35 MW
            • 35 to 0.7 MW
            • 7 to 1 MW
          • Philippines Industrial Boilers End-Use Industry Outlook (USD Million, 2019-2030)
            • Food & Beverages
            • Chemicals
            • Metal
            • Plastic
            • Textile
            • Wood
            • Paper
            • District Energy
            • Other
          • Indonesia Outlook (USD Million, 2019-2030)
          • Indonesia Industrial Boilers Fuel Type Outlook (USD Million, 2019-2030)
            • Natural Gas
            • Oil
            • Coal
            • Other
          • Indonesia Industrial Boilers Temperature Outlook (USD Million, 2019-2030)
            • Fire-Tube
            • Water-Tube
          • Indonesia Industrial Boilers Rated Capacity Outlook (USD Million, 2019-2030)
            • 1 to 0.35 MW
            • 35 to 0.7 MW
            • 7 to 1 MW
          • Indonesia Industrial Boilers Temperature Outlook (USD Million, 2019-2030)
            • Low
            • Medium
            • High
          • Indonesia Industrial Boilers End-Use Industry Outlook (USD Million, 2019-2030)
            • Food & Beverages
            • Chemicals
            • Metal
            • Plastic
            • Textile
            • Wood
            • Paper
            • District Energy
            • Other
          • Rest of Asia-Pacific Outlook (USD Million, 2019-2030)
          • Rest of Asia-Pacific Industrial Boilers Fuel Type Outlook (USD Million, 2019-2030)
            • Natural Gas
            • Oil
            • Coal
            • Other
          • Rest of Asia Pacific Industrial Boilers Temperature Outlook (USD Million, 2019-2030)
            • Low
            • Medium
            • High
          • Rest of Asia-Pacific Industrial Boilers Temperature Outlook (USD Million, 2019-2030)
            • Fire-Tube
            • Water-Tube
          • Rest of Asia-Pacific Industrial Boilers Rated Capacity Outlook (USD Million, 2019-2030)
            • 1 to 0.35 MW
            • 35 to 0.7 MW
            • 7 to 1 MW
          • Rest of Asia Pacific Industrial Boilers End-Use Industry Outlook (USD Million, 2019-2030)
            • Food & Beverages
            • Chemicals
            • Metal
            • Plastic
            • Textile
            • Wood
            • Paper
            • District Energy
            • Other
          • Latin America Outlook (USD Million, 2019-2030)
            • Latin America Industrial Boilers Fuel Type Outlook (USD Million, 2019-2030)
              • Natural Gas
              • Oil
              • Coal
              • Other
            • Latin America Industrial Boilers Temperature Outlook (USD Million, 2019-2030)
              • Low
              • Medium
              • High
            • Latin America Industrial Boilers Temperature Outlook (USD Million, 2019-2030)
              • Fire-Tube
              • Water-Tube
            • Latin America Industrial Boilers Rated Capacity Outlook (USD Million, 2019-2030)
              • 1 to 0.35 MW
              • 35 to 0.7 MW
              • 7 to 1 MW
            • Latin America Industrial Boilers End-Use Industry Outlook (USD Million, 2019-2030)
              • Food & Beverages
              • Chemicals
              • Metal
              • Plastic
              • Textile
              • Wood
              • Paper
              • District Energy
              • Other
            • UAE Outlook (USD Million, 2019-2030)
            • UAE Industrial Boilers Fuel Type Outlook (USD Million, 2019-2030)
              • Natural Gas
              • Oil
              • Coal
              • Other
            • UAE Industrial Boilers Temperature Outlook (USD Million, 2019-2030)
              • Low
              • Medium
              • High
            • UAE Industrial Boilers Temperature Outlook (USD Million, 2019-2030)
              • Fire-Tube
              • Water-Tube
            • UAE Industrial Boilers Rated Capacity Outlook (USD Million, 2019-2030)
              • 1 to 0.35 MW
              • 35 to 0.7 MW
              • 7 to 1 MW
            • UAE Industrial Boilers End-Use Industry Outlook (USD Million, 2019-2030)
              • Food & Beverages
              • Chemicals
              • Metal
              • Plastic
              • Textile
              • Wood
              • Paper
              • District Energy
              • Other
            • Saudi Arabia Outlook (USD Million, 2019-2030)
            • Saudi Arabia Industrial Boilers Fuel Type Outlook (USD Million, 2019-2030)
              • Natural Gas
              • Oil
              • Coal
              • Other
            • Saudi Arabia Industrial Boilers Temperature Outlook (USD Million, 2019-2030)
              • Low
              • Medium
              • High
            • Saudi Arabia Industrial Boilers Temperature Outlook (USD Million, 2019-2030)
              • Fire-Tube
              • Water-Tube
            • Saudi Arabia Industrial Boilers Rated Capacity Outlook (USD Million, 2019-2030)
              • 1 to 0.35 MW
              • 35 to 0.7 MW
              • 7 to 1 MW
            • Saudi Arabia Industrial Boilers End-Use Industry Outlook (USD Million, 2019-2030)
              • Food & Beverages
              • Chemicals
              • Metal
              • Plastic
              • Textile
              • Wood
              • Paper
              • District Energy
              • Other
            • South Africa Outlook (USD Million, 2019-2030)
            • South Africa Industrial Boilers Fuel Type Outlook (USD Million, 2019-2030)
              • Natural Gas
              • Oil
              • Coal
              • Other
            • South Africa Industrial Boilers Temperature Outlook (USD Million, 2019-2030)
              • Low
              • Medium
              • High
            • South Africa Industrial Boilers Temperature Outlook (USD Million, 2019-2030)
              • Fire-Tube
              • Water-Tube
            • South Africa Industrial Boilers Rated Capacity Outlook (USD Million, 2019-2030)
              • 1 to 0.35 MW
              • 35 to 0.7 MW
              • 7 to 1 MW
            • South Africa Industrial Boilers End-Use Industry Outlook (USD Million, 2019-2030)
              • Food & Beverages
              • Chemicals
              • Metal
              • Plastic
              • Textile
              • Wood
              • Paper
              • District Energy
              • Other
            • Rest of Latin America Outlook (USD Million, 2019-2030)
            • Rest of Latin America Industrial Boilers Fuel Type Outlook (USD Million, 2019-2030)
              • Natural Gas
              • Oil
              • Coal
              • Other
            • Rest of Latin America Industrial Boilers Temperature Outlook (USD Million, 2019-2030)
              • Low
              • Medium
              • High
            • Rest of Latin America Industrial Boilers Temperature Outlook (USD Million, 2019-2030)
              • Fire-Tube
              • Water-Tube
            • Rest of Latin America Industrial Boilers Rated Capacity Outlook (USD Million, 2019-2030)
              • 1 to 0.35 MW
              • 35 to 0.7 MW
              • 7 to 1 MW
            • Rest of Latin America Industrial Boilers End-Use Industry Outlook (USD Million, 2019-2030)
              • Food & Beverages
              • Chemicals
              • Metal
              • Plastic
              • Textile
              • Wood
              • Paper
              • District Energy
              • Other
            • Middle East & Africa Outlook (USD Million, 2019-2030)
              • Middle East & Africa Industrial Boilers Fuel Type Outlook (USD Million, 2019-2030)
                • Natural Gas
                • Oil
                • Coal
                • Other
              • Middle East & Africa Industrial Boilers Temperature Outlook (USD Million, 2019-2030)
                • Low
                • Medium
                • High
              • Middle East & Africa Industrial Boilers Temperature Outlook (USD Million, 2019-2030)
                • Fire-Tube
                • Water-Tube
              • Middle East & Africa Industrial Boilers Rated Capacity Outlook (USD Million, 2019-2030)
                • 1 to 0.35 MW
                • 35 to 0.7 MW
                • 7 to 1 MW
              • Middle East & Africa Industrial Boilers End-Use Industry Outlook (USD Million, 2019-2030)
                • Food & Beverages
                • Chemicals
                • Metal
                • Plastic
                • Textile
                • Wood
                • Paper
                • District Energy
                • Other
              • UAE Outlook (USD Million, 2019-2030)
              • UAE Industrial Boilers Fuel Type Outlook (USD Million, 2019-2030)
                • Natural Gas
                • Oil
                • Coal
                • Other
              • UAE Industrial Boilers Temperature Outlook (USD Million, 2019-2030)
                • Low
                • Medium
                • High
              • UAE Industrial Boilers Temperature Outlook (USD Million, 2019-2030)
                • Fire-Tube
                • Water-Tube
              • UAE Industrial Boilers Rated Capacity Outlook (USD Million, 2019-2030)
                • 1 to 0.35 MW
                • 35 to 0.7 MW
                • 7 to 1 MW
              • UAE Industrial Boilers End-Use Industry Outlook (USD Million, 2019-2030)
                • Food & Beverages
                • Chemicals
                • Metal
                • Plastic
                • Textile
                • Wood
                • Paper
                • District Energy
                • Other
              • South Africa Outlook (USD Million, 2019-2030)
              • South Africa Industrial Boilers Fuel Type Outlook (USD Million, 2019-2030)
                • Natural Gas
                • Oil
                • Coal
                • Other
              • South Africa Industrial Boilers Temperature Outlook (USD Million, 2019-2030)
                • Low
                • Medium
                • High
              • South Africa Industrial Boilers Temperature Outlook (USD Million, 2019-2030)
                • Fire-Tube
                • Water-Tube
              • South Africa Industrial Boilers Rated Capacity Outlook (USD Million, 2019-2030)
                • 1 to 0.35 MW
                • 35 to 0.7 MW
                • 7 to 1 MW
              • South Africa Industrial Boilers End-Use Industry Outlook (USD Million, 2019-2030)
                • Food & Beverages
                • Chemicals
                • Metal
                • Plastic
                • Textile
                • Wood
                • Paper
                • District Energy
                • Other
              • Saudi Arabia Outlook (USD Million, 2019-2030)
              • Saudi Arabia Industrial Boilers Fuel Type Outlook (USD Million, 2019-2030)
                • Natural Gas
                • Oil
                • Coal
                • Other
              • Saudi Arabia Industrial Boilers Temperature Outlook (USD Million, 2019-2030)
                • Low
                • Medium
                • High
              • Saudi Arabia Industrial Boilers Temperature Outlook (USD Million, 2019-2030)
                • Fire-Tube
                • Water-Tube
              • Saudi Arabia Industrial Boilers Rated Capacity Outlook (USD Million, 2019-2030)
                • 1 to 0.35 MW
                • 35 to 0.7 MW
                • 7 to 1 MW
              • Saudi Arabia Industrial Boilers End-Use Industry Outlook (USD Million, 2019-2030)
                • Food & Beverages
                • Chemicals
                • Metal
                • Plastic
                • Textile
                • Wood
                • Paper
                • District Energy
                • Other
              • Rest of Middle East & Africa Outlook (USD Million, 2019-2030)
              • Rest of Middle East & Africa Industrial Boilers Fuel Type Outlook (USD Million, 2019-2030)
                • Natural Gas
                • Oil
                • Coal
                • Other
              • Rest of Middle East & Africa Industrial Boilers Temperature Outlook (USD Million, 2019-2030)
                • Low
                • Medium
                • High
              • Rest of Middle East & Africa Industrial Boilers Temperature Outlook (USD Million, 2019-2030)
                • Fire-Tube
                • Water-Tube
              • Rest of Middle East & Africa Industrial Boilers Rated Capacity Outlook (USD Million, 2019-2030)
                • 1 to 0.35 MW
                • 35 to 0.7 MW
                • 7 to 1 MW
              • Rest of Middle East & Africa Industrial Boilers End-Use Industry Outlook (USD Million, 2019-2030)
                • Food & Beverages
                • Chemicals
                • Metal
                • Plastic
                • Textile
                • Wood
                • Paper
                • District Energy
                • Other
              • Latin America Outlook (USD Million, 2019-2030)
              • Latin America Industrial Boilers Fuel Type Outlook (USD Million, 2019-2030)
                • Natural Gas
                • Oil
                • Coal
                • Other
              • Latin America Industrial Boilers Temperature Outlook (USD Million, 2019-2030)
                • Low
                • Medium
                • High
              • Latin America Industrial Boilers Temperature Outlook (USD Million, 2019-2030)
                • Fire-Tube
                • Water-Tube
              • Latin America Industrial Boilers Rated Capacity Outlook (USD Million, 2019-2030)
                • 1 to 0.35 MW
                • 35 to 0.7 MW
                • 7 to 1 MW
              • Latin America Industrial Boilers End-Use Industry Outlook (USD Million, 2019-2030)
                • Food & Beverages
                • Chemicals
                • Metal
                • Plastic
                • Textile
                • Wood
                • Paper
                • District Energy
                • Other
              • Brazil Outlook (USD Million, 2019-2030)
              • Brazil Industrial Boilers Fuel Type Outlook (USD Million, 2019-2030)
                • Natural Gas
                • Oil
                • Coal
                • Other
              • Brazil Industrial Boilers Temperature Outlook (USD Million, 2019-2030)
                • Low
                • Medium
                • High
              • Brazil Industrial Boilers Temperature Outlook (USD Million, 2019-2030)
                • Fire-Tube
                • Water-Tube
              • Brazil Industrial Boilers Rated Capacity Outlook (USD Million, 2019-2030)
                • 1 to 0.35 MW
                • 35 to 0.7 MW
                • 7 to 1 MW
              • Brazil Industrial Boilers End-Use Industry Outlook (USD Million, 2019-2030)
                • Food & Beverages
                • Chemicals
                • Metal
                • Plastic
                • Textile
                • Wood
                • Paper
                • District Energy
                • Other
              • Argentina Outlook (USD Million, 2019-2030)
              • Argentina Industrial Boilers Fuel Type Outlook (USD Million, 2019-2030)
                • Natural Gas
                • Oil
                • Coal
                • Other
              • Argentina Industrial Boilers Temperature Outlook (USD Million, 2019-2030)
                • Low
                • Medium
                • High
              • Argentina Industrial Boilers Temperature Outlook (USD Million, 2019-2030)
                • Fire-Tube
                • Water-Tube
              • Argentina Industrial Boilers Rated Capacity Outlook (USD Million, 2019-2030)
                • 1 to 0.35 MW
                • 35 to 0.7 MW
                • 7 to 1 MW
              • Argentina Industrial Boilers End-Use Industry Outlook (USD Million, 2019-2030)
                • Food & Beverages
                • Chemicals
                • Metal
                • Plastic
                • Textile
                • Wood
                • Paper
                • District Energy
                • Other
              • Rest of Latin America Outlook (USD Million, 2019-2030)
              • Rest of Latin America Industrial Boilers Fuel Type Outlook (USD Million, 2019-2030)
                • Natural Gas
                • Oil
                • Coal
                • Other
              • Rest of Latin America Industrial Boilers Temperature Outlook (USD Million, 2019-2030)
                • Low
                • Medium
                • High
              • Rest of Latin America Industrial Boilers Temperature Outlook (USD Million, 2019-2030)
                • Fire-Tube
                • Water-Tube
              • Rest of Latin America Industrial Boilers Rated Capacity Outlook (USD Million, 2019-2030)
                • 1 to 0.35 MW
                • 35 to 0.7 MW
                • 7 to 1 MW
              • Rest of Latin America Industrial Boilers End-Use Industry Outlook (USD Million, 2019-2030)
                • Food & Beverages
                • Chemicals
                • Metal
                • Plastic
                • Textile
                • Wood
                • Paper
                • District Energy
                • Other
    Infographic

    Free Sample Request

    Kindly complete the form below to receive a free sample of this Report

    Get Free Sample

    Customer Strories

    “I am very pleased with how market segments have been defined in a relevant way for my purposes (such as "Portable Freezers & refrigerators" and "last-mile"). In general the report is well structured. Thanks very much for your efforts.”

    Victoria Milne

    Founder
    Case Study
    Chemicals and Materials