India Life Sciences Market Segmentation
Life Sciences By Technology (USD Million, 2025-2035)
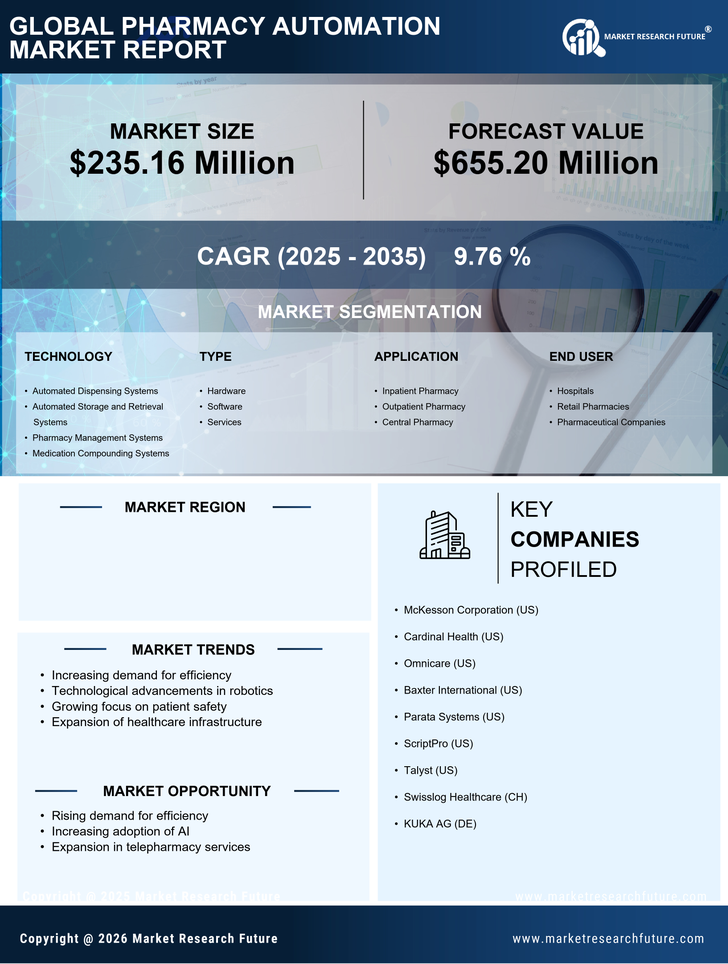
- Automated Dispensing Systems
- Automated Storage and Retrieval Systems
- Pharmacy Management Systems
- Medication Compounding Systems
Life Sciences By Type (USD Million, 2025-2035)
- Hardware
- Software
- Services
Life Sciences By Application (USD Million, 2025-2035)
- Inpatient Pharmacy
- Outpatient Pharmacy
- Central Pharmacy
Life Sciences By End User (USD Million, 2025-2035)
- Hospitals
- Retail Pharmacies
- India Pharmacy Automation Market Companies