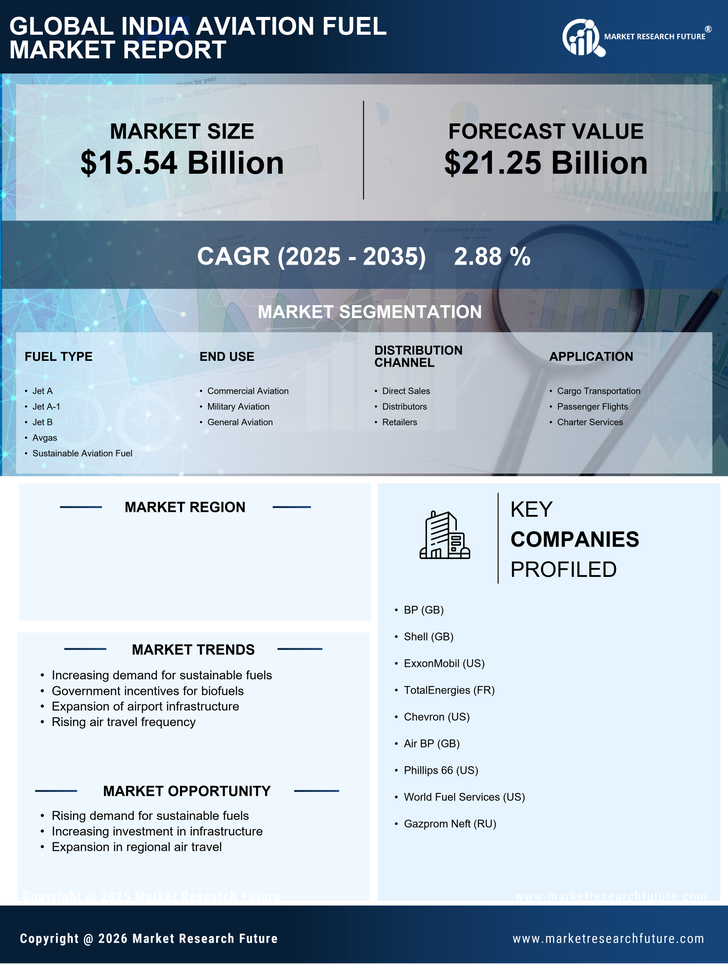
Request Free Sample ×

Kindly complete the form below to receive a free sample of this Report

* Please use a valid business email

Leading companies partner with us for data-driven Insights

clients tt-cursor
Hero Background

India Aviation Fuel Market

ID: MRFR/AD/56343-HCR
128 Pages
Abbas Raut
Last Updated: February 06, 2026

India Aviation Fuel Market Size, Share, Industry Trend & Analysis Research Report: By Fuel Type (Jet A, Jet A-1, Jet B, Avgas, Sustainable Aviation Fuel), By End Use (Commercial Aviation, Military Aviation, General Aviation), By Distribution Channel (Direct Sales, Distributors, Retailers) andBy Application (Cargo Transportation, Passenger Flights, Charter Services)- Forecast to 2035

Share:
Download PDF ×

We do not share your information with anyone. However, we may send you emails based on your report interest from time to time. You may contact us at any time to opt-out.

India Aviation Fuel Market Infographic
Purchase Options
  1. 1 SECTION I: EXECUTIVE SUMMARY AND KEY HIGHLIGHTS
    1. 1.1 EXECUTIVE SUMMARY
      1. 1.1.1 Market Overview
      2. 1.1.2 Key Findings
      3. 1.1.3 Market Segmentation
      4. 1.1.4 Competitive Landscape
      5. 1.1.5 Challenges and Opportunities
      6. 1.1.6 Future Outlook
  2. 2 SECTION II: SCOPING, METHODOLOGY AND MARKET STRUCTURE
    1. 2.1 MARKET INTRODUCTION
      1. 2.1.1 Definition
      2. 2.1.2 Scope of the study
        1. 2.1.2.1 Research Objective
        2. 2.1.2.2 Assumption
        3. 2.1.2.3 Limitations
    2. 2.2 RESEARCH METHODOLOGY
      1. 2.2.1 Overview
      2. 2.2.2 Data Mining
      3. 2.2.3 Secondary Research
      4. 2.2.4 Primary Research
        1. 2.2.4.1 Primary Interviews and Information Gathering Process
        2. 2.2.4.2 Breakdown of Primary Respondents
      5. 2.2.5 Forecasting Model
      6. 2.2.6 Market Size Estimation
        1. 2.2.6.1 Bottom-Up Approach
        2. 2.2.6.2 Top-Down Approach
      7. 2.2.7 Data Triangulation
      8. 2.2.8 Validation
  3. 3 SECTION III: QUALITATIVE ANALYSIS
    1. 3.1 MARKET DYNAMICS
      1. 3.1.1 Overview
      2. 3.1.2 Drivers
      3. 3.1.3 Restraints
      4. 3.1.4 Opportunities
    2. 3.2 MARKET FACTOR ANALYSIS
      1. 3.2.1 Value chain Analysis
      2. 3.2.2 Porter's Five Forces Analysis
        1. 3.2.2.1 Bargaining Power of Suppliers
        2. 3.2.2.2 Bargaining Power of Buyers
        3. 3.2.2.3 Threat of New Entrants
        4. 3.2.2.4 Threat of Substitutes
        5. 3.2.2.5 Intensity of Rivalry
      3. 3.2.3 COVID-19 Impact Analysis
        1. 3.2.3.1 Market Impact Analysis
        2. 3.2.3.2 Regional Impact
        3. 3.2.3.3 Opportunity and Threat Analysis
  4. 4 SECTION IV: QUANTITATIVE ANALYSIS
    1. 4.1 Food, Beverages & Nutrition, BY Fuel Type (USD Billion)
      1. 4.1.1 Jet A
      2. 4.1.2 Jet A-1
      3. 4.1.3 Jet B
      4. 4.1.4 Avgas
      5. 4.1.5 Sustainable Aviation Fuel
    2. 4.2 Food, Beverages & Nutrition, BY End Use (USD Billion)
      1. 4.2.1 Commercial Aviation
      2. 4.2.2 Military Aviation
      3. 4.2.3 General Aviation
    3. 4.3 Food, Beverages & Nutrition, BY Distribution Channel (USD Billion)
      1. 4.3.1 Direct Sales
      2. 4.3.2 Distributors
      3. 4.3.3 Retailers
    4. 4.4 Food, Beverages & Nutrition, BY Application (USD Billion)
      1. 4.4.1 Cargo Transportation
      2. 4.4.2 Passenger Flights
      3. 4.4.3 Charter Services
  5. 5 SECTION V: COMPETITIVE ANALYSIS
    1. 5.1 Competitive Landscape
      1. 5.1.1 Overview
      2. 5.1.2 Competitive Analysis
      3. 5.1.3 Market share Analysis
      4. 5.1.4 Major Growth Strategy in the Food, Beverages & Nutrition
      5. 5.1.5 Competitive Benchmarking
      6. 5.1.6 Leading Players in Terms of Number of Developments in the Food, Beverages & Nutrition
      7. 5.1.7 Key developments and growth strategies
        1. 5.1.7.1 New Product Launch/Service Deployment
        2. 5.1.7.2 Merger & Acquisitions
        3. 5.1.7.3 Joint Ventures
      8. 5.1.8 Major Players Financial Matrix
        1. 5.1.8.1 Sales and Operating Income
        2. 5.1.8.2 Major Players R&D Expenditure. 2023
    2. 5.2 Company Profiles
      1. 5.2.1 BP (GB)
        1. 5.2.1.1 Financial Overview
        2. 5.2.1.2 Products Offered
        3. 5.2.1.3 Key Developments
        4. 5.2.1.4 SWOT Analysis
        5. 5.2.1.5 Key Strategies
      2. 5.2.2 Shell (GB)
        1. 5.2.2.1 Financial Overview
        2. 5.2.2.2 Products Offered
        3. 5.2.2.3 Key Developments
        4. 5.2.2.4 SWOT Analysis
        5. 5.2.2.5 Key Strategies
      3. 5.2.3 ExxonMobil (US)
        1. 5.2.3.1 Financial Overview
        2. 5.2.3.2 Products Offered
        3. 5.2.3.3 Key Developments
        4. 5.2.3.4 SWOT Analysis
        5. 5.2.3.5 Key Strategies
      4. 5.2.4 TotalEnergies (FR)
        1. 5.2.4.1 Financial Overview
        2. 5.2.4.2 Products Offered
        3. 5.2.4.3 Key Developments
        4. 5.2.4.4 SWOT Analysis
        5. 5.2.4.5 Key Strategies
      5. 5.2.5 Chevron (US)
        1. 5.2.5.1 Financial Overview
        2. 5.2.5.2 Products Offered
        3. 5.2.5.3 Key Developments
        4. 5.2.5.4 SWOT Analysis
        5. 5.2.5.5 Key Strategies
      6. 5.2.6 Air BP (GB)
        1. 5.2.6.1 Financial Overview
        2. 5.2.6.2 Products Offered
        3. 5.2.6.3 Key Developments
        4. 5.2.6.4 SWOT Analysis
        5. 5.2.6.5 Key Strategies
      7. 5.2.7 Phillips 66 (US)
        1. 5.2.7.1 Financial Overview
        2. 5.2.7.2 Products Offered
        3. 5.2.7.3 Key Developments
        4. 5.2.7.4 SWOT Analysis
        5. 5.2.7.5 Key Strategies
      8. 5.2.8 World Fuel Services (US)
        1. 5.2.8.1 Financial Overview
        2. 5.2.8.2 Products Offered
        3. 5.2.8.3 Key Developments
        4. 5.2.8.4 SWOT Analysis
        5. 5.2.8.5 Key Strategies
      9. 5.2.9 Gazprom Neft (RU)
        1. 5.2.9.1 Financial Overview
        2. 5.2.9.2 Products Offered
        3. 5.2.9.3 Key Developments
        4. 5.2.9.4 SWOT Analysis
        5. 5.2.9.5 Key Strategies
    3. 5.3 Appendix
      1. 5.3.1 References
      2. 5.3.2 Related Reports
  6. 6 LIST OF FIGURES
    1. 6.1 MARKET SYNOPSIS
    2. 6.2 INDIA MARKET ANALYSIS BY FUEL TYPE
    3. 6.3 INDIA MARKET ANALYSIS BY END USE
    4. 6.4 INDIA MARKET ANALYSIS BY DISTRIBUTION CHANNEL
    5. 6.5 INDIA MARKET ANALYSIS BY APPLICATION
    6. 6.6 KEY BUYING CRITERIA OF FOOD, BEVERAGES & NUTRITION
    7. 6.7 RESEARCH PROCESS OF MRFR
    8. 6.8 DRO ANALYSIS OF FOOD, BEVERAGES & NUTRITION
    9. 6.9 DRIVERS IMPACT ANALYSIS: FOOD, BEVERAGES & NUTRITION
    10. 6.10 RESTRAINTS IMPACT ANALYSIS: FOOD, BEVERAGES & NUTRITION
    11. 6.11 SUPPLY / VALUE CHAIN: FOOD, BEVERAGES & NUTRITION
    12. 6.12 FOOD, BEVERAGES & NUTRITION, BY FUEL TYPE, 2024 (% SHARE)
    13. 6.13 FOOD, BEVERAGES & NUTRITION, BY FUEL TYPE, 2024 TO 2035 (USD Billion)
    14. 6.14 FOOD, BEVERAGES & NUTRITION, BY END USE, 2024 (% SHARE)
    15. 6.15 FOOD, BEVERAGES & NUTRITION, BY END USE, 2024 TO 2035 (USD Billion)
    16. 6.16 FOOD, BEVERAGES & NUTRITION, BY DISTRIBUTION CHANNEL, 2024 (% SHARE)
    17. 6.17 FOOD, BEVERAGES & NUTRITION, BY DISTRIBUTION CHANNEL, 2024 TO 2035 (USD Billion)
    18. 6.18 FOOD, BEVERAGES & NUTRITION, BY APPLICATION, 2024 (% SHARE)
    19. 6.19 FOOD, BEVERAGES & NUTRITION, BY APPLICATION, 2024 TO 2035 (USD Billion)
    20. 6.20 BENCHMARKING OF MAJOR COMPETITORS
  7. 7 LIST OF TABLES
    1. 7.1 LIST OF ASSUMPTIONS
  8. 7.1.1
    1. 7.2 India MARKET SIZE ESTIMATES; FORECAST
      1. 7.2.1 BY FUEL TYPE, 2025-2035 (USD Billion)
      2. 7.2.2 BY END USE, 2025-2035 (USD Billion)
      3. 7.2.3 BY DISTRIBUTION CHANNEL, 2025-2035 (USD Billion)
      4. 7.2.4 BY APPLICATION, 2025-2035 (USD Billion)
    2. 7.3 PRODUCT LAUNCH/PRODUCT DEVELOPMENT/APPROVAL
  9. 7.3.1
    1. 7.4 ACQUISITION/PARTNERSHIP
  10. 7.4.1

India Food, Beverages & Nutrition Market Segmentation

Food, Beverages & Nutrition By Fuel Type (USD Billion, 2025-2035)

  • Jet A
  • Jet A-1
  • Jet B
  • Avgas
  • Sustainable Aviation Fuel

Food, Beverages & Nutrition By End Use (USD Billion, 2025-2035)

  • Commercial Aviation
  • Military Aviation
  • General Aviation

Food, Beverages & Nutrition By Distribution Channel (USD Billion, 2025-2035)

  • Direct Sales
  • Distributors
  • Retailers

Food, Beverages & Nutrition By Application (USD Billion, 2025-2035)

  • Cargo Transportation
  • Passenger Flights
  • Charter Services

Compare Licence

×
Features License Type
Single User Multiuser License Enterprise User
Price $4,950 $5,950 $7,250
Maximum User Access Limit 1 User Upto 10 Users Unrestricted Access Throughout the Organization
Free Customization
Direct Access to Analyst
Deliverable Format
Platform Access
Discount on Next Purchase 10% 15% 15%
Printable Versions