India Life Sciences Market Segmentation
Life Sciences By Type (USD Million, 2025-2035)
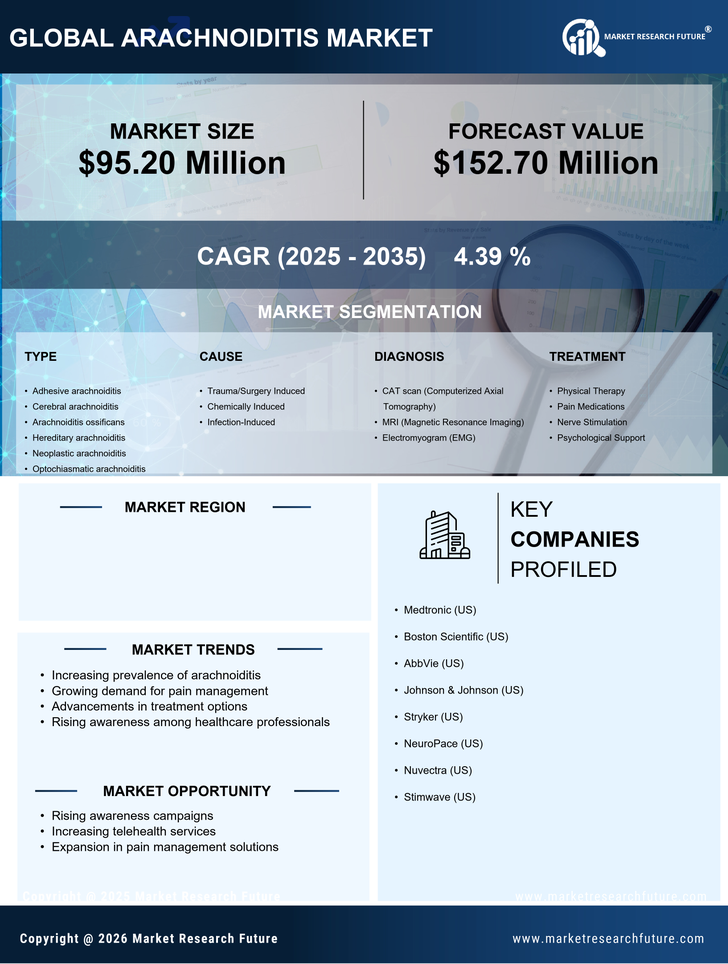
- Adhesive arachnoiditis
- Cerebral arachnoiditis
- Arachnoiditis ossificans
- Hereditary arachnoiditis
- Neoplastic arachnoiditis
- Optochiasmatic arachnoiditis
Life Sciences By Cause (USD Million, 2025-2035)
- Trauma/Surgery Induced
- Chemically Induced
- Infection-Induced
Life Sciences By Diagnosis (USD Million, 2025-2035)
- CAT scan (Computerized Axial Tomography)
- MRI (Magnetic Resonance Imaging)
- Electromyogram (EMG)
Life Sciences By Treatment (USD Million, 2025-2035)
- Physical Therapy
- Pain Medications
- Nerve Stimulation
- Psychological Support
Life Sciences By End User (USD Million, 2025-2035)
- Hospital and Clinics
- Pharmacies
- Diagnostic Centers
- Others