• Cat-intel
  • MedIntelliX
  • Resources
  • About Us
  • English
    Chinese
    French
    Japanese
    Korean
    German
    Spanish

    Immersive Technology in Entertainment Market Size

    ID: MRFR/ICT/10715-HCR
    128 Pages
    Aarti Dhapte
    September 2025

    Immersive Technology in Entertainment Industry Market Research Report: Information By Component (Hardware (Head-Mounted Display, Gesture Tracking Devices, Projectors & Display Walls, Software/Platform, Services (Professional and Managed)), Technology (Mixed Reality (MR), Virtual Reality (VR), Augmented Reality (AR) and 360 Film), Application (Training & Learning, Emergency Services, Pro...

    Share:
    Download PDF ×

    We do not share your information with anyone. However, we may send you emails based on your report interest from time to time. You may contact us at any time to opt-out.

    Immersive Technology in Entertainment Market Infographic
    $ 4,950.0
    $ 5,950.0
    $ 7,250.0

    Immersive Technology In Entertainment Size

    Immersive Technology in Entertainment Market Growth Projections and Opportunities

    Immersive entertainment technology dynamics have changed greatly, and this has introduced a new kind of interactive and captivating experience for the audience. The entertainment landscape has transformed due to immersive technologies such as virtual reality (VR) and augmented reality (AR), which are applied in storytelling and audience engagement across different platforms. One of the main drivers behind the adoption of immersive technologies in entertainment is to make it more engaging, realistic, and memorable for consumers. VR games, virtual theme park experiences, and immersive stories enable users to enter virtual worlds with a presence unlike any traditional media can create. Immersive technology used by the gaming industry spearheaded its growth with a popularity surge of VR gaming, which is followed by other games being considered. Additionally, immersive technology has recently found its way into live events and entertainment, where it offers unique experiences that captivate people's attention. On the one hand, there are VR concerts, live sports events, and theater performances available from home in AR application format. Integration of immersion technologies into filmmaking and storytelling also affects market dynamics and their growth. Filmmakers using VR or AR are able to come up with narratives that are no longer confined within the screen frame; instead, they can include viewers in storylines while blurring boundaries between fact and fiction. This type of cinema, as well as apps based on AR, gives people a greater choice when it comes to watching since they can take part in this content through interaction, therefore changing them from passive observers to active participants. Such a shift in narration paradigms can actually be a game changer for this industry because it introduces plenty of opportunities related to narrative creation along with audience involvement. Nevertheless, within entertainment's immersive technology market, challenges lie around ensuring that there is widespread usage for this kind of device, such as VR or AR, together with the production of compelling content. Though momentum has built up around these devices, adoption rates among mainstream consumers remain uncertain. For immersive technology to be adopted, high-quality content that appeals to consumers must be created. Developers and creators of content play a pivotal role in molding the landscape of immersive entertainment by presenting their audiences with these unique experiences and demonstrating the capabilities of these technologies.
    Immersive Technology in Entertainment Market Size Graph

    Market Summary

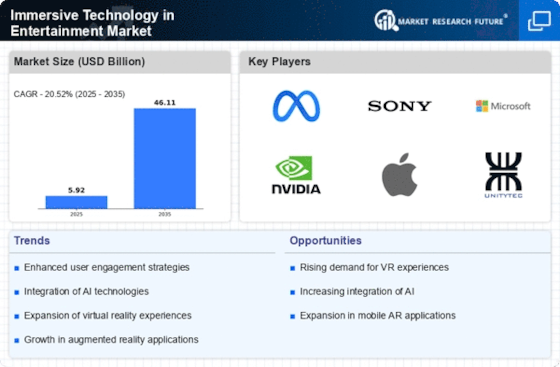
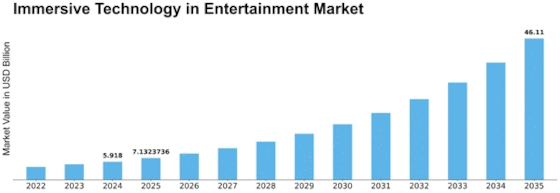
    The Global Immersive Technology in the Entertainment Industry is projected to grow from 5.9 USD Billion in 2024 to 46.1 USD Billion by 2035.

    Key Market Trends & Highlights

    Immersive Technology in Entertainment Industry Key Trends and Highlights

    • The market is expected to experience a compound annual growth rate (CAGR) of 20.55% from 2025 to 2035.
    • By 2035, the market valuation is anticipated to reach 46.1 USD Billion, indicating substantial growth potential.
    • In 2024, the market is valued at 5.9 USD Billion, reflecting the current investment landscape in immersive technology.
    • Growing adoption of immersive technology due to increasing consumer demand for enhanced entertainment experiences is a major market driver.

    Market Size & Forecast

    2024 Market Size 5.92 (USD Billion)
    2035 Market Size 46.11 (USD Billion)
    CAGR (2025-2035) 20.52%
    Largest Regional Market Share in 2024 latin_america)

    Major Players

    Acer Inc., Atheer, Inc., AVEVA Group PLC, Barco NV, Blippar Ltd., Carl Zeiss AG, CM Labs Simulations Inc., EON Reality, Inc., FAAC Incorporated, Google, LLC, HCL Technologies Limited, Honeywell International, Inc., HTC Corporation, Immersive Media Company, Immersive Technologies Pty Limited, Lockheed Martin Corporation, Magic Leap, Inc., NCTech Limited, Oculus (Facebook Technologies, LLC.), Samsung Group, Sony Corporation, Unity Software Inc., Varjo Technologies Oy, VI-grade GmbH, Zeality Inc.

    Market Trends

    Decreasing cost of immersive technology hardware and software is driving the market growth

    The ongoing development of manufacturing and production techniques is one of the main factors contributing to the decreasing cost of immersive technology hardware. Technology businesses have improved their efficiency in mass production as a result of their increased experience in creating VR headsets, AR glasses, and related gadgets. Because of economies of scale brought about by this higher efficiency, production costs have decreased.

    The level of hardware manufacturers' rivalry in the market for immersive technologies has increased. A number of businesses are fighting for market share, including HTC, Sony, Oculus (owned by Meta, formerly Facebook), and others. Price wars and the creation of more economical, consumer-friendly solutions are the results of this rivalry. In addition to drawing in more customers, lower prices also encourage innovation as businesses compete to provide greater features and performance for the same price.

    Users now have access to immersive experiences without the need for high-end, pricey technology thanks to the growth of cloud computing and streaming services. The computing power necessary for these experiences can be transferred to distant servers by cloud-based VR and AR solutions, enabling their use on less powerful hardware. For consumers who might not have access to high-end gaming computers or cellphones, this lowers the pricing barrier.

    High-resolution displays, sensors, and processors—all necessary for immersive technology have gotten cheaper over time. The ability to build more affordable gadgets without sacrificing performance has been made possible by advancements in semiconductor manufacturing, which have produced smaller, more cost-effective, and power-efficient components. Thus, driving the Immersive Technology in Entertainment Industry market revenue.

    The integration of immersive technologies in the entertainment sector is reshaping consumer experiences and driving innovative storytelling methods, thereby enhancing audience engagement and participation.

    U.S. Department of Commerce

    Immersive Technology in Entertainment Market Market Drivers

    Market Growth Chart

    Increased Consumer Demand

    Consumer demand for immersive experiences is a significant driver in the Global Immersive Technology in Entertainment Industry. As audiences seek more engaging and interactive content, the popularity of VR and AR applications in gaming, live events, and cinema continues to rise. This trend is evidenced by the increasing number of VR headsets sold globally, which reached millions in recent years. The growing interest in immersive storytelling and interactive entertainment formats suggests that the market will expand considerably, with projections indicating a potential growth to 46.1 USD Billion by 2035.

    Integration in Live Events

    The integration of immersive technology in live events is transforming the Global Immersive Technology in Entertainment Industry. Concerts, festivals, and sporting events are increasingly incorporating VR and AR elements to enhance audience experiences. For instance, virtual concerts allow fans to attend performances from anywhere in the world, creating a new revenue stream for artists and organizers. This trend not only broadens the audience base but also elevates the overall entertainment experience, suggesting a promising future for immersive technologies in live settings. The potential for growth in this sector is substantial, given the increasing popularity of hybrid events.

    Technological Advancements

    The Global Immersive Technology in Entertainment Industry is propelled by rapid technological advancements. Innovations in virtual reality (VR), augmented reality (AR), and mixed reality (MR) are enhancing user experiences and engagement. For instance, the integration of haptic feedback and 3D audio systems in gaming and film production creates a more immersive environment. As these technologies evolve, they attract a broader audience, contributing to the market's growth. The industry is projected to reach 5.9 USD Billion in 2024, indicating a robust demand for immersive experiences that leverage cutting-edge technology.

    Expansion of Content Libraries

    The expansion of content libraries is crucial for the Global Immersive Technology in Entertainment Industry. Major entertainment companies are investing heavily in creating diverse and high-quality immersive content. For example, platforms like Netflix and Disney+ are exploring VR and AR experiences to enhance viewer engagement. This diversification not only attracts new subscribers but also retains existing ones by offering unique experiences. As the content ecosystem grows, it is likely to stimulate further investment and innovation in immersive technologies, thereby supporting the market's projected CAGR of 20.55% from 2025 to 2035.

    Investment and Funding Opportunities

    Investment and funding opportunities are vital for the Global Immersive Technology in Entertainment Industry. As the market expands, venture capitalists and tech companies are increasingly funding startups focused on immersive technologies. This influx of capital fosters innovation and accelerates the development of new applications in gaming, film, and interactive media. Government initiatives supporting technology development further enhance this landscape, creating a favorable environment for growth. The anticipated market size of 46.1 USD Billion by 2035 underscores the attractiveness of this sector for investors seeking to capitalize on emerging trends.

    Market Segment Insights

    Immersive Technology in Entertainment Industry Component Insights

    The Immersive Technology in Entertainment Industry market segmentation, based on Component, includes Hardware (Head-Mounted Display (HMD), Gesture Tracking Devices (GTD), Projectors & Display Walls (PDW)), Software/Platform, Services (Professional and Managed). The Hardware category generated the most income in 2022. There have been notable improvements in the performance and quality of screens used in VR headsets and AR eyewear. Improvements in refresh rates and field of view (FOV), together with high-resolution OLED and AMOLED displays, have greatly improved the visual immersion and realism of immersive experiences.

    Immersive Technology in Entertainment Industry Technology Insights

    The Immersive Technology in Entertainment Industry market segmentation, based on Technology, includes Mixed Reality (MR), Virtual Reality (VR), Augmented Reality (AR) and 360 Film. The Virtual Reality (VR) category generated the most income in 2022. VR offers unparalleled immersion and engagement, allowing users to step into virtual worlds and interact with content in ways that were previously impossible. This level of immersion is particularly attractive in the entertainment industry, where it enhances storytelling, gaming, and overall user experience.

    Immersive Technology in Entertainment Industry Application Insights

    The Immersive Technology in Entertainment Industry market segmentation, based on Application, includes Training & Learning, Emergency Services, Product Development and Sales & Marketing. The Training & Learning category generated the most income in 2022. Immersive training simulations allow learners to practice and refine their skills in a risk-free environment. This is particularly valuable in industries like aviation, healthcare, and manufacturing, where hands-on training is crucial but can be costly or risky in real-world settings.

    Figure 2: Immersive Technology in Entertainment Industry Market, by application, 2022 & 2032 (USD Billion) Source: Secondary Research, Primary Research, Market Research Future Database and Analyst Review

    Get more detailed insights about Immersive Technology in Entertainment Industry Market Research Report - Forecast till 2034

    Regional Insights

    By region, the study provides the market insights into North America, Europe, Asia-Pacific and Rest of the World. The North America Immersive Technology in Entertainment Industry Market dominated this market in 2022 (45.80%). Due to the relatively high amount of disposable money in North America, customers may purchase hardware and content for immersive technologies. Due to this, virtual reality (VR) and augmented reality (AR) gadgets are increasingly being used for entertainment and other purposes. Further, the U.S.

    Immersive Technology in Entertainment Industry market held the largest market share, and the Canada Immersive Technology in Entertainment Industry market was the fastest growing market in the North America region.

    Further, the major countries studied in the market report are The U.S., Canada, German, France, the UK, Italy, Spain, China, Japan, India, Australia, South Korea, and Brazil.

    Figure 3: IMMERSIVE TECHNOLOGY IN ENTERTAINMENT INDUSTRY MARKET SHARE BY REGION 2022 (USD Billion)

    IMMERSIVE TECHNOLOGY IN ENTERTAINMENT INDUSTRY MARKET SHARE BY REGION

    Source: Secondary Research, Primary Research, Market Research Future Database and Analyst Review

    Europe Immersive Technology in Entertainment Industry market accounts for the second-largest market share. The gaming industry is growing in Europe, and gamers are among the first users of immersive technology. The rise of the immersive technology market in the area has been facilitated by the popularity of VR gaming and eSports competitions. Further, the German Immersive Technology in Entertainment Industry market held the largest market share, and the UK Immersive Technology in Entertainment Industry market was the fastest growing market in the European region.

    The Asia-Pacific Immersive Technology in Entertainment Industry Market is expected to grow at the fastest CAGR from 2023 to 2032. China and South Korea in particular have emerged as major producers and developers of immersive technology gear in the Asia-Pacific region. For instance, Taiwan-based businesses like HTC and Pimax are well known for creating top-notch VR headsets. Moreover, China’s Immersive Technology in Entertainment Industry market held the largest market share, and the Indian Immersive Technology in Entertainment Industry market was the fastest growing market in the Asia-Pacific region.

    Key Players and Competitive Insights

    Leading market players are investing heavily in research and development in order to expand their product lines, which will help the Immersive Technology in Entertainment Industry market, grow even more. Market participants are also undertaking a variety of strategic activities to expand their footprint, with important market developments including new product launches, contractual agreements, mergers and acquisitions, higher investments, and collaboration with other organizations. To expand and survive in a more competitive and rising market climate, Immersive Technology in Entertainment Industry industry must offer cost-effective items.

    Manufacturing locally to minimize operational costs is one of the key business tactics used by manufacturers in the Immersive Technology in Entertainment Industry industry to benefit clients and increase the market sector. In recent years, the Immersive Technology in Entertainment Industry industry has offered some of the most significant advantages to medicine.

    Major players in the Immersive Technology in Entertainment Industry market, including Acer Inc., Atheer, Inc., AVEVA Group PLC, Barco NV, Blippar Ltd., Carl Zeiss AG, CM Labs Simulations Inc., EON Reality, Inc., FAAC Incorporated, Google, LLC, HCL Technologies Limited, Honeywell International, Inc., HTC Corporation, Immersive Media Company, Immersive Technologies Pty Limited, Lockheed Martin Corporation, Magic Leap, Inc., NCTech Limited, Oculus (Facebook Technologies, LLC.), Samsung Group, Sony Corporation, Unity Software Inc., Varjo Technologies Oy, VI-grade GmbH, Zeality Inc. and others, are attempting to increase market demand by investing in research and development operations.

    Sony Group Corp. (Sony) manufactures a variety of products, including devices, tools, medical equipment, semiconductors, and electronics. The company's products include batteries, software, televisions, cell phones, cameras, music systems, game consoles, and other electrical equipment. Sony produces, buys, and distributes motion films, television programs, and recorded music in addition to operating television and digital networks. Through distributors, sales divisions, and online direct sales, the company promotes its products. Under the names Airpeak, Sony, PlayStation, Walkman, Blu-ray, Cyber-shot, Bravia, Exmor, and Experia, it offers products for sale.

    Africa, the Middle East, Asia-Pacific, and the Americas are all where the company has activities. Sony's corporate headquarters are in Minato-Ku, Tokyo, Japan.

    A technological business called Unity Software Inc. (Unity Technologies) creates software platforms. The business offers the (RT3D) development platform, which gives programmers the means to make complex, interactive 2D, 3D, VR, and AR experiences. The product lines offered by Unity Technologies include, among others, Unity Plus, Unity Enterprise, Unity MARS, Unity Build Server, Pixyz, Optimization Accelerator, and multiplayer games. In addition, the business offers RT3D in a variety of industries, including architecture, games, movies, and engineering and construction. San Francisco, California, in the United States, serves as the home base for Unity Technologies.

    Key Companies in the Immersive Technology in Entertainment Market market include

    Industry Developments

    • Q2 2024: Apple launches Vision Pro headset, marking major entry into immersive entertainment Apple officially launched its Vision Pro mixed reality headset, targeting both entertainment and productivity markets, with immersive content partnerships announced at launch.
    • Q2 2024: Meta announces partnership with Universal Music Group to bring immersive music experiences to Horizon Worlds Meta and Universal Music Group entered a partnership to deliver interactive, VR-based music events and experiences within Meta's Horizon Worlds platform.
    • Q2 2024: Sony acquires immersive gaming studio Beyond Games to expand PlayStation VR content Sony completed the acquisition of Beyond Games, a studio specializing in immersive and interactive entertainment, to bolster its PlayStation VR content portfolio.
    • Q2 2024: Disney opens first permanent immersive experience center in Tokyo Disney inaugurated its first permanent immersive entertainment center in Tokyo, featuring VR and AR attractions based on popular franchises.
    • Q2 2024: HTC launches VIVE Ultimate Entertainment Suite for home VR experiences HTC released the VIVE Ultimate Entertainment Suite, a new VR platform designed for home users, offering a curated selection of immersive games and interactive media.
    • Q3 2024: Magic Leap secures $150 million Series D funding to expand AR entertainment offerings Magic Leap raised $150 million in Series D funding to accelerate development of augmented reality solutions for the entertainment sector.
    • Q3 2024: Barco unveils new immersive LED cinema technology at CineEurope 2024 Barco introduced its latest immersive LED cinema display technology, promising enhanced visual experiences for moviegoers and new opportunities for entertainment venues.
    • Q3 2024: Meta appoints new Head of Immersive Entertainment to lead VR content strategy Meta named a new executive to oversee its immersive entertainment division, focusing on expanding VR content and partnerships for Meta Quest devices.
    • Q3 2024: Netflix launches first interactive VR series in partnership with Oculus Netflix debuted its first interactive VR series, developed in collaboration with Oculus, allowing viewers to engage with storylines in a fully immersive environment.
    • Q4 2024: Warner Bros. opens immersive Harry Potter experience in London Warner Bros. launched a new immersive Harry Potter attraction in London, featuring AR and VR elements to enhance visitor engagement.
    • Q1 2025: Roblox acquires immersive entertainment startup Imaginarium for $80 million Roblox acquired Imaginarium, a startup specializing in immersive entertainment experiences, to expand its platform's capabilities in virtual events and interactive media.
    • Q2 2025: Sony announces partnership with Epic Games to develop next-generation immersive entertainment content Sony and Epic Games formed a strategic partnership to co-develop advanced immersive entertainment content, leveraging Unreal Engine and PlayStation VR technologies.

    Future Outlook

    Immersive Technology in Entertainment Market Future Outlook

    The Global Immersive Technology in Entertainment Industry is projected to grow at a 20.55% CAGR from 2024 to 2035, driven by advancements in VR, AR, and AI technologies.

    New opportunities lie in:

    • Develop immersive storytelling experiences for streaming platforms to enhance viewer engagement.
    • Invest in AR applications for live events, creating interactive audience experiences.
    • Leverage AI to personalize content delivery in immersive gaming environments.

    By 2035, the market is expected to be a pivotal force in reshaping entertainment experiences globally.

    Market Segmentation

    Immersive Technology in Entertainment Industry Regional Outlook

    • U.S.
    • Canada

    Immersive Technology in Entertainment Industry Component Outlook

    • Head-Mounted Display (HMD)
    • Gesture Tracking Devices (GTD)
    • Projectors & Display Walls (PDW)

    Immersive Technology in Entertainment Industry Technology Outlook

    • Mixed Reality (MR)
    • Virtual Reality (VR)
    • Augmented Reality (AR)
    • 360 Film

    Immersive Technology in Entertainment Industry Application Outlook

    • Training & Learning
    • Emergency Services
    • Product Development
    • Sales & Marketing

    Report Scope

    Report Attribute/Metric Details
    Market Size 2024 5.91 (USD Billion)
    Market Size 2025 7.13 (USD Billion)
    Market Size 2034 38.25 (USD Billion)
    Compound Annual Growth Rate (CAGR) 20.52% (2025 - 2034)
    Report Coverage Revenue Forecast, Competitive Landscape, Growth Factors, and Trends
    Base Year 2024
    Market Forecast Period 2025 - 2034
    Historical Data 2019 - 2023
    Market Forecast Units USD Billion
    Segments Covered Component, Technology, Application, and Region
    Geographies Covered North America, Europe, Asia Pacific, and the Rest of the World
    Countries Covered The U.S., Canada, German, France, UK, Italy, Spain, China, Japan, India, Australia, South Korea, and Brazil
    Key Companies Profiled Acer Inc., Atheer, Inc., AVEVA Group PLC, Barco NV, Blippar Ltd., Carl Zeiss AG, CM Labs Simulations Inc., EON Reality, Inc., FAAC Incorporated, Google, LLC, HCL Technologies Limited, Honeywell International, Inc., HTC Corporation, Immersive Media Company, Immersive Technologies Pty Limited, Lockheed Martin Corporation, Magic Leap, Inc., NCTech Limited, Oculus (Facebook Technologies, LLC.), Samsung Group, Sony Corporation, Unity Software Inc., Varjo Technologies Oy, VI-grade GmbH, Zeality Inc.
    Key Market Opportunities The expanding application of immersive technology in training and education.
    Key Market Dynamics Increasing demand for image creation in entertainment sector

    Market Highlights

    Author

    Aarti Dhapte
    Team Lead - Research

    She holds an experience of about 6+ years in market research and business consulting, working under the spectrum of information communication technology, telecommunications and semiconductor domains. aarti conceptualizes and implements a scalable business strategy and provides strategic leadership to the clients. her expertise lies in market estimation, competitive intelligence, pipeline analysis, customer assessment, etc.

    Leave a Comment

    Latest Comments

    John Doe

    This is a great article! Really helped me understand the topic better.

    Posted on July 23, 2025, 10:15 AM
    Jane Smith

    Thanks for sharing this. I’ve bookmarked it for later reference.

    Posted on July 22, 2025, 7:45 PM

    FAQs

    How much is the Immersive Technology in Entertainment Industry market?

    The global Immersive Technology in Entertainment Industry market size was valued at USD 5.91 Billion in 2024.

    What is the growth rate of the Immersive Technology in Entertainment Industry market?

    The global market is projected to grow at a CAGR of 20.52% during the forecast period, 2025-2034.

    Which region held the largest market share in the Immersive Technology in Entertainment Industry market?

    North America had the largest share in the market

    Who are the key players in the Immersive Technology in Entertainment Industry market?

    The key players in the market are Acer Inc., Atheer, Inc., AVEVA Group PLC, Barco NV, Blippar Ltd., Carl Zeiss AG, CM Labs Simulations Inc., EON Reality, Inc., FAAC Incorporated, Google, LLC, HCL Technologies Limited, Honeywell International, Inc., HTC Corporation, Immersive Media Company, Immersive Technologies Pty Limited, Lockheed Martin Corporation, Magic Leap, Inc., NCTech Limited, Oculus (Facebook Technologies, LLC.), Samsung Group, Sony Corporation, Unity Software Inc., Varjo Technologies Oy, VI-grade GmbH, Zeality Inc.

    Which Component led the Immersive Technology in Entertainment Industry market?

    The Hardware category dominated the market in 2024.

    Which Technology had the largest market share in the Immersive Technology in Entertainment Industry market?

    The Virtual Reality (VR) had the largest share in the market.

    1. Table of Contents
    2. Executive Summary
    3. Market Introduction
      1. Definition
      2. Scope of the Study
        1. Research Objective
        2. Assumptions
        3. Limitations
    4. Research Methodology
      1. Overview
      2. Data Mining
      3. Secondary Research
      4. Primary Research
        1. Primary Interviews and Information Gathering Process
        2. Breakdown of Primary Respondents
      5. Forecasting Modality
      6. Market Size Estimation
        1. Bottom-up Approach
        2. Top-Down Approach
      7. Data Triangulation
      8. Validation
    5. MARKET DYNAMICS
      1. Overview
      2. Drivers
      3. Restraints
      4. Opportunities
    6. MARKET FACTOR ANALYSIS
      1. Value Chain Analysis
      2. Porter’s Five Forces Analysis
        1. Bargaining Power of Suppliers
        2. Bargaining Power of Buyers
        3. Threat of New Entrants
        4. Threat of Substitutes
        5. Intensity of Rivalry
      3. COVID-19 Impact Analysis
        1. Market Impact Analysis
        2. Regional Impact
        3. Opportunity and Threat Analysis
    7. GLOBAL IMMERSIVE TECHNOLOGY IN ENTERTAINMENT INDUSTRY, BY COMPONENT
      1. Overview
      2. Hardware
        1. Head-Mounted Display (HMD)
        2. Gesture Tracking Devices (GTD)
        3. Projectors & Display Walls (PDW)
      3. Software/Platform
      4. Services
        1. Professional
        2. Managed
    8. GLOBAL IMMERSIVE TECHNOLOGY IN ENTERTAINMENT INDUSTRY, BY TECHNOLOGY
      1. Overview
      2. Mixed Reality (MR)
      3. Virtual Reality (VR)
      4. Augmented Reality (AR)
      5. 360 Film
    9. GLOBAL IMMERSIVE TECHNOLOGY IN ENTERTAINMENT INDUSTRY, BY APPLICATION
      1. Overview
      2. Training & Learning
      3. Emergency Services
      4. Product Development
      5. Sales & Marketing
    10. GLOBAL IMMERSIVE TECHNOLOGY IN ENTERTAINMENT INDUSTRY, BY REGION
      1. Overview
      2. North America
        1. U.S.
        2. Canada
      3. Europe
        1. Germany
        2. France
        3. U.K
        4. Italy
        5. Spain
        6. Rest of Europe
      4. Asia-Pacific
        1. China
        2. India
        3. Japan
        4. South Korea
        5. Australia
        6. Rest of Asia-Pacific
      5. Rest of the World
        1. Middle East
        2. Africa
        3. Latin America
    11. Competitive Landscape
      1. Overview
      2. Competitive Analysis
      3. Market Share Analysis
      4. Major Growth Strategy in the Global IMMERSIVE TECHNOLOGY IN ENTERTAINMENT INDUSTRY,
      5. Competitive Benchmarking
      6. Leading Players in Terms of Number of Developments in the Global IMMERSIVE TECHNOLOGY IN ENTERTAINMENT INDUSTRY,
      7. Key developments and Growth Strategies
        1. New COMPONENT Launch/TECHNOLOGY Application
        2. Merger & Acquisitions
        3. Joint Ventures
      8. Major Players Financial Matrix
        1. Sales & Operating Income, 2022
        2. Major Players R&D Expenditure. 2022
    12. COMPANY PROFILES
      1. ACER INC.
        1. Company Overview
        2. Financial Overview
        3. Products Offered
        4. Key Developments
        5. SWOT Analysis
        6. Key Strategies
      2. Atheer, Inc.
        1. Company Overview
        2. Financial Overview
        3. Products Offered
        4. Key Developments
        5. SWOT Analysis
        6. Key Strategies
      3. AVEVA Group PLC
        1. Company Overview
        2. Financial Overview
        3. Products Offered
        4. Key Developments
        5. SWOT Analysis
        6. Key Strategies
      4. Barco NV
        1. Company Overview
        2. Financial Overview
        3. Products Offered
        4. Key Developments
        5. SWOT Analysis
        6. Key Strategies
      5. Blippar Ltd.
        1. Company Overview
        2. Financial Overview
        3. Products Offered
        4. Key Developments
        5. SWOT Analysis
        6. Key Strategies
      6. Carl Zeiss AG
        1. Company Overview
        2. Financial Overview
        3. Products Offered
        4. Key Developments
        5. SWOT Analysis
        6. Key Strategies
      7. CM Labs Simulations Inc.
        1. Company Overview
        2. Financial Overview
        3. Products Offered
        4. Key Developments
        5. SWOT Analysis
        6. Key Strategies
      8. EON Reality, Inc.
        1. Company Overview
        2. Financial Overview
        3. Products Offered
        4. Key Developments
        5. SWOT Analysis
        6. Key Strategies
      9. FAAC Incorporated
        1. Company Overview
        2. Financial Overview
        3. Products Offered
        4. Key Developments
        5. SWOT Analysis
        6. Key Strategies
      10. Google, LLC
        1. Company Overview
        2. Financial Overview
        3. Products Offered
        4. Key Developments
        5. SWOT Analysis
        6. Key Strategies
      11. HCL Technologies Limited
        1. Company Overview
        2. Financial Overview
        3. Products Offered
        4. Key Developments
        5. SWOT Analysis
        6. Key Strategies
      12. Honeywell International, Inc.
        1. Company Overview
        2. Financial Overview
        3. Products Offered
        4. Key Developments
        5. SWOT Analysis
        6. Key Strategies
      13. HTC Corporation
        1. Company Overview
        2. Financial Overview
        3. Products Offered
        4. Key Developments
        5. SWOT Analysis
        6. Key Strategies
      14. Immersive Media Company
        1. Company Overview
        2. Financial Overview
        3. Products Offered
        4. Key Developments
        5. SWOT Analysis
        6. Key Strategies
      15. Immersive Technologies Pty Limited
        1. Company Overview
        2. Financial Overview
        3. Products Offered
        4. Key Developments
        5. SWOT Analysis
        6. Key Strategies
      16. Lockheed Martin Corporation
        1. Company Overview
        2. Financial Overview
        3. Products Offered
        4. Key Developments
        5. SWOT Analysis
        6. Key Strategies
      17. Magic Leap, Inc.
        1. Company Overview
        2. Financial Overview
        3. Products Offered
        4. Key Developments
        5. SWOT Analysis
        6. Key Strategies
      18. NCTech Limited
        1. Company Overview
        2. Financial Overview
        3. Products Offered
        4. Key Developments
        5. SWOT Analysis
        6. Key Strategies
      19. Oculus (Facebook Technologies, LLC.)
        1. Company Overview
        2. Financial Overview
        3. Products Offered
        4. Key Developments
        5. SWOT Analysis
        6. Key Strategies
      20. Samsung Group
        1. Company Overview
        2. Financial Overview
        3. Products Offered
        4. Key Developments
        5. SWOT Analysis
        6. Key Strategies
      21. Sony Corporation
        1. Company Overview
        2. Financial Overview
        3. Products Offered
        4. Key Developments
        5. SWOT Analysis
        6. Key Strategies
      22. Unity Software Inc.
        1. Company Overview
        2. Financial Overview
        3. Products Offered
        4. Key Developments
        5. SWOT Analysis
        6. Key Strategies
      23. Varjo Technologies Oy
        1. Company Overview
        2. Financial Overview
        3. Products Offered
        4. Key Developments
        5. SWOT Analysis
        6. Key Strategies
      24. VI-grade GmbH
        1. Company Overview
        2. Financial Overview
        3. Products Offered
        4. Key Developments
        5. SWOT Analysis
        6. Key Strategies
      25. Zeality Inc.
        1. Company Overview
        2. Financial Overview
        3. Products Offered
        4. Key Developments
        5. SWOT Analysis
        6. Key Strategies
    13. APPENDIX
      1. References
      2. Related Reports
    14. List of Tables and Figures
      1. LIST OF TABLES
      2. TABLE 1 GLOBAL IMMERSIVE TECHNOLOGY IN ENTERTAINMENT INDUSTRY, SYNOPSIS, 2018-2032
      3. TABLE 2 GLOBAL IMMERSIVE TECHNOLOGY IN ENTERTAINMENT INDUSTRY, ESTIMATES & FORECAST, 2018-2032 (USD BILLION)
      4. TABLE 3 GLOBAL IMMERSIVE TECHNOLOGY IN ENTERTAINMENT INDUSTRY, BY COMPONENT, 2018-2032 (USD BILLION)
      5. TABLE 4 GLOBAL IMMERSIVE TECHNOLOGY IN ENTERTAINMENT INDUSTRY, BY TECHNOLOGY, 2018-2032 (USD BILLION)
      6. TABLE 5 GLOBAL IMMERSIVE TECHNOLOGY IN ENTERTAINMENT INDUSTRY, BY APPLICATION, 2018-2032 (USD BILLION)
      7. TABLE 6 NORTH AMERICA IMMERSIVE TECHNOLOGY IN ENTERTAINMENT INDUSTRY, BY COMPONENT, 2018-2032 (USD BILLION)
      8. TABLE 7 NORTH AMERICA IMMERSIVE TECHNOLOGY IN ENTERTAINMENT INDUSTRY, BY TECHNOLOGY, 2018-2032 (USD BILLION)
      9. TABLE 8 NORTH AMERICA IMMERSIVE TECHNOLOGY IN ENTERTAINMENT INDUSTRY, BY APPLICATION, 2018-2032 (USD BILLION)
      10. TABLE 9 NORTH AMERICA IMMERSIVE TECHNOLOGY IN ENTERTAINMENT INDUSTRY, BY COUNTRY, 2018-2032 (USD BILLION)
      11. TABLE 10 U.S. IMMERSIVE TECHNOLOGY IN ENTERTAINMENT INDUSTRY, BY COMPONENT, 2018-2032 (USD BILLION)
      12. TABLE 11 U.S. IMMERSIVE TECHNOLOGY IN ENTERTAINMENT INDUSTRY, BY TECHNOLOGY, 2018-2032 (USD BILLION)
      13. TABLE 12 U.S. IMMERSIVE TECHNOLOGY IN ENTERTAINMENT INDUSTRY, BY APPLICATION, 2018-2032 (USD BILLION)
      14. TABLE 13 CANADA IMMERSIVE TECHNOLOGY IN ENTERTAINMENT INDUSTRY, BY COMPONENT, 2018-2032 (USD BILLION)
      15. TABLE 14 CANADA IMMERSIVE TECHNOLOGY IN ENTERTAINMENT INDUSTRY, BY TECHNOLOGY, 2018-2032 (USD BILLION)
      16. TABLE 15 CANADA IMMERSIVE TECHNOLOGY IN ENTERTAINMENT INDUSTRY, BY APPLICATION, 2018-2032 (USD BILLION)
      17. TABLE 16 EUROPE IMMERSIVE TECHNOLOGY IN ENTERTAINMENT INDUSTRY, BY COMPONENT, 2018-2032 (USD BILLION)
      18. TABLE 17 EUROPE IMMERSIVE TECHNOLOGY IN ENTERTAINMENT INDUSTRY, BY TECHNOLOGY, 2018-2032 (USD BILLION)
      19. TABLE 18 EUROPE IMMERSIVE TECHNOLOGY IN ENTERTAINMENT INDUSTRY, BY APPLICATION, 2018-2032 (USD BILLION)
      20. TABLE 19 EUROPE IMMERSIVE TECHNOLOGY IN ENTERTAINMENT INDUSTRY, BY COUNTRY, 2018-2032 (USD BILLION)
      21. TABLE 20 GERMANY IMMERSIVE TECHNOLOGY IN ENTERTAINMENT INDUSTRY, BY COMPONENT, 2018-2032 (USD BILLION)
      22. TABLE 21 GERMANY IMMERSIVE TECHNOLOGY IN ENTERTAINMENT INDUSTRY, BY TECHNOLOGY, 2018-2032 (USD BILLION)
      23. TABLE 22 GERMANY IMMERSIVE TECHNOLOGY IN ENTERTAINMENT INDUSTRY, BY APPLICATION, 2018-2032 (USD BILLION)
      24. TABLE 23 FRANCE IMMERSIVE TECHNOLOGY IN ENTERTAINMENT INDUSTRY, BY COMPONENT, 2018-2032 (USD BILLION)
      25. TABLE 24 FRANCE IMMERSIVE TECHNOLOGY IN ENTERTAINMENT INDUSTRY, BY TECHNOLOGY, 2018-2032 (USD BILLION)
      26. TABLE 25 FRANCE IMMERSIVE TECHNOLOGY IN ENTERTAINMENT INDUSTRY, BY APPLICATION, 2018-2032 (USD BILLION)
      27. TABLE 26 ITALY IMMERSIVE TECHNOLOGY IN ENTERTAINMENT INDUSTRY, BY COMPONENT, 2018-2032 (USD BILLION)
      28. TABLE 27 ITALY IMMERSIVE TECHNOLOGY IN ENTERTAINMENT INDUSTRY, BY TECHNOLOGY, 2018-2032 (USD BILLION)
      29. TABLE 28 ITALY IMMERSIVE TECHNOLOGY IN ENTERTAINMENT INDUSTRY, BY APPLICATION, 2018-2032 (USD BILLION)
      30. TABLE 29 SPAIN IMMERSIVE TECHNOLOGY IN ENTERTAINMENT INDUSTRY, BY COMPONENT, 2018-2032 (USD BILLION)
      31. TABLE 30 SPAIN IMMERSIVE TECHNOLOGY IN ENTERTAINMENT INDUSTRY, BY TECHNOLOGY, 2018-2032 (USD BILLION)
      32. TABLE 31 SPAIN IMMERSIVE TECHNOLOGY IN ENTERTAINMENT INDUSTRY, BY APPLICATION, 2018-2032 (USD BILLION)
      33. TABLE 32 U.K IMMERSIVE TECHNOLOGY IN ENTERTAINMENT INDUSTRY, BY COMPONENT, 2018-2032 (USD BILLION)
      34. TABLE 33 U.K IMMERSIVE TECHNOLOGY IN ENTERTAINMENT INDUSTRY, BY TECHNOLOGY, 2018-2032 (USD BILLION)
      35. TABLE 34 U.K IMMERSIVE TECHNOLOGY IN ENTERTAINMENT INDUSTRY, BY APPLICATION, 2018-2032 (USD BILLION)
      36. TABLE 35 REST OF EUROPE IMMERSIVE TECHNOLOGY IN ENTERTAINMENT INDUSTRY, BY COMPONENT, 2018-2032 (USD BILLION)
      37. TABLE 36 REST OF EUROPE IMMERSIVE TECHNOLOGY IN ENTERTAINMENT INDUSTRY, BY TECHNOLOGY, 2018-2032 (USD BILLION)
      38. TABLE 37 REST OF EUROPE IMMERSIVE TECHNOLOGY IN ENTERTAINMENT INDUSTRY, BY APPLICATION, 2018-2032 (USD BILLION)
      39. TABLE 38 ASIA PACIFIC IMMERSIVE TECHNOLOGY IN ENTERTAINMENT INDUSTRY, BY COMPONENT, 2018-2032 (USD BILLION)
      40. TABLE 39 ASIA PACIFIC IMMERSIVE TECHNOLOGY IN ENTERTAINMENT INDUSTRY, BY TECHNOLOGY, 2018-2032 (USD BILLION)
      41. TABLE 40 ASIA PACIFIC IMMERSIVE TECHNOLOGY IN ENTERTAINMENT INDUSTRY, BY APPLICATION, 2018-2032 (USD BILLION)
      42. TABLE 41 ASIA PACIFIC IMMERSIVE TECHNOLOGY IN ENTERTAINMENT INDUSTRY, BY COUNTRY, 2018-2032 (USD BILLION)
      43. TABLE 42 JAPAN IMMERSIVE TECHNOLOGY IN ENTERTAINMENT INDUSTRY, BY COMPONENT, 2018-2032 (USD BILLION)
      44. TABLE 43 JAPAN IMMERSIVE TECHNOLOGY IN ENTERTAINMENT INDUSTRY, BY TECHNOLOGY, 2018-2032 (USD BILLION)
      45. TABLE 44 JAPAN IMMERSIVE TECHNOLOGY IN ENTERTAINMENT INDUSTRY, BY APPLICATION, 2018-2032 (USD BILLION)
      46. TABLE 45 CHINA IMMERSIVE TECHNOLOGY IN ENTERTAINMENT INDUSTRY, BY COMPONENT, 2018-2032 (USD BILLION)
      47. TABLE 46 CHINA IMMERSIVE TECHNOLOGY IN ENTERTAINMENT INDUSTRY, BY TECHNOLOGY, 2018-2032 (USD BILLION)
      48. TABLE 47 CHINA IMMERSIVE TECHNOLOGY IN ENTERTAINMENT INDUSTRY, BY APPLICATION, 2018-2032 (USD BILLION)
      49. TABLE 48 INDIA IMMERSIVE TECHNOLOGY IN ENTERTAINMENT INDUSTRY, BY COMPONENT, 2018-2032 (USD BILLION)
      50. TABLE 49 INDIA IMMERSIVE TECHNOLOGY IN ENTERTAINMENT INDUSTRY, BY TECHNOLOGY, 2018-2032 (USD BILLION)
      51. TABLE 50 INDIA IMMERSIVE TECHNOLOGY IN ENTERTAINMENT INDUSTRY, BY APPLICATION, 2018-2032 (USD BILLION)
      52. TABLE 51 AUSTRALIA IMMERSIVE TECHNOLOGY IN ENTERTAINMENT INDUSTRY, BY COMPONENT, 2018-2032 (USD BILLION)
      53. TABLE 52 AUSTRALIA IMMERSIVE TECHNOLOGY IN ENTERTAINMENT INDUSTRY, BY TECHNOLOGY, 2018-2032 (USD BILLION)
      54. TABLE 53 AUSTRALIA IMMERSIVE TECHNOLOGY IN ENTERTAINMENT INDUSTRY, BY APPLICATION, 2018-2032 (USD BILLION)
      55. TABLE 54 SOUTH KOREA IMMERSIVE TECHNOLOGY IN ENTERTAINMENT INDUSTRY, BY COMPONENT, 2018-2032 (USD BILLION)
      56. TABLE 55 SOUTH KOREA IMMERSIVE TECHNOLOGY IN ENTERTAINMENT INDUSTRY, BY TECHNOLOGY, 2018-2032 (USD BILLION)
      57. TABLE 56 SOUTH KOREA IMMERSIVE TECHNOLOGY IN ENTERTAINMENT INDUSTRY, BY APPLICATION, 2018-2032 (USD BILLION)
      58. TABLE 57 REST OF ASIA-PACIFIC IMMERSIVE TECHNOLOGY IN ENTERTAINMENT INDUSTRY, BY COMPONENT, 2018-2032 (USD BILLION)
      59. TABLE 58 REST OF ASIA-PACIFIC IMMERSIVE TECHNOLOGY IN ENTERTAINMENT INDUSTRY, BY TECHNOLOGY, 2018-2032 (USD BILLION)
      60. TABLE 59 REST OF ASIA-PACIFIC IMMERSIVE TECHNOLOGY IN ENTERTAINMENT INDUSTRY, BY APPLICATION, 2018-2032 (USD BILLION)
      61. TABLE 60 REST OF WORLD IMMERSIVE TECHNOLOGY IN ENTERTAINMENT INDUSTRY, BY COMPONENT, 2018-2032 (USD BILLION)
      62. TABLE 61 REST OF WORLD IMMERSIVE TECHNOLOGY IN ENTERTAINMENT INDUSTRY, BY TECHNOLOGY, 2018-2032 (USD BILLION)
      63. TABLE 62 REST OF WORLD IMMERSIVE TECHNOLOGY IN ENTERTAINMENT INDUSTRY, BY APPLICATION, 2018-2032 (USD BILLION)
      64. TABLE 63 REST OF WORLD IMMERSIVE TECHNOLOGY IN ENTERTAINMENT INDUSTRY, BY COUNTRY, 2018-2032 (USD BILLION)
      65. TABLE 64 MIDDLE EAST IMMERSIVE TECHNOLOGY IN ENTERTAINMENT INDUSTRY, BY COMPONENT, 2018-2032 (USD BILLION)
      66. TABLE 65 MIDDLE EAST IMMERSIVE TECHNOLOGY IN ENTERTAINMENT INDUSTRY, BY TECHNOLOGY, 2018-2032 (USD BILLION)
      67. TABLE 66 MIDDLE EAST IMMERSIVE TECHNOLOGY IN ENTERTAINMENT INDUSTRY, BY APPLICATION, 2018-2032 (USD BILLION)
      68. TABLE 67 AFRICA IMMERSIVE TECHNOLOGY IN ENTERTAINMENT INDUSTRY, BY COMPONENT, 2018-2032 (USD BILLION)
      69. TABLE 68 AFRICA IMMERSIVE TECHNOLOGY IN ENTERTAINMENT INDUSTRY, BY TECHNOLOGY, 2018-2032 (USD BILLION)
      70. TABLE 69 AFRICA IMMERSIVE TECHNOLOGY IN ENTERTAINMENT INDUSTRY, BY APPLICATION, 2018-2032 (USD BILLION)
      71. TABLE 70 LATIN AMERICA IMMERSIVE TECHNOLOGY IN ENTERTAINMENT INDUSTRY, BY COMPONENT, 2018-2032 (USD BILLION)
      72. TABLE 71 LATIN AMERICA IMMERSIVE TECHNOLOGY IN ENTERTAINMENT INDUSTRY, BY TECHNOLOGY, 2018-2032 (USD BILLION)
      73. TABLE 72 LATIN AMERICA IMMERSIVE TECHNOLOGY IN ENTERTAINMENT INDUSTRY, BY APPLICATION, 2018-2032 (USD BILLION)   LIST OF FIGURES
      74. FIGURE 1 RESEARCH PROCESS
      75. FIGURE 2 MARKET STRUCTURE FOR THE GLOBAL IMMERSIVE TECHNOLOGY IN ENTERTAINMENT INDUSTRY
      76. FIGURE 3 MARKET DYNAMICS FOR THE GLOBAL IMMERSIVE TECHNOLOGY IN ENTERTAINMENT INDUSTRY
      77. FIGURE 4 GLOBAL IMMERSIVE TECHNOLOGY IN ENTERTAINMENT INDUSTRY, SHARE (%), BY COMPONENT, 2022
      78. FIGURE 5 GLOBAL IMMERSIVE TECHNOLOGY IN ENTERTAINMENT INDUSTRY, SHARE (%), BY TECHNOLOGY, 2022
      79. FIGURE 6 GLOBAL IMMERSIVE TECHNOLOGY IN ENTERTAINMENT INDUSTRY, SHARE (%), BY APPLICATION, 2022
      80. FIGURE 7 GLOBAL IMMERSIVE TECHNOLOGY IN ENTERTAINMENT INDUSTRY, SHARE (%), BY REGION, 2022
      81. FIGURE 8 NORTH AMERICA: IMMERSIVE TECHNOLOGY IN ENTERTAINMENT INDUSTRY, SHARE (%), BY REGION, 2022
      82. FIGURE 9 EUROPE: IMMERSIVE TECHNOLOGY IN ENTERTAINMENT INDUSTRY, SHARE (%), BY REGION, 2022
      83. FIGURE 10 ASIA-PACIFIC: IMMERSIVE TECHNOLOGY IN ENTERTAINMENT INDUSTRY, SHARE (%), BY REGION, 2022
      84. FIGURE 11 REST OF THE WORLD: IMMERSIVE TECHNOLOGY IN ENTERTAINMENT INDUSTRY, SHARE (%), BY REGION, 2022
      85. FIGURE 12 GLOBAL IMMERSIVE TECHNOLOGY IN ENTERTAINMENT INDUSTRY: COMPANY SHARE ANALYSIS, 2022 (%)
      86. FIGURE 13 ACER INC. : FINANCIAL OVERVIEW SNAPSHOT
      87. FIGURE 14 ACER INC. : SWOT ANALYSIS
      88. FIGURE 15 AVEVA GROUP PLC: FINANCIAL OVERVIEW SNAPSHOT
      89. FIGURE 16 AVEVA GROUP PLC: SWOT ANALYSIS
      90. FIGURE 17 BARCO NV: FINANCIAL OVERVIEW SNAPSHOT
      91. FIGURE 18 BARCO NV: SWOT ANALYSIS
      92. FIGURE 19 BLIPPAR LTD. : FINANCIAL OVERVIEW SNAPSHOT
      93. FIGURE 20 BLIPPAR LTD. : SWOT ANALYSIS
      94. FIGURE 21 CARL ZEISS AG: FINANCIAL OVERVIEW SNAPSHOT
      95. FIGURE 22 CARL ZEISS AG: SWOT ANALYSIS
      96. FIGURE 23 CM LABS SIMULATIONS INC. : FINANCIAL OVERVIEW SNAPSHOT
      97. FIGURE 24 CM LABS SIMULATIONS INC. : SWOT ANALYSIS
      98. FIGURE 25 FAAC INCORPORATED: FINANCIAL OVERVIEW SNAPSHOT
      99. FIGURE 26 FAAC INCORPORATED: SWOT ANALYSIS
      100. FIGURE 27 HCL TECHNOLOGIES LIMITED: FINANCIAL OVERVIEW SNAPSHOT
      101. FIGURE 28 HCL TECHNOLOGIES LIMITED: SWOT ANALYSIS
      102. FIGURE 29 HTC CORPORATION: FINANCIAL OVERVIEW SNAPSHOT
      103. FIGURE 30 HTC CORPORATION: SWOT ANALYSIS
      104. FIGURE 31 IMMERSIVE MEDIA COMPANY: FINANCIAL OVERVIEW SNAPSHOT
      105. FIGURE 32 IMMERSIVE MEDIA COMPANY: SWOT ANALYSIS
      106. FIGURE 33 ATHEER, INC. : FINANCIAL OVERVIEW SNAPSHOT
      107. FIGURE 34 ATHEER, INC. : SWOT ANALYSIS
      108. FIGURE 35 EON REALITY, INC. : FINANCIAL OVERVIEW SNAPSHOT
      109. FIGURE 36 EON REALITY, INC. : SWOT ANALYSIS
      110. FIGURE 37 GOOGLE, LLC: FINANCIAL OVERVIEW SNAPSHOT
      111. FIGURE 38 GOOGLE, LLC: SWOT ANALYSIS
      112. FIGURE 39 HONEYWELL INTERNATIONAL, INC. : FINANCIAL OVERVIEW SNAPSHOT
      113. FIGURE 40 HONEYWELL INTERNATIONAL, INC. : SWOT ANALYSIS
      114. FIGURE 41 IMMERSIVE TECHNOLOGIES PTY LIMITED: FINANCIAL OVERVIEW SNAPSHOT
      115. FIGURE 42 IMMERSIVE TECHNOLOGIES PTY LIMITED: SWOT ANALYSIS
      116. FIGURE 43 LOCKHEED MARTIN CORPORATION: FINANCIAL OVERVIEW SNAPSHOT
      117. FIGURE 44 LOCKHEED MARTIN CORPORATION: SWOT ANALYSIS
      118. FIGURE 45 MAGIC LEAP, INC. : FINANCIAL OVERVIEW SNAPSHOT
      119. FIGURE 46 MAGIC LEAP, INC. : SWOT ANALYSIS
      120. FIGURE 47 NCTECH LIMITED: FINANCIAL OVERVIEW SNAPSHOT
      121. FIGURE 48 NCTECH LIMITED: SWOT ANALYSIS
      122. FIGURE 49 OCULUS (FACEBOOK TECHNOLOGIES, LLC.) : FINANCIAL OVERVIEW SNAPSHOT
      123. FIGURE 50 OCULUS (FACEBOOK TECHNOLOGIES, LLC.) : SWOT ANALYSIS
      124. FIGURE 51 SAMSUNG GROUP: FINANCIAL OVERVIEW SNAPSHOT
      125. FIGURE 52 SAMSUNG GROUP: SWOT ANALYSIS
      126. FIGURE 53 SONY CORPORATION: FINANCIAL OVERVIEW SNAPSHOT
      127. FIGURE 54 SONY CORPORATION: SWOT ANALYSIS
      128. FIGURE 55 UNITY SOFTWARE INC. : FINANCIAL OVERVIEW SNAPSHOT
      129. FIGURE 56 UNITY SOFTWARE INC. : SWOT ANALYSIS
      130. FIGURE 57 VARJO TECHNOLOGIES OY: FINANCIAL OVERVIEW SNAPSHOT
      131. FIGURE 58 VARJO TECHNOLOGIES OY: SWOT ANALYSIS
      132. FIGURE 59 VI-GRADE GMBH: FINANCIAL OVERVIEW SNAPSHOT
      133. FIGURE 60 VI-GRADE GMBH: SWOT ANALYSIS
      134. FIGURE 61 ZEALITY INC. : FINANCIAL OVERVIEW SNAPSHOT
      135. FIGURE 62 ZEALITY INC. : SWOT ANALYSIS

    Immersive Technology in Entertainment Market Segmentation

    Immersive Technology in Entertainment Industry Component Outlook (USD Billion, 2018-2032)

    • Hardware

      • Head-Mounted Display (HMD)
      • Gesture Tracking Devices (GTD)
      • Projectors & Display Walls (PDW)
    • Software/Platform
    • Services

      • Professional
      • Managed

    Immersive Technology in Entertainment Industry Technology Outlook (USD Billion, 2018-2032)

    • Mixed Reality (MR)
    • Virtual Reality (VR)
    • Augmented Reality (AR)
    • 360 Film

    Immersive Technology in Entertainment Industry Application Outlook (USD Billion, 2018-2032)

    • Training & Learning
    • Emergency Services
    • Product Development
    • Sales & Marketing

    Immersive Technology in Entertainment Industry Regional Outlook (USD Billion, 2018-2032)

    • North America Outlook (USD Billion, 2018-2032)

      • Immersive Technology in Entertainment Industry by Component
        • Hardware

          • Head-Mounted Display (HMD)
          • Gesture Tracking Devices (GTD)
          • Projectors & Display Walls (PDW)
        • Software/Platform
        • Services

          • Professional
          • Managed
      • Immersive Technology in Entertainment Industry by Technology
        • Mixed Reality (MR)
        • Virtual Reality (VR)
        • Augmented Reality (AR)
        • 360 Film
      • Immersive Technology in Entertainment Industry by Application
        • Training & Learning
        • Emergency Services
        • Product Development
        • Sales & Marketing
      • US Outlook (USD Billion, 2018-2032)

      • Immersive Technology in Entertainment Industry by Component
        • Hardware

          • Head-Mounted Display (HMD)
          • Gesture Tracking Devices (GTD)
          • Projectors & Display Walls (PDW)
        • Software/Platform
        • Services

          • Professional
          • Managed
      • Immersive Technology in Entertainment Industry by Technology
        • Mixed Reality (MR)
        • Virtual Reality (VR)
        • Augmented Reality (AR)
        • 360 Film
      • Immersive Technology in Entertainment Industry by Application
        • Training & Learning
        • Emergency Services
        • Product Development
        • Sales & Marketing
      • Canada Outlook (USD Billion, 2018-2032)

      • Immersive Technology in Entertainment Industry by Component
        • Hardware

          • Head-Mounted Display (HMD)
          • Gesture Tracking Devices (GTD)
          • Projectors & Display Walls (PDW)
        • Software/Platform
        • Services

          • Professional
          • Managed
      • Immersive Technology in Entertainment Industry by Technology
        • Mixed Reality (MR)
        • Virtual Reality (VR)
        • Augmented Reality (AR)
        • 360 Film
      • Immersive Technology in Entertainment Industry by Application
        • Training & Learning
        • Emergency Services
        • Product Development
        • Sales & Marketing
    • Europe Outlook (USD Billion, 2018-2032)

      • Immersive Technology in Entertainment Industry by Component
        • Hardware

          • Head-Mounted Display (HMD)
          • Gesture Tracking Devices (GTD)
          • Projectors & Display Walls (PDW)
        • Software/Platform
        • Services

          • Professional
          • Managed
      • Immersive Technology in Entertainment Industry by Technology
        • Mixed Reality (MR)
        • Virtual Reality (VR)
        • Augmented Reality (AR)
        • 360 Film
      • Immersive Technology in Entertainment Industry by Application
        • Training & Learning
        • Emergency Services
        • Product Development
        • Sales & Marketing
      • Germany Outlook (USD Billion, 2018-2032)

      • Immersive Technology in Entertainment Industry by Component
        • Hardware

          • Head-Mounted Display (HMD)
          • Gesture Tracking Devices (GTD)
          • Projectors & Display Walls (PDW)
        • Software/Platform
        • Services

          • Professional
          • Managed
      • Immersive Technology in Entertainment Industry by Technology
        • Mixed Reality (MR)
        • Virtual Reality (VR)
        • Augmented Reality (AR)
        • 360 Film
      • Immersive Technology in Entertainment Industry by Application
        • Training & Learning
        • Emergency Services
        • Product Development
        • Sales & Marketing
      • France Outlook (USD Billion, 2018-2032)

      • Immersive Technology in Entertainment Industry by Component
        • Hardware

          • Head-Mounted Display (HMD)
          • Gesture Tracking Devices (GTD)
          • Projectors & Display Walls (PDW)
        • Software/Platform
        • Services

          • Professional
          • Managed
      • Immersive Technology in Entertainment Industry by Technology
        • Mixed Reality (MR)
        • Virtual Reality (VR)
        • Augmented Reality (AR)
        • 360 Film
      • Immersive Technology in Entertainment Industry by Application
        • Training & Learning
        • Emergency Services
        • Product Development
        • Sales & Marketing
      • UK Outlook (USD Billion, 2018-2032)

      • Immersive Technology in Entertainment Industry by Component
        • Hardware

          • Head-Mounted Display (HMD)
          • Gesture Tracking Devices (GTD)
          • Projectors & Display Walls (PDW)
        • Software/Platform
        • Services

          • Professional
          • Managed
      • Immersive Technology in Entertainment Industry by Technology
        • Mixed Reality (MR)
        • Virtual Reality (VR)
        • Augmented Reality (AR)
        • 360 Film
      • Immersive Technology in Entertainment Industry by Application
        • Training & Learning
        • Emergency Services
        • Product Development
        • Sales & Marketing
      • Italy Outlook (USD Billion, 2018-2032)

      • Immersive Technology in Entertainment Industry by Component
        • Hardware

          • Head-Mounted Display (HMD)
          • Gesture Tracking Devices (GTD)
          • Projectors & Display Walls (PDW)
        • Software/Platform
        • Services

          • Professional
          • Managed
      • Immersive Technology in Entertainment Industry by Technology
        • Mixed Reality (MR)
        • Virtual Reality (VR)
        • Augmented Reality (AR)
        • 360 Film
      • Immersive Technology in Entertainment Industry by Application
        • Training & Learning
        • Emergency Services
        • Product Development
        • Sales & Marketing
      • Spain Outlook (USD Billion, 2018-2032)

      • Immersive Technology in Entertainment Industry by Component
        • Hardware

          • Head-Mounted Display (HMD)
          • Gesture Tracking Devices (GTD)
          • Projectors & Display Walls (PDW)
        • Software/Platform
        • Services

          • Professional
          • Managed
      • Immersive Technology in Entertainment Industry by Technology
        • Mixed Reality (MR)
        • Virtual Reality (VR)
        • Augmented Reality (AR)
        • 360 Film
      • Immersive Technology in Entertainment Industry by Application
        • Training & Learning
        • Emergency Services
        • Product Development
        • Sales & Marketing
      • Rest Of Europe Outlook (USD Billion, 2018-2032)

      • Immersive Technology in Entertainment Industry by Component
        • Hardware

          • Head-Mounted Display (HMD)
          • Gesture Tracking Devices (GTD)
          • Projectors & Display Walls (PDW)
        • Software/Platform
        • Services

          • Professional
          • Managed
      • Immersive Technology in Entertainment Industry by Technology
        • Mixed Reality (MR)
        • Virtual Reality (VR)
        • Augmented Reality (AR)
        • 360 Film
      • Immersive Technology in Entertainment Industry by Application
        • Training & Learning
        • Emergency Services
        • Product Development
        • Sales & Marketing
    • Asia-Pacific Outlook (USD Billion, 2018-2032)

      • Immersive Technology in Entertainment Industry by Component
        • Hardware

          • Head-Mounted Display (HMD)
          • Gesture Tracking Devices (GTD)
          • Projectors & Display Walls (PDW)
        • Software/Platform
        • Services

          • Professional
          • Managed
      • Immersive Technology in Entertainment Industry by Technology
        • Mixed Reality (MR)
        • Virtual Reality (VR)
        • Augmented Reality (AR)
        • 360 Film
      • Immersive Technology in Entertainment Industry by Application
        • Training & Learning
        • Emergency Services
        • Product Development
        • Sales & Marketing
      • China Outlook (USD Billion, 2018-2032)

      • Immersive Technology in Entertainment Industry by Component
        • Hardware

          • Head-Mounted Display (HMD)
          • Gesture Tracking Devices (GTD)
          • Projectors & Display Walls (PDW)
        • Software/Platform
        • Services

          • Professional
          • Managed
      • Immersive Technology in Entertainment Industry by Technology
        • Mixed Reality (MR)
        • Virtual Reality (VR)
        • Augmented Reality (AR)
        • 360 Film
      • Immersive Technology in Entertainment Industry by Application
        • Training & Learning
        • Emergency Services
        • Product Development
        • Sales & Marketing
      • Japan Outlook (USD Billion, 2018-2032)

      • Immersive Technology in Entertainment Industry by Component
        • Hardware

          • Head-Mounted Display (HMD)
          • Gesture Tracking Devices (GTD)
          • Projectors & Display Walls (PDW)
        • Software/Platform
        • Services

          • Professional
          • Managed
      • Immersive Technology in Entertainment Industry by Technology
        • Mixed Reality (MR)
        • Virtual Reality (VR)
        • Augmented Reality (AR)
        • 360 Film
      • Immersive Technology in Entertainment Industry by Application
        • Training & Learning
        • Emergency Services
        • Product Development
        • Sales & Marketing
      • India Outlook (USD Billion, 2018-2032)

      • Immersive Technology in Entertainment Industry by Component
        • Hardware

          • Head-Mounted Display (HMD)
          • Gesture Tracking Devices (GTD)
          • Projectors & Display Walls (PDW)
        • Software/Platform
        • Services

          • Professional
          • Managed
      • Immersive Technology in Entertainment Industry by Technology
        • Mixed Reality (MR)
        • Virtual Reality (VR)
        • Augmented Reality (AR)
        • 360 Film
      • Immersive Technology in Entertainment Industry by Application
        • Training & Learning
        • Emergency Services
        • Product Development
        • Sales & Marketing
      • Australia Outlook (USD Billion, 2018-2032)

      • Immersive Technology in Entertainment Industry by Component
        • Hardware

          • Head-Mounted Display (HMD)
          • Gesture Tracking Devices (GTD)
          • Projectors & Display Walls (PDW)
        • Software/Platform
        • Services

          • Professional
          • Managed
      • Immersive Technology in Entertainment Industry by Technology
        • Mixed Reality (MR)
        • Virtual Reality (VR)
        • Augmented Reality (AR)
        • 360 Film
      • Immersive Technology in Entertainment Industry by Application
        • Training & Learning
        • Emergency Services
        • Product Development
        • Sales & Marketing
      • Rest of Asia-Pacific Outlook (USD Billion, 2018-2032)

      • Immersive Technology in Entertainment Industry by Component
        • Hardware

          • Head-Mounted Display (HMD)
          • Gesture Tracking Devices (GTD)
          • Projectors & Display Walls (PDW)
        • Software/Platform
        • Services

          • Professional
          • Managed
      • Immersive Technology in Entertainment Industry by Technology
        • Mixed Reality (MR)
        • Virtual Reality (VR)
        • Augmented Reality (AR)
        • 360 Film
      • Immersive Technology in Entertainment Industry by Application
        • Training & Learning
        • Emergency Services
        • Product Development
        • Sales & Marketing
    • Rest of the World Outlook (USD Billion, 2018-2032)

      • Immersive Technology in Entertainment Industry by Component
        • Hardware

          • Head-Mounted Display (HMD)
          • Gesture Tracking Devices (GTD)
          • Projectors & Display Walls (PDW)
        • Software/Platform
        • Services

          • Professional
          • Managed
      • Immersive Technology in Entertainment Industry by Technology
        • Mixed Reality (MR)
        • Virtual Reality (VR)
        • Augmented Reality (AR)
        • 360 Film
      • Immersive Technology in Entertainment Industry by Application
        • Training & Learning
        • Emergency Services
        • Product Development
        • Sales & Marketing
      • Middle East Outlook (USD Billion, 2018-2032)

      • Immersive Technology in Entertainment Industry by Component
        • Hardware

          • Head-Mounted Display (HMD)
          • Gesture Tracking Devices (GTD)
          • Projectors & Display Walls (PDW)
        • Software/Platform
        • Services

          • Professional
          • Managed
      • Immersive Technology in Entertainment Industry by Technology
        • Mixed Reality (MR)
        • Virtual Reality (VR)
        • Augmented Reality (AR)
        • 360 Film
      • Immersive Technology in Entertainment Industry by Application
        • Training & Learning
        • Emergency Services
        • Product Development
        • Sales & Marketing
      • Africa Outlook (USD Billion, 2018-2032)

      • Immersive Technology in Entertainment Industry by Component
        • Hardware

          • Head-Mounted Display (HMD)
          • Gesture Tracking Devices (GTD)
          • Projectors & Display Walls (PDW)
        • Software/Platform
        • Services

          • Professional
          • Managed
      • Immersive Technology in Entertainment Industry by Technology
        • Mixed Reality (MR)
        • Virtual Reality (VR)
        • Augmented Reality (AR)
        • 360 Film
      • Immersive Technology in Entertainment Industry by Application
        • Training & Learning
        • Emergency Services
        • Product Development
        • Sales & Marketing
      • Latin America Outlook (USD Billion, 2018-2032)

      • Immersive Technology in Entertainment Industry by Component
        • Hardware

          • Head-Mounted Display (HMD)
          • Gesture Tracking Devices (GTD)
          • Projectors & Display Walls (PDW)
        • Software/Platform
        • Services

          • Professional
          • Managed
      • Immersive Technology in Entertainment Industry by Technology
        • Mixed Reality (MR)
        • Virtual Reality (VR)
        • Augmented Reality (AR)
        • 360 Film
      • Immersive Technology in Entertainment Industry by Application
        • Training & Learning
        • Emergency Services
        • Product Development
        • Sales & Marketing
    Infographic

    Free Sample Request

    Kindly complete the form below to receive a free sample of this Report

    Get Free Sample

    Customer Strories

    “I am very pleased with how market segments have been defined in a relevant way for my purposes (such as "Portable Freezers & refrigerators" and "last-mile"). In general the report is well structured. Thanks very much for your efforts.”

    Victoria Milne

    Founder
    Case Study
    Chemicals and Materials