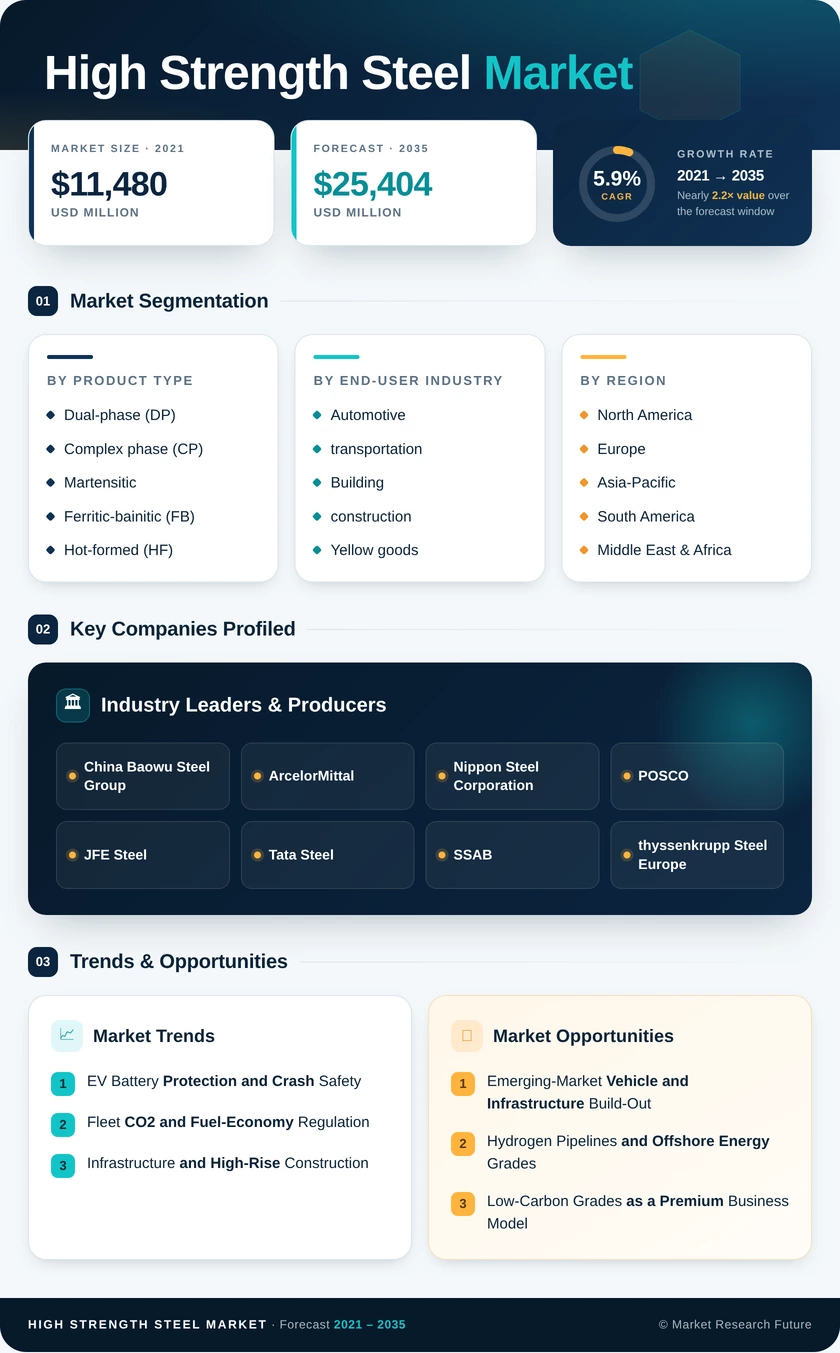
High Strength Steel Market (2026 - 2035)

ID: MRFR/CnM/4183-HCR 140 Pages Anshula Mandaokar Last Updated: November 16, 2026
High Strength Steel Market Research Report Information By Product Type (Dual-Phase (DP), Complex Phase (CP), Martensitic, Ferritic-Bainitic (FB), Hot-Formed (HF), and Other Product Types), By End-User Industry (Automotive and Transportation, Building and Construction, Yellow Goods and Mining, Aerospace and Defense, and Other End-User Industries), And By Region (North America, Europe, Asia-Pacific, and Rest of the World) – Market Forecast Till 2035.
High Strength Steel Market
Market Size
Forecast Period2026-2035
CAGR (2026-2035)5.9%
2025 Market SizeUSD 14,320 Million
2035 Market SizeUSD 25,404 Million
Key Players
China Baowu Steel Group
ArcelorMittal
Nippon Steel Corporation
POSCO
JFE Steel
Tata Steel
Opportunities
  • Emerging-Market Vehicle and Infrastructure Build-Out
  • Hydrogen Pipelines and Offshore Energy Grades
  • Low-Carbon Grades as a Premium Business Model
  1. 1 Market Summary | |
  2. 2 Key Report Takeaways | |
    1. 2.1 By Product Type | |
    2. 2.2 By End-user Industry | |
    3. 2.3 By Region | |
  3. 3 Market Size and Forecast (2021–2035) | |
    1. 3.1 Historical Market Size (2021–2024) | |
    2. 3.2 Base Year and Forecast Market Size (2025–2035) | |
    3. 3.3 Year-over-Year Growth Analysis | |
  4. 4 Driver Impact Analysis | |
    1. 4.1 EV Battery Protection and Crash Safety | |
    2. 4.2 Fleet CO2 and Fuel-Economy Regulation | |
    3. 4.3 Infrastructure and High-Rise Construction | |
    4. 4.4 Offshore Wind and Energy Structures | |
    5. 4.5 Mining and Yellow-Goods Fleet Renewal | |
    6. 4.6 Steel Decarbonization Favoring Higher Grades | |
    7. 4.7 Vehicle Production Localization in Asia | |
  5. 5 Restraints Impact Analysis | |
    1. 5.1 High Processing and Tooling Costs | |
    2. 5.2 Substitution by Aluminum and Large Castings | |
    3. 5.3 Tariffs and Carbon-Border Measures | |
    4. 5.4 Alloying-Element Price and Supply Risk | |
    5. 5.5 Weldability and Embrittlement Qualification | |
  6. 6 Opportunities | |
    1. 6.1 Emerging-Market Vehicle and Infrastructure Build-Out | |
    2. 6.2 Hydrogen Pipelines and Offshore Energy Grades | |
    3. 6.3 Low-Carbon Grades as a Premium Business Model | |
    4. 6.4 Material Data Services and Digital Passports | |
    5. 6.5 Third-Generation Grades for One-Piece Structures | |
  7. 7 Regional Market Share and Country-Level Analysis | |
    1. 7.1 North America | | |
      1. 7.1.1 US | | |
      2. 7.1.2 Canada | | |
      3. 7.1.3 Mexico | |
    2. 7.2 Europe | | |
      1. 7.2.1 Germany | | |
      2. 7.2.2 UK | | |
      3. 7.2.3 France | | |
      4. 7.2.4 Italy | | |
      5. 7.2.5 Spain | | |
      6. 7.2.6 Nordic Countries | | |
      7. 7.2.7 Russia | | |
      8. 7.2.8 Rest of Europe | |
    3. 7.3 Asia-Pacific | | |
      1. 7.3.1 China | | |
      2. 7.3.2 India | | |
      3. 7.3.3 Japan | | |
      4. 7.3.4 South Korea | | |
      5. 7.3.5 ASEAN | | |
      6. 7.3.6 Rest of Asia-Pacific | |
    4. 7.4 South America | | |
      1. 7.4.1 Brazil | | |
      2. 7.4.2 Argentina | | |
      3. 7.4.3 Rest of South America | |
    5. 7.5 Middle East & Africa | | |
      1. 7.5.1 Saudi Arabia | | |
      2. 7.5.2 UAE | | |
      3. 7.5.3 South Africa | | |
      4. 7.5.4 Egypt | | |
      5. 7.5.5 Rest of MEA | |
  8. 8 Future Outlook (2026–2035) | |
    1. 8.1 AI-Driven Process Control | |
    2. 8.2 Electrification Supercycle | |
    3. 8.3 Carbon Accounting and Low-Emission Steel | |
    4. 8.4 Regionalized Supply Chains | |
  9. 9 Segmentation Analysis | |
    1. 9.1 By Product Type | | |
      1. 9.1.1 Dual-phase (DP) | | |
      2. 9.1.2 Complex phase (CP) | | |
      3. 9.1.3 Martensitic | | |
      4. 9.1.4 Ferritic-bainitic (FB) | | |
      5. 9.1.5 Hot-formed (HF) | | |
      6. 9.1.6 Other product types | |
    2. 9.2 By End-user Industry | | |
      1. 9.2.1 Automotive and transportation | | |
      2. 9.2.2 Building and construction | | |
      3. 9.2.3 Yellow goods and mining | | |
      4. 9.2.4 Aerospace and defense | | |
      5. 9.2.5 Other end-user industries | |
  10. 10 Competitive Landscape | |
    1. 10.1 Market Concentration Analysis | |
    2. 10.2 Competitive Benchmarking Matrix | |
    3. 10.3 Company Profiles | | |
      1. 10.3.1 China Baowu Steel Group | | |
      2. 10.3.2 ArcelorMittal | | |
      3. 10.3.3 Nippon Steel Corporation | | |
      4. 10.3.4 POSCO | | |
      5. 10.3.5 JFE Steel | | |
      6. 10.3.6 Tata Steel | | |
      7. 10.3.7 SSAB | | |
      8. 10.3.8 thyssenkrupp Steel Europe | | |
      9. 10.3.9 voestalpine | | |
      10. 10.3.10 Nucor | | |
      11. 10.3.11 Cleveland-Cliffs | | |
      12. 10.3.12 Steel Dynamics | |
  11. 11 Recent News & Developments | |
  12. 12 Report Scope and Methodology | |
  13. 13 Detailed Sources and Citations | |
  14. 14 Frequently Asked Questions (FAQs) | | LIST OF TABLES | |
  15. TABLE 1 Global Market Size & Forecast, by Revenue (USD Million), 2021–2035 | |
  16. TABLE 2 Driver Impact Analysis | |
  17. TABLE 3 Restraints Impact Analysis | |
  18. TABLE 4 Regional Summary, 2025 | |
  19. TABLE 5 North America Market, by Country, 2025 | |
  20. TABLE 6 Europe Market, by Country, 2025 | |
  21. TABLE 7 Asia-Pacific Market, by Country, 2025 | |
  22. TABLE 8 South America Market, by Country, 2025 | |
  23. TABLE 9 Middle East & Africa Market, by Country, 2025 | |
  24. TABLE 10 Global Market, by Product Type, 2025 | |
  25. TABLE 11 Global Market, by End-user Industry, 2025 | |
  26. TABLE 12 Competitive Benchmarking Matrix | |
  27. TABLE 13 Report Scope and Methodology | |
  28. TABLE 14 Detailed Sources and Citations | |
  29. TABLE 15 Segmentation Quick Reference | | LIST OF FIGURES | |
  30. FIGURE 1 Market Dynamics Overview (Drivers, Restraints, Opportunities) | |
  31. FIGURE 2 Industry Value Chain Analysis | |
  32. FIGURE 3 Porter's Five Forces Analysis | |
  33. FIGURE 4 Global Market Size Trend, 2021–2035 (USD Million) | |
  34. FIGURE 5 Market Share, by Product Type, 2025 (%) | |
  35. FIGURE 6 Market Share, by End-user Industry, 2025 (%) | |
  36. FIGURE 7 Market Share, by Region, 2025 (%) | |
  37. FIGURE 8 Country-Level Market Comparison, 2025 | |
  38. FIGURE 9 Competitive Landscape: Estimated Revenue Share Ranges of Key Players

Segmentation Quick Reference

DimensionSub-SegmentsDominant SegmentFastest Growing Segment
By Product TypeDual-phase (DP); Complex phase (CP); Martensitic; Ferritic-bainitic (FB); Hot-formed (HF); Other product typesDual-phase (DP) (27.0% share)Hot-formed (HF) (7.1% CAGR)
By End-user IndustryAutomotive and transportation; Building and construction; Yellow goods and mining; Aerospace and defense; Other end-user industriesAutomotive and transportation (46.2% share)Other end-user industries (6.4% CAGR)
By RegionNorth America; Europe; Asia-Pacific; South America; Middle East & AfricaAsia-Pacific (52.4% share)Asia-Pacific (52.4% share)

Market Segmentation Overview

By Product Type

Sub-SegmentKey Trend
Dual-phase (DP)Higher-strength DP 980 and DP 1180 replacing DP 590 in sills and cross-members
Complex phase (CP)Rising use in suspension arms that need high hole-expansion ratios
MartensiticRoll-formed bumper and intrusion beams above 1,500 MPa
Ferritic-bainitic (FB)Weldable chassis rails and wheels for heavy trucks
Hot-formed (HF)Battery enclosures and laser-welded one-piece door rings
Other product typesQuenched and partitioned (Q&P) steel moving from pilot to commercial lines

Dual-phase (DP) remains the leading product type because it forms well in complex stampings while meeting most crash targets at moderate cost. Hot-formed (HF) grows fastest, since electric-vehicle battery protection and door-ring designs need strengths above 1,500 MPa that cold forming cannot reach. Complex phase (CP) and ferritic-bainitic (FB) hold steady in chassis applications, while Q&P under other product types is positioned to take share in one-piece body structures.

By End-user Industry

Sub-SegmentKey Trend
Automotive and transportationMore advanced grades per vehicle as EV battery mass rises
Building and constructionHigh-yield columns and bridge sections reducing dead load
Yellow goods and mining400–500 HBW wear plate for larger buckets and truck bodies
Aerospace and defenseUltra-high-strength bar for landing gear and armor
Other end-user industriesOffshore-wind towers and hydrogen-ready line pipe

Automotive and transportation lead by a wide margin because fleet-emission rules and battery-pack crash protection push advanced sheet into nearly every body structure. Other end-user industries grow fastest, as renewable-energy developers specify fatigue- and embrittlement-resistant plate for offshore towers and hydrogen pipelines. Building and construction and yellow goods and mining provide steady volume, while aerospace and defense remain small but high-value.


Download PDF ×

We do not share your information with anyone. However, we may send you emails based on your report interest from time to time. You may contact us at any time to opt-out.