Segmentation Quick Reference
| Dimension | Sub-Segments | Dominant Segment | Fastest Growing Segment |
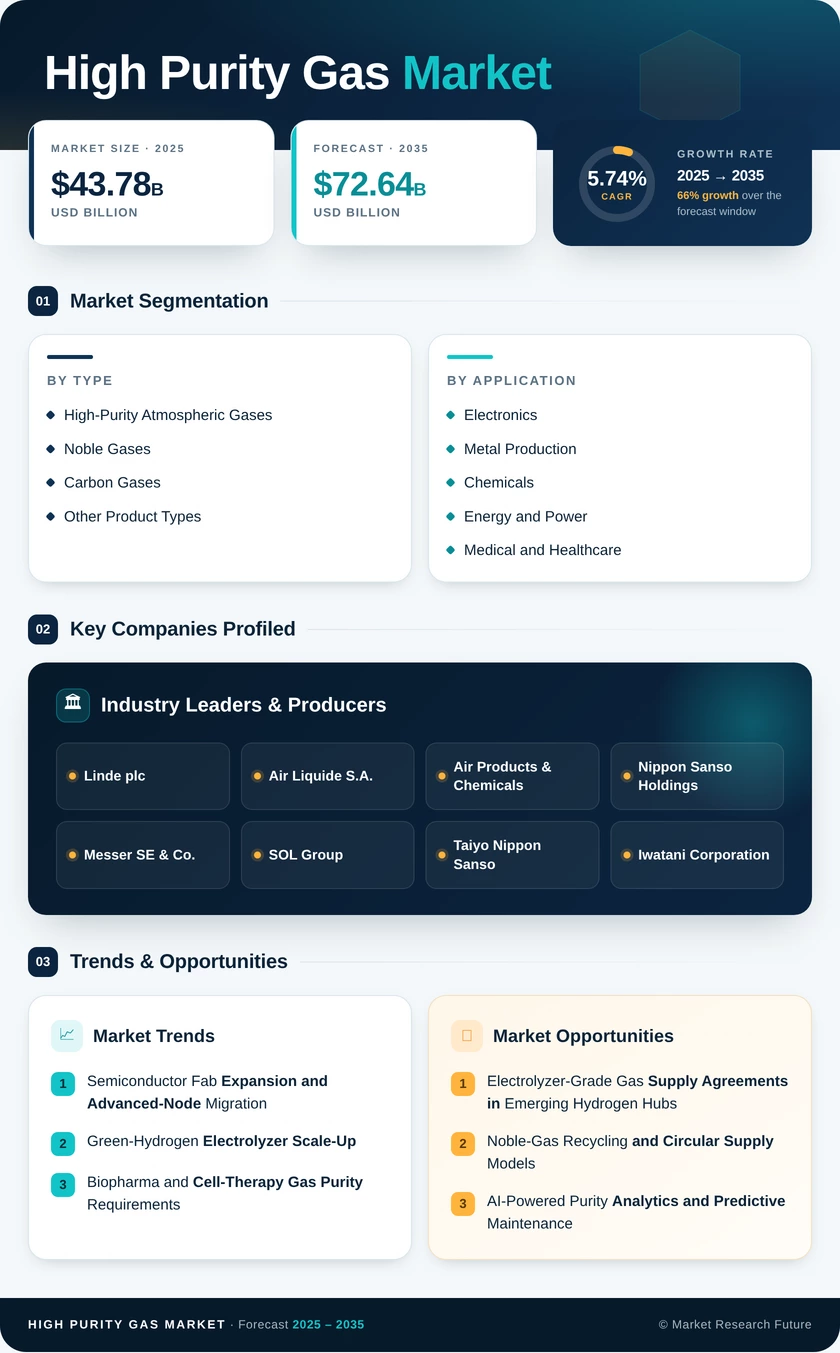
| Product Type | High-Purity Atmospheric Gases, Noble Gases, Carbon Gases, Other Product Types | High-Purity Atmospheric Gases | Noble Gases |
| Application | Insulation, Lighting, Coolant, Other Applications | Insulation | Coolant |
| End-User Industry | Electronics, Metal Production, Chemicals, Energy and Power, Medical and High Purity Gas Market, Other End-User Industries | Electronics | Medical and High Purity Gas Market |
| Region | Asia-Pacific, North America, Europe, South America, the Middle East & Africa | Asia-Pacific | Middle East & Africa |
Market Segmentation Overview
By Product Type
| Sub-Segment | Key Trend |
| High-Purity Atmospheric Gases | Volume-driven demand from semiconductor and electrolyzer feedstock; mature but stable growth |
| Noble Gases | Helium and neon supply constraints are driving recycling investment, the highest CAGR in the product category. |
| Carbon Gases | CO₂ purification for food-grade and analytical applications; steady mid-single-digit growth |
| Other Product Types | Specialty blends and fluorinated gases for switchgear and etching; niche but expanding |
High-purity atmospheric gases — nitrogen, oxygen, and argon — anchor the product landscape through sheer volume. Noble gases are emerging as the strategic growth category, with supply-security investments reshaping procurement models across the semiconductor and healthcare sectors.
By Application
| Sub-Segment | Key Trend |
| Insulation | SF₆ phase-down accelerating demand for high-purity alternative gas blends |
| Lighting | Transition to LED reducing traditional noble-gas fill demand; offset by specialty applications. |
| Coolant | MRI cryogenics and AI data-center liquid cooling are driving rapid expansion |
| Other Applications | Analytical, calibration, and laboratory use cases maintaining steady demand. |
Insulation remains the largest application by revenue share, though coolant applications are gaining ground rapidly as quantum computing and hyperscale data centers scale their cryogenic and immersion-cooling infrastructure.
By End-User Industry
| Sub-Segment | Key Trend |
| Electronics | Advanced-node migration is increasing per-wafer gas consumption; the dominant end-user |
| Metal Production | Green-steel initiatives are boosting demand for high-purity oxygen and argon. |
| Chemicals | Process inerting and specialty synthesis driving stable consumption |
| Energy and Power | Electrolyzer scale-up creating a structural demand step-change |
| Medical and High Purity Gas Market | Cell-and-gene-therapy manufacturing upgrading gas purity specifications. |
| Other End-User Industries | Food processing, aerospace, and academic R&D maintain diversified demand. |
Electronics leads the end-user landscape through the semiconductor industry's expanding fab footprint. Medical and healthcare is the fastest-growing vertical, powered by the cell-and-gene-therapy manufacturing boom and tightening pharmaceutical gas standards across regulated markets.