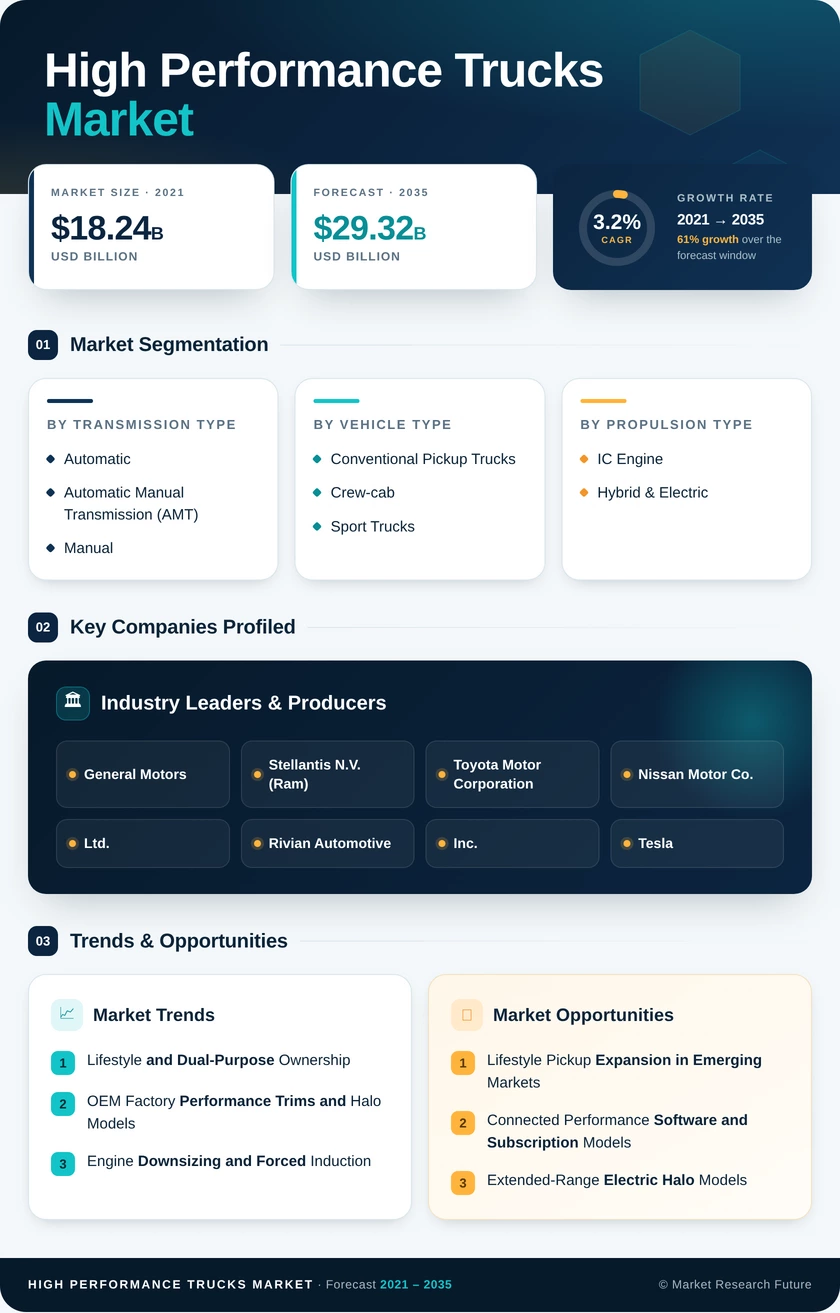
High-Performance Trucks Market (2026 - 2035)

ID: MRFR/AT/4109-CR 188 Pages Triveni Bhoyar Last Updated: October 07, 2026
High-Performance Trucks Market Research Report By Transmission Type (Automatic, Automatic Manual Transmission (AMT), Manual), By Vehicle Type (Conventional Pickup Trucks, Crew-cab, Sport Trucks), By Propulsion Type (IC Engine, Hybrid & Electric) - Forecast to 2035
High-Performance Trucks Market
Market Size
Forecast Period2026-2035
CAGR (2026-2035)3.2%
2025 Market SizeUSD 21.40 Billion
2035 Market SizeUSD 29.32 Billion
Key Players
General Motors
Stellantis N.V.
Toyota Motor Corporation
Nissan Motor Co., Ltd.
Rivian Automotive, Inc.
Tesla, Inc.
Opportunities
  • Lifestyle Pickup Expansion in Emerging Markets
  • Connected Performance Software and Subscription Models
  • Extended-Range Electric Halo Models
  1. 1 Market Summary | |
  2. 2 Key Report Takeaways | |
    1. 2.1 By Transmission Type | |
    2. 2.2 By Vehicle Type | |
    3. 2.3 By Propulsion Type | |
    4. 2.4 By Region | |
  3. 3 Market Size and Forecast (2021–2035) | |
  4. 4 Driver Impact Analysis | |
    1. 4.1 Lifestyle and Dual-Purpose Ownership | |
    2. 4.2 OEM Factory Performance Trims and Halo Models | |
    3. 4.3 Engine Downsizing and Forced Induction | |
    4. 4.4 Electrified Performance Powertrains | |
    5. 4.5 Pickup Policy Liberalization in Asia Pacific | |
    6. 4.6 Aftermarket and Factory-Backed Parts Ecosystems | |
  5. 5 Restraints Impact Analysis | |
    1. 5.1 High Acquisition Cost and Affordability Pressure | |
    2. 5.2 Tightening Emissions and CO2 Regulations | |
    3. 5.3 Trade Tariffs and Supply-Chain Cost Inflation | |
    4. 5.4 Withdrawal of EV Purchase Incentives | |
    5. 5.5 Fuel Price Volatility and Running Costs | |
  6. 6 Opportunities | |
    1. 6.1 Lifestyle Pickup Expansion in Emerging Markets | |
    2. 6.2 Connected Performance Software and Subscription Models | |
    3. 6.3 Extended-Range Electric Halo Models | |
    4. 6.4 Factory-Certified Tuning and Upfit Packages | |
  7. 7 Regional Market Share and Country-Level Analysis | |
    1. 7.1 North America | | |
      1. 7.1.1 United States | | |
      2. 7.1.2 Canada | | |
      3. 7.1.3 Rest of North America | |
    2. 7.2 Europe | | |
      1. 7.2.1 Germany | | |
      2. 7.2.2 United Kingdom | | |
      3. 7.2.3 France | | |
      4. 7.2.4 Rest of Europe | |
    3. 7.3 Asia Pacific | | |
      1. 7.3.1 India | | |
      2. 7.3.2 China | | |
      3. 7.3.3 Japan | | |
      4. 7.3.4 South Korea | | |
      5. 7.3.5 Rest of Asia-Pacific | |
    4. 7.4 Rest of the World | | |
      1. 7.4.1 Mexico | | |
      2. 7.4.2 United Arab Emirates | | |
      3. 7.4.3 Other Countries | |
  8. 8 Future Outlook (2026–2035) | |
    1. 8.1 Electrification and Extended-Range Powertrains | |
    2. 8.2 Software-Defined Trucks and Over-the-Air Tuning | |
    3. 8.3 Driver Assistance and Off-Road Automation | |
    4. 8.4 Lightweighting and Sustainability Reporting | |
  9. 9 Segmentation Analysis | |
    1. 9.1 By Transmission Type | | |
      1. 9.1.1 Automatic | | |
      2. 9.1.2 Automatic Manual Transmission (AMT) | | |
      3. 9.1.3 Manual | |
    2. 9.2 By Vehicle Type | | |
      1. 9.2.1 Conventional Pickup Trucks | | |
      2. 9.2.2 Crew-cab | | |
      3. 9.2.3 Sport Trucks | |
    3. 9.3 By Propulsion Type | | |
      1. 9.3.1 IC Engine | | |
      2. 9.3.2 Hybrid & Electric | |
  10. 10 Competitive Landscape | |
  11. 11 Recent News & Developments | |
  12. 12 Report Scope and Methodology | |
  13. 13 Detailed Sources and Citations | |
  14. 14 Frequently Asked Questions (FAQs) | | LIST OF TABLES | |
  15. TABLE 1 Report Snapshot – Key Market Metrics, 2025–2035 | |
  16. TABLE 2 Global Market Size and Forecast, 2021–2035 (USD Billion) | |
  17. TABLE 3 Driver Impact Analysis | |
  18. TABLE 4 Restraints Impact Analysis | |
  19. TABLE 5 Regional Summary, 2025 | |
  20. TABLE 6 North America – Country-Level Analysis | |
  21. TABLE 7 Europe – Country-Level Analysis | |
  22. TABLE 8 Asia Pacific – Country-Level Analysis | |
  23. TABLE 9 Rest of the World – Country-Level Analysis | |
  24. TABLE 10 Segmentation by Transmission Type | |
  25. TABLE 11 Segmentation by Vehicle Type | |
  26. TABLE 12 Segmentation by Propulsion Type | |
  27. TABLE 13 Competitive Benchmarking Matrix | |
  28. TABLE 14 Report Scope and Methodology | |
  29. TABLE 15 Detailed Sources and Citations | |
  30. TABLE 16 Segmentation Quick Reference | | LIST OF FIGURES | |
  31. FIGURE 1 Market Dynamics Overview – Drivers, Restraints and Opportunities | |
  32. FIGURE 2 Industry Value Chain Analysis | |
  33. FIGURE 3 Porter's Five Forces Analysis | |
  34. FIGURE 4 Global Market Size Trend, 2021–2035 (USD Billion) | |
  35. FIGURE 5 Market Share by Transmission Type, 2025 | |
  36. FIGURE 6 Market Share by Vehicle Type, 2025 | |
  37. FIGURE 7 Market Share by Propulsion Type, 2025 | |
  38. FIGURE 8 Regional Market Share, 2025 | |
  39. FIGURE 9 Country-Level Share within Each Region, 2025 | |
  40. FIGURE 10 Competitive Landscape – Estimated Revenue Share Ranges | |
  41. FIGURE 11 Competitive Positioning Matrix

Segmentation Quick Reference

DimensionSub-SegmentsDominant SegmentFastest Growing Segment
By Transmission TypeAutomatic; Automatic Manual Transmission (AMT); ManualAutomatic (71.8% share)Automatic Manual Transmission (AMT) (4.4% CAGR)
By Vehicle TypeConventional Pickup Trucks; Crew-cab; Sport TrucksConventional Pickup Trucks (USD 9.80 B)Sport Trucks (5.1% CAGR)
By Propulsion TypeIC Engine; Hybrid & ElectricIC Engine (88.7% share)Hybrid & Electric (11.8% CAGR)
By RegionNorth America; Europe; Asia Pacific; Rest of the WorldNorth America (61.4% share)Asia Pacific (4.6% CAGR)


Market Segmentation Overview

By Transmission Type

Sub-SegmentKey Trend
Automatic10-speed units standard across full-size performance trims
Automatic Manual Transmission (AMT)Automated shifting adopted in cost-sensitive Asia Pacific markets
ManualRetained in mid-size enthusiast trims but steadily shrinking


Automatic transmissions lead because supercharged and twin-turbo engines produce torque levels that conventional manuals struggle to handle, and towing buyers expect smooth launch control. Automatic Manual Transmission (AMT) grows fastest as Asia Pacific OEMs use it to offer two-pedal convenience at lower cost than torque-converter units. Manual gearboxes hold a loyal enthusiast niche, but electrification is removing them from new programs.

By Vehicle Type

Sub-SegmentKey Trend
Conventional Pickup TrucksFactory halo trims command premium pricing
Crew-cabFour-door layouts become the default family configuration
Sport TrucksCompact, street-focused models attract younger buyers


Conventional Pickup Trucks lead on revenue because flagship trims such as the Raptor R and Ram 1500 RHO sit on full-size platforms with the highest transaction prices. Sport Trucks grow fastest as compact unibody and street-tuned models offer agility and lower entry prices. Crew-cab configurations remain central, since most performance buyers now use their trucks as daily family vehicles.

By Propulsion Type

Sub-SegmentKey Trend
IC EngineDownsized, boosted engines replace naturally aspirated V8s
Hybrid & ElectricHybrid torque-fill and extended-range layouts gain traction


IC Engine models dominate because refueling convenience and long towing range still matter most to performance buyers. Hybrid & Electric trucks grow fastest as falling battery costs, instant electric torque and extended-range architectures such as the Ramcharger remove the towing-range penalty. Tightening emissions rules in Europe and North America will keep shifting new program investment toward electrified drivetrains.




Download PDF ×

We do not share your information with anyone. However, we may send you emails based on your report interest from time to time. You may contact us at any time to opt-out.