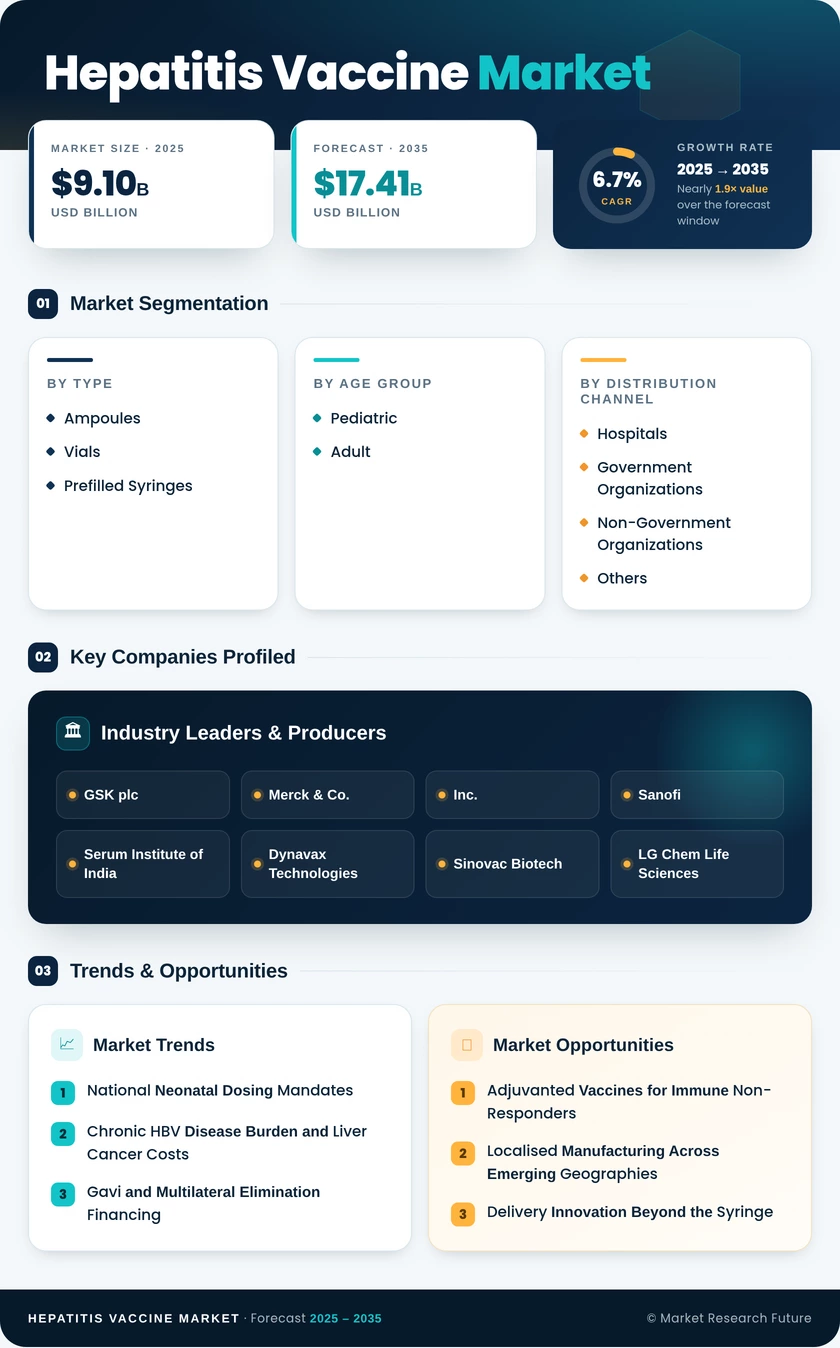
Segmentation Quick Reference
| Dimension | Sub-Segments | Dominant Segment | Fastest Growing Segment |
| By Vaccine Type | Single Antigen Vaccine; Combination Vaccine | Single Antigen Vaccine (58.5% share, 2025) | Combination Vaccine (7.8% CAGR) |
| By Age Group | Pediatric; Adult | Pediatric (USD 6.10 Billion, 2025) | Adult (7.4% CAGR) |
| By Packaging Type | Ampoules; Vials; Prefilled Syringes | Vials (USD 4.87 Billion, 2025) | Prefilled Syringes (8.6% CAGR) |
| By Distribution Channel | Hospitals; Government Organizations; Non-Government Organizations; Others | Hospitals (42.5% share, 2025) | Non-Government Organizations (7.6% CAGR) |
| By Region | North America; Europe; Asia-Pacific; South America; Middle East and Africa | North America (34.5% share) | Asia-Pacific (8.4% CAGR) |
Market Segmentation Overview
By Vaccine Type
| Sub-Segment | Key Trend |
| Single Antigen Vaccine | Sustained by mandatory birth-dose administration and adult catch-up series |
| Combination Vaccine | Hexavalent conversion consolidates the infant primary series into three injections |
Single Antigen Vaccine holds the leading position because the neonatal dose must be given as a standalone product before any combination schedule begins at six weeks. Combination Vaccine grows fastest, since each national conversion swaps several low-priced monovalent doses for one hexavalent presentation carrying a four-to-six-times price premium. European and Asian schedules are driving most of that conversion, while adult regimens keep monovalent volume structurally protected.
By Age Group
| Sub-Segment | Key Trend |
| Pediatric | Universal infant schedules guarantee three to four doses per birth cohort |
| Adult | Two-dose adjuvanted regimens make pharmacy-based completion practical |
Pediatric leads on both dose volume and absolute value, anchored by immunization schedules that ministries treat as non-discretionary. Adult compounds faster from a smaller base, following the US move to recommend vaccination for all adults aged 19 to 59 and the arrival of one-month adjuvanted regimens that resolve historic series-completion failures. Adult doses also transact at commercial prices rather than tender prices, so their value contribution outruns their share of doses administered.
By Packaging Type
| Sub-Segment | Key Trend |
| Ampoules | Gradual displacement as procurement specifications modernise |
| Vials | Multi-dose economics preferred for high-throughput clinic sessions |
| Prefilled Syringes | Adoption accelerating on wastage-reduction and dosing-accuracy grounds |
Vials remain the dominant presentation because cost per dose falls sharply when a single container serves ten or twenty recipients in one session. Prefilled Syringes grow fastest as programmes reaching dispersed rural populations weigh open-vial wastage of 10% to 30% against the higher unit cost and increasingly conclude that delivered-dose economics favour single-dose formats. Ampoules continue to erode, retained mainly where legacy filling lines and unrevised tender specifications keep them in circulation.
By Distribution Channel
| Sub-Segment | Key Trend |
| Hospitals | Facility-based births anchor perinatal dose administration |
| Government Organizations | Pooled national tenders concentrate the largest single purchase blocks |
| Non-Government Organizations | Donor-funded outreach targets districts with low facility-birth rates |
| Others | Retail pharmacy, occupational health and travel clinics expand with adult demand |
Hospitals lead the channel mix because the timely first dose is administered at the point of delivery, making facility birth rates the primary determinant of share. Government Organizations follow closely through pooled mechanisms such as the PAHO Revolving Fund and UNICEF Supply Division, which aggregate demand across dozens of countries. Non-Government Organizations grow fastest as donor programmes push into home-birth-dominant districts where the facility channel simply cannot reach the newborn in time.

 Noah Malgeri
Co-Founder
Noah Malgeri
Co-Founder

 Peter Groot koerkamp
Account and Business Manager
Peter Groot koerkamp
Account and Business Manager

 Younghwan Choi
Senior Retail Manager
Younghwan Choi
Senior Retail Manager

 Mark Irwin
Management Consultant
Mark Irwin
Management Consultant

 Akif Moroglu
Strategy & Business Development Director
Akif Moroglu
Strategy & Business Development Director

 Guilherme Gomes Martins
Product Management Director
Guilherme Gomes Martins
Product Management Director

 Joseph Aguayo
Sales Operations & Pricing Manager
Joseph Aguayo
Sales Operations & Pricing Manager

 La Terria Dodd
Program Support Specialist
La Terria Dodd
Program Support Specialist

 Rob Kooiker
Group Product Manager HVAC & Fire Protection GMA
Rob Kooiker
Group Product Manager HVAC & Fire Protection GMA