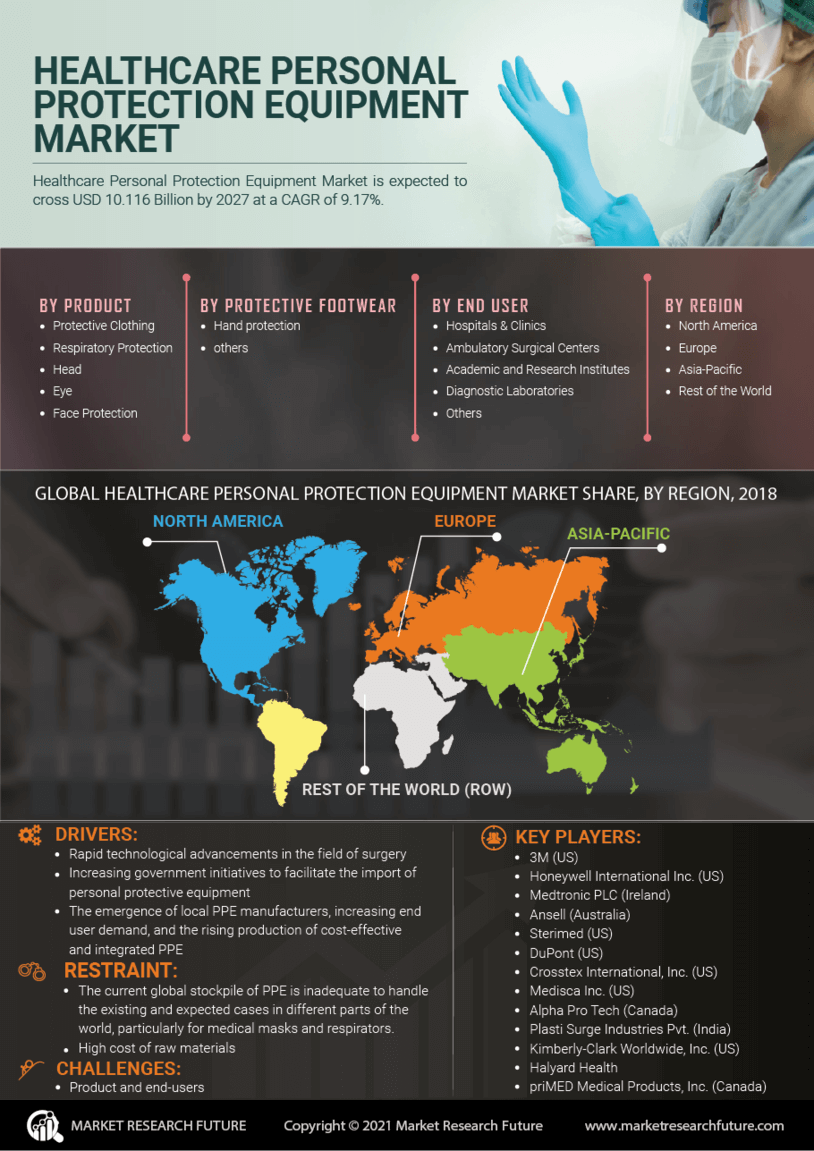
Healthcare Personal Protection Equipment Market Personal Protection Equipment Market Segmentation
Healthcare Personal Protection Equipment Market By Type (USD Billion, 2025-2035)
- Protective Clothing
- Gloves
- Face Masks
- Goggles
- Face Shields
Healthcare Personal Protection Equipment Market By End User (USD Billion, 2025-2035)
- Hospitals
- Clinics
- Long-term Care Facilities
- Home Care
- Healthcare Personal Protection Equipment Market Companies
Healthcare Personal Protection Equipment Market By Material Type (USD Billion, 2025-2035)
- Fabric
- Plastic
- Rubber
- Polypropylene
- Nitrile
Healthcare Personal Protection Equipment Market By Application (USD Billion, 2025-2035)
- Infection Control
- Hazardous Material Handling
- Surgical Procedures
- Patient Care
- Laboratory Use