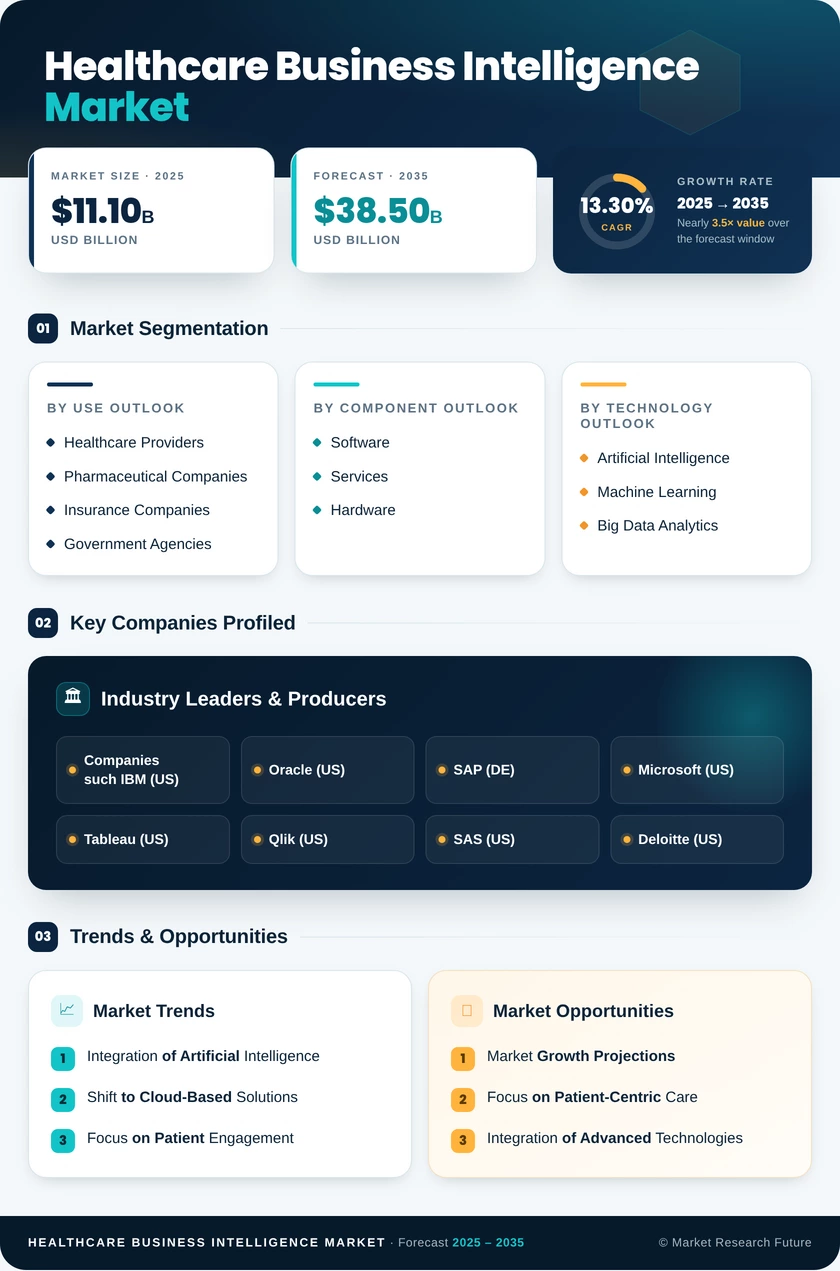
Segmentation Quick Reference
| Dimension | Sub-Segments | Dominant Segment | Fastest Growing Segment |
|---|
| By Component | Platforms; Software; Services | Software (37.8% share) | Services (15.6% CAGR) |
| By Function | OLAP & Visualisation; Performance Management; Query & Reporting; Advanced & Predictive Analytics | OLAP & Visualisation (43.9% share) | Advanced & Predictive Analytics (16.1% CAGR) |
| By Application | Clinical Analytics; Financial Analytics; Operational Analytics; Strategic Planning & Benchmarking | Clinical Analytics (38.9% share) | Operational Analytics (16.7% CAGR) |
| By End User | Healthcare Providers; Payers; Life-Science Companies; Government & Public-Health Agencies; Other End Users (ACOs, CROs) | Healthcare Providers (55.8% share) | Life-Science Companies (17.1% CAGR) |
| By Region | North America; Europe; Asia-Pacific; South America; Middle East and Africa | North America (43.5% share) | Asia-Pacific (15.6% CAGR) |
Market Segmentation Overview
| Sub-Segment | Key Trend |
|---|
| Platforms | Shift to cloud data fabrics with prebuilt clinical data models |
| Software | Generative AI assistants embedded in visualization suites |
| Services | Managed analytics and algorithm validation contracts |
Software leads the component dimension because visualization suites and analytics applications are what end users license and use daily. Services grow fastest since few providers have the in-house talent to migrate legacy data, govern models, and keep dashboards current. Platforms sit beneath both, and their value increasingly depends on how quickly they make clinical data analysis-ready.
| Sub-Segment | Key Trend |
|---|
| OLAP & Visualisation | Self-service dashboards for frontline managers |
| Performance Management | Scorecards aligned to value-based contract metrics. |
| Query & Reporting | Automated regulatory and payer submissions |
| Advanced & Predictive Analytics | Risk stratification and early-warning models in workflow |
OLAP & Visualisation dominates because hospitals depend on multidimensional views of throughput, quality, and cost for daily decisions. Advanced & Predictive Analytics grows fastest as episode-based payment rewards preventing adverse events rather than reporting them. Query & Reporting and Performance Management remain steady, anchored by fixed regulatory and contractual reporting obligations.
| Sub-Segment | Key Trend |
|---|
| Clinical Analytics | Population health and quality programs tied to reimbursement |
| Financial Analytics | Denial prevention and risk adjustment validation |
| Operational Analytics | Predictive restocking and acuity-based staffing |
| Strategic Planning & Benchmarking | Service-line planning using peer comparisons |
Clinical Analytics leads because quality measures and population health programs determine a growing share of provider revenue. Operational Analytics grows fastest as supply-chain disruption and workforce shortages hit margins directly, making inventory and staffing optimization a CFO priority. Financial Analytics is gaining urgency from expanded payer audits, while Strategic Planning & Benchmarking supports capital allocation.
| Sub-Segment | Key Trend |
|---|
| Healthcare Providers | Unified platforms across hospitals, ASCs, and specialty clinics |
| Payers | Risk adjustment and program integrity analytics |
| Life-Science Companies | Real-world evidence for trial design and pharmacovigilance |
| Government & Public-Health Agencies | Modernized surveillance and capacity dashboards |
| Other End Users (ACOs, CROs) | Shared-savings tracking and trial operations analytics |
Healthcare Providers dominate because hospitals and health systems carry the heaviest clinical, financial, and regulatory reporting load. Life-Science Companies grow fastest as FHIR pipelines and large provider data networks make real-world evidence practical for trial recruitment and safety monitoring. Payers and Government & Public-Health Agencies remain significant buyers, focused on risk adjustment and population surveillance, respectively.


 Noah Malgeri
Co-Founder

 Peter Groot koerkamp
Account and Business Manager

 Younghwan Choi
Senior Retail Manager

 Mark Irwin
Management Consultant

 Akif Moroglu
Strategy & Business Development Director

 Guilherme Gomes Martins
Product Management Director

 Joseph Aguayo
Sales Operations & Pricing Manager

 La Terria Dodd
Program Support Specialist

 Rob Kooiker
Group Product Manager HVAC & Fire Protection GMA