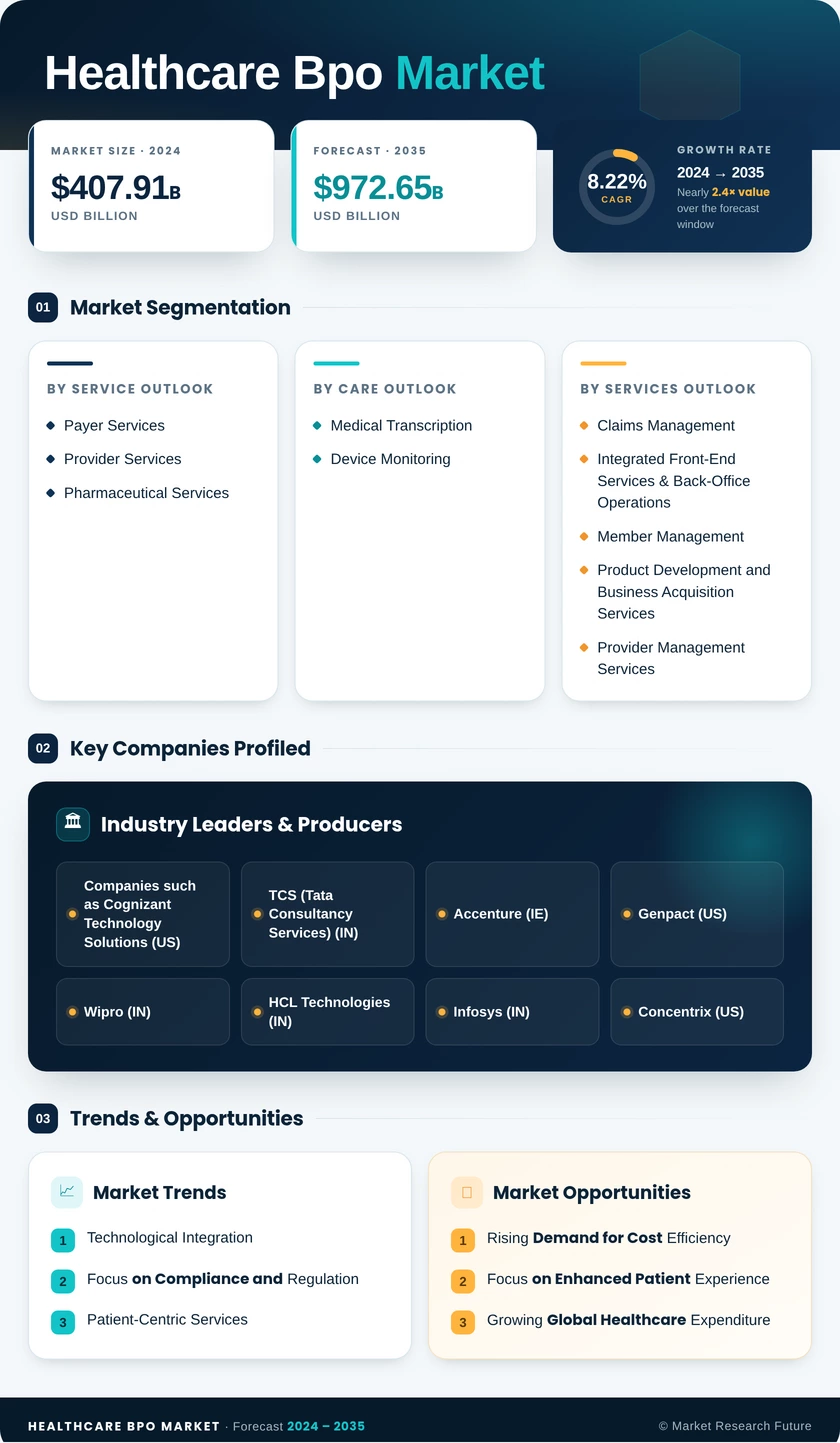
Healthcare BPO Market (2026 - 2035)

ID: MRFR/HS/0827-CR 208 Pages Nidhi Mandole Last Updated: September 12, 2026
Healthcare BPO Market Research Report: Size, Share, Trend Analysis by Payer Services (Claims Management Services [Claims Adjudication Services, Claims Settlement Services, Information Management Services, Claims Repricing, Claims Investigation Services, Claims Indexing Services, Fraud Detection and Management], Integrated Front Office and Back Office Operations, Member Management, Product Development and Business Acquisition Services, Provider Management Services, Care Management, Billing and Accounts Management Services,), Provider Services (Revenue Cycle Management, Patient Enrolment, Patient Care (Medical Transcription and Device Monitoring), and Others), and Pharmaceutical Services (Research & Development, Manufacturing, Non-Clinical Services [Supply Chain Management & Logistics and Sales and Marketing Services],) and by Region - Growth Outlook & Industry Forecast 2025 To 2035
Healthcare BPO Market
Market Size
Forecast Period2026-2035
CAGR (2026-2035)9.6%
2025 Market SizeUSD 387.27 Billion
2035 Market SizeUSD 968.58 Billion
Key Players
Optum
Accenture
Cognizant
R1 RCM
Sagility
IQVIA
Opportunities
  • Nearshore Corridor Build-Out in Latin America
  • BPaaS for Mid-Sized Community Hospitals
  • Real-World Evidence and Data Monetization
  1. 1 Market Summary | |
    1. 1.1 Study Assumptions & Market Definition | |
    2. 1.2 Scope of the Study | |
    3. 1.3 Research Methodology | |
  2. 2 Key Report Takeaways | |
    1. 2.1 By Service Type | |
    2. 2.2 By Service Delivery Model | |
    3. 2.3 By Technology Adoption Model | |
    4. 2.4 By Region | |
  3. 3 Market Size and Forecast (2021–2035) | |
    1. 3.1 Historical Market Size (2021–2025) | |
    2. 3.2 Current & Forecast Market Size (2026–2035) | |
    3. 3.3 Year-over-Year Growth Analysis | |
  4. 4 Driver Impact Analysis | |
    1. 4.1 Payer and Provider Margin Compression | |
    2. 4.2 Clinical and Administrative Labor Shortages | |
    3. 4.3 Generative AI Embedded in Coding Workflows | |
    4. 4.4 Interoperability and Prior-Authorization Mandates | |
    5. 4.5 Private-Equity Platform Consolidation | |
    6. 4.6 Pharmaceutical R&D and Trial Complexity | |
    7. 4.7 Outcome-Based Contracting Adoption | |
  5. 5 Restraints Impact Analysis | |
    1. 5.1 PHI Security and Cross-Border Transfer Rules | |
    2. 5.2 Wage Inflation and Attrition in Delivery Hubs | |
    3. 5.3 Legacy System Fragmentation and Integration Cost | |
    4. 5.4 Data-Residency and Onshoring Legislation | |
    5. 5.5 AI Governance and Clinical Liability Exposure | |
  6. 6 Opportunities | |
    1. 6.1 Nearshore Corridor Build-Out in Latin America | |
    2. 6.2 BPaaS for Mid-Sized Community Hospitals | |
    3. 6.3 Real-World Evidence and Data Monetization | |
    4. 6.4 Emerging-Market Payer Digitization | |
    5. 6.5 Autonomous Prior-Authorization Agents | |
  7. 7 Regional Market Share and Country-Level Analysis | |
    1. 7.1 North America | | |
      1. 7.1.1 US | | |
      2. 7.1.2 Canada | | |
      3. 7.1.3 Mexico | |
    2. 7.2 Europe | | |
      1. 7.2.1 Germany | | |
      2. 7.2.2 UK | | |
      3. 7.2.3 France | | |
      4. 7.2.4 Italy | | |
      5. 7.2.5 Spain | | |
      6. 7.2.6 Nordic Countries | | |
      7. 7.2.7 Russia | | |
      8. 7.2.8 Rest of Europe | |
    3. 7.3 Asia-Pacific | | |
      1. 7.3.1 China | | |
      2. 7.3.2 India | | |
      3. 7.3.3 Japan | | |
      4. 7.3.4 South Korea | | |
      5. 7.3.5 ASEAN | | |
      6. 7.3.6 Rest of Asia-Pacific | |
    4. 7.4 South America | | |
      1. 7.4.1 Brazil | | |
      2. 7.4.2 Argentina | | |
      3. 7.4.3 Rest of South America | |
    5. 7.5 Middle East & Africa | | |
      1. 7.5.1 Saudi Arabia | | |
      2. 7.5.2 UAE | | |
      3. 7.5.3 South Africa | | |
      4. 7.5.4 Egypt | | |
      5. 7.5.5 Rest of MEA | |
  8. 8 Future Outlook (2026–2035) | |
    1. 8.1 Autonomous Operations Reach Production Scale | |
    2. 8.2 Platform Economics Displace Labor Arbitrage | |
    3. 8.3 Delivery Geography Rebalances Toward Hybrid Models | |
    4. 8.4 Workforce Transition and Sustainability Reporting | |
  9. 9 Segmentation Analysis | |
    1. 9.1 By Service Type | | |
      1. 9.1.1 Payer Service | | |
      2. 9.1.2 Provider Service | | |
      3. 9.1.3 Pharmaceutical Service | |
    2. 9.2 By Service Delivery Model | | |
      1. 9.2.1 Onshore | | |
      2. 9.2.2 Offshore | | |
      3. 9.2.3 Nearshore | | |
      4. 9.2.4 Hybrid | |
    3. 9.3 By Technology Adoption Model | | |
      1. 9.3.1 Traditional Lift-and-Shift BPO | | |
      2. 9.3.2 Generative-AI-embedded Delivery | | |
      3. 9.3.3 Platform BPaaS | | |
      4. 9.3.4 Intelligent Automation | |
  10. 10 Competitive Landscape | |
    1. 10.1 Market Concentration Analysis (2026) | |
    2. 10.2 Competitive Benchmarking Matrix | |
    3. 10.3 Company Profiles | |
  11. 11 Recent News & Developments | |
  12. 12 Report Scope and Methodology | |
  13. 13 Detailed Sources and Citations | |
  14. 14 Frequently Asked Questions (FAQs) | | LIST OF TABLES | |
  15. TABLE 1 Global Healthcare BPO Market Size & Forecast, by Revenue (USD Billion), 2021–2035 | |
  16. TABLE 2 Global Healthcare BPO Market — Year-over-Year Growth Analysis, 2021–2035 | |
  17. TABLE 3 Driver Impact Analysis Matrix, 2026–2035 | |
  18. TABLE 4 Restraint Impact Analysis Matrix, 2026–2035 | |
  19. TABLE 5 Global Healthcare BPO Market Size, by Region, 2021–2035 (USD Billion) | |
  20. TABLE 6 North America Healthcare BPO Market Size, by Country, 2021–2035 (USD Billion) | |
  21. TABLE 7 Europe Healthcare BPO Market Size, by Country, 2021–2035 (USD Billion) | |
  22. TABLE 8 Asia-Pacific Healthcare BPO Market Size, by Country, 2021–2035 (USD Billion) | |
  23. TABLE 9 South America Healthcare BPO Market Size, by Country, 2021–2035 (USD Billion) | |
  24. TABLE 10 Middle East & Africa Healthcare BPO Market Size, by Country, 2021–2035 (USD Billion) | |
  25. TABLE 11 Global Healthcare BPO Market Size, by Service Type, 2021–2035 (USD Billion) | |
  26. TABLE 12 Global Healthcare BPO Market Size, by Service Delivery Model, 2021–2035 (USD Billion) | |
  27. TABLE 13 Global Healthcare BPO Market Size, by Technology Adoption Model, 2021–2035 (USD Billion) | |
  28. TABLE 14 North America Healthcare BPO Market Size, by Service Type, 2021–2035 (USD Billion) | |
  29. TABLE 15 Europe Healthcare BPO Market Size, by Service Delivery Model, 2021–2035 (USD Billion) | |
  30. TABLE 16 Asia-Pacific Healthcare BPO Market Size, by Technology Adoption Model, 2021–2035 (USD Billion) | |
  31. TABLE 17 Competitive Benchmarking Matrix, 2026 | |
  32. TABLE 18 Company Profiles — Key Players | |
  33. TABLE 19 Recent Developments & Strategic Announcements, 2023–2025 | |
  34. TABLE 20 Report Scope & Methodology Summary | |
  35. TABLE 21 Detailed Sources and Citations Index | | LIST OF FIGURES | |
  36. FIGURE 1 Market Dynamics — Drivers, Restraints, and Opportunities | |
  37. FIGURE 2 Industry Value Chain Analysis | |
  38. FIGURE 3 Porter's Five Forces Analysis | |
  39. FIGURE 4 Global Market Size Trend and Forecast, 2021–2035 (USD Billion) | |
  40. FIGURE 5 Year-over-Year Growth Trajectory, 2022–2035 | |
  41. FIGURE 6 Market Share by Service Type, 2025 vs 2035 | |
  42. FIGURE 7 Market Share by Service Delivery Model, 2025 vs 2035 | |
  43. FIGURE 8 Market Share by Technology Adoption Model, 2025 vs 2035 | |
  44. FIGURE 9 Regional Revenue Share Distribution, 2025 | |
  45. FIGURE 10 Regional CAGR Comparison, 2026–2035 | |
  46. FIGURE 11 North America Country-Level Share Breakdown, 2025 | |
  47. FIGURE 12 Asia-Pacific Country-Level Share Breakdown, 2025 | |
  48. FIGURE 13 Competitive Landscape — Estimated Revenue Share Bands, 2026 | |
  49. FIGURE 14 Vendor Positioning Matrix — Scale vs Automation Maturity

Segmentation Quick Reference

DimensionSub-SegmentsDominant SegmentFastest Growing Segment
By Service TypePayer Service; Provider Service; Pharmaceutical ServicePharmaceutical Service (58.4% share, 2025)Provider Service (13.9% CAGR, 2026–2035)
By Service Delivery ModelOnshore; Offshore; Nearshore; HybridOffshore (55.5% share, 2025)Nearshore (13.4% CAGR, 2026–2035)
By Technology Adoption ModelTraditional Lift-and-Shift BPO; Generative-AI-embedded Delivery; Platform BPaaS; Intelligent AutomationTraditional Lift-and-Shift BPO (49.7% share, 2025)Generative-AI-embedded Delivery (11.2% CAGR, 2026–2035)


Market Segmentation Overview

By Service Type

Sub-SegmentKey Trend
Payer ServiceClaims Management and Care Management volumes rise under prior-authorization API compliance
Provider ServiceRevenue cycle management, Patient Care Service, and Strategic Planning externalize under coder scarcity
Pharmaceutical ServiceManufacturing, Sales and Marketing, and R&D outsourcing expand with biologics complexity


Pharmaceutical Service leads at 58.4% share because high-potency and cell-therapy manufacturing investment produces long master service agreements bundling technology transfer with regulatory lot-release, and because smaller biotech sponsors cannot scale bioinformatics or toxicology analytics internally. Provider Service grows fastest at 13.9% CAGR as hospitals confront 22% coder vacancy rates and shift mid-cycle work outward. Payer Service trails both on growth, though Claims Management volume rises mechanically with CMS-0057-F decision-timeline compression.

By Service Delivery Model

Sub-SegmentKey Trend
OnshoreRetained for audit-exposed analytics tied to Centers for Medicare & Medicaid Services updates
OffshoreIndia and the Philippines anchor high-volume, low-sensitivity processing
NearshoreGuadalajara–Monterrey and Colombian corridors absorb synchronous clinical queues
HybridThree-tier configurations hedge geopolitical and data-residency exposure


Offshore holds 55.5% share on unit economics that still run roughly four to one against domestic staffing, but the advantage narrows as Indian wages climb 8.4% annually against 3% contract escalators. Nearshore delivery grows fastest at 13.4% CAGR precisely where Offshore cannot compete: prior-authorization and mid-cycle coding that require real-time clinician contact. Onshore capacity persists for audit-facing work, and Hybrid awards increasingly package all three tiers into one sourcing contract.

By Technology Adoption Model

Sub-SegmentKey Trend
Traditional Lift-and-Shift BPOCompliance-sensitive buyers prefer proven, predictable delivery playbooks
Generative-AI-embedded DeliveryGoverned prompt frameworks preserve protected health information safeguards
Platform BPaaSSubscription software bundled with clean-claim and denial-rate guarantees
Intelligent AutomationTargeted bots deployed into single workflows without system-wide overhaul


Traditional Lift-and-Shift BPO retains 49.7% share because health systems facing Office for Civil Rights scrutiny weight auditability above efficiency, and because switching costs on multi-year contracts deter mid-term migration. Generative-AI-embedded Delivery advances fastest at 11.2% CAGR, cutting per-chart handling time 34–48% where vendors can evidence accuracy on buyer-owned validation samples. Platform BPaaS wins mid-sized community hospitals lacking capital budgets, while Intelligent Automation serves as the low-risk entry point that precedes broader commitment.




Download PDF ×

We do not share your information with anyone. However, we may send you emails based on your report interest from time to time. You may contact us at any time to opt-out.