ID: MRFR/HC/6754-HCR | February 2021 | Region: Global | 90 pages
Market Scenario
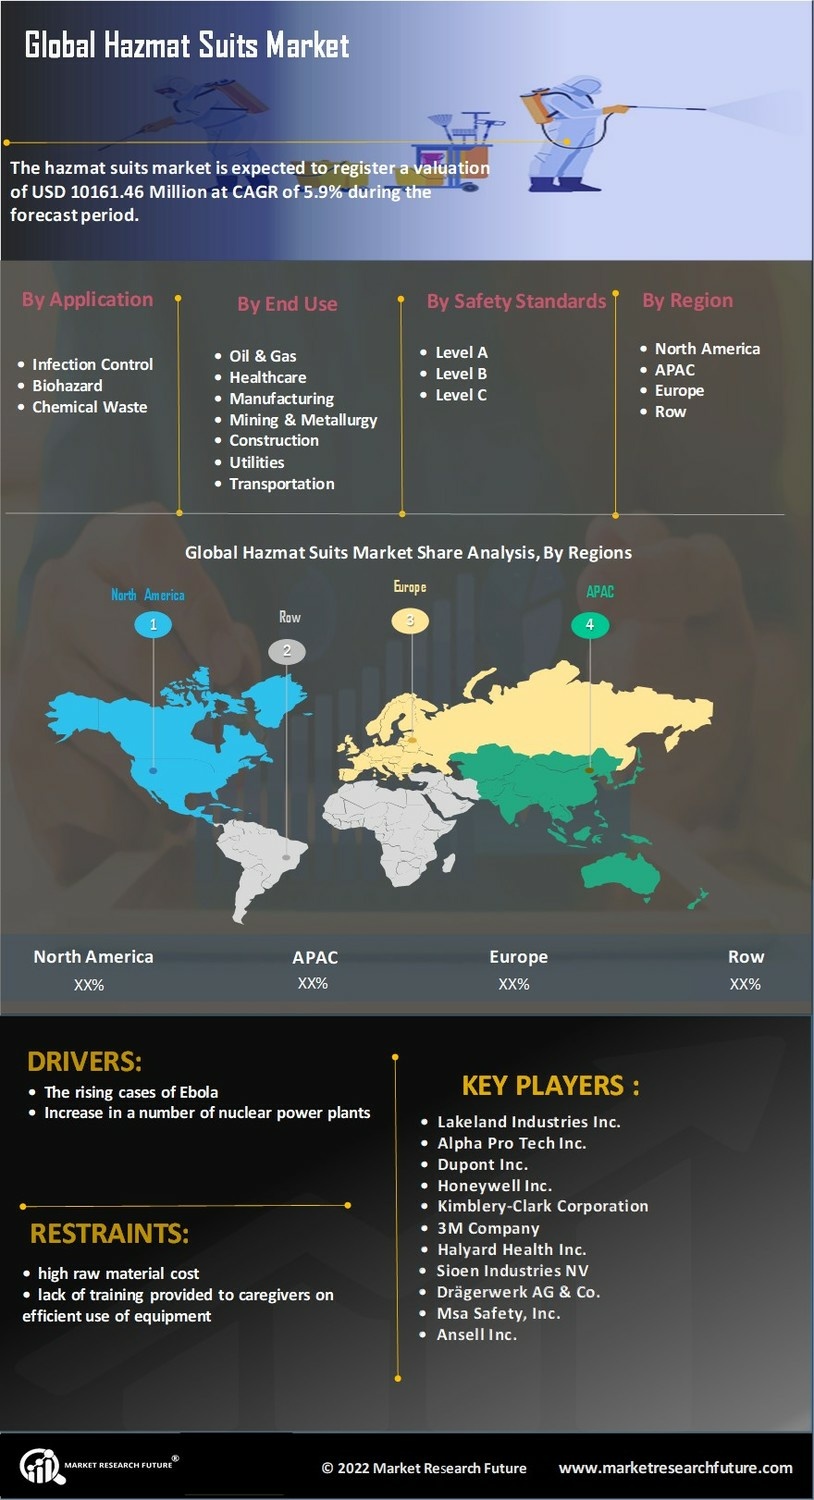
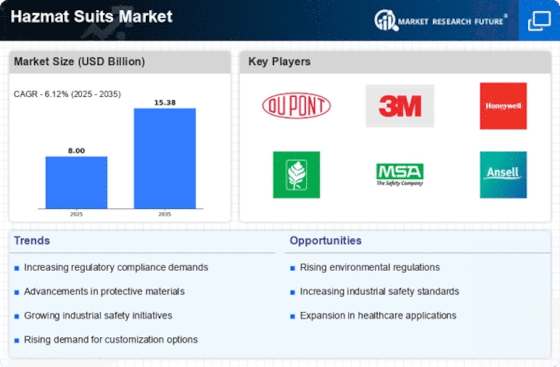
The Global Hazmat Suits Market is expected to grow significantly over the forecast period. It is anticipated that the market held a valuation of USD 6768.19 million in 2018 and is projected to register a valuation of USD 10161.46 Million by 2025 with a CAGR of 5.9% during the forecast period.
Hazmat suits are personal protective equipment worn to protect people from hazardous materials or substances, including chemicals, biological agents, or radioactive materials. They are also known as chemical suits, biohazard suits, and anti-radiation suits.
The rising cases of Ebola is one of the key factors driving the hazmat suits market. According to the Centers for Disease Control and Prevention in 2018, the Ebola virus disease case fatality rate was 61% and the reported a number of cases were 54 in the Democratic Republic of the Congo.
Various other factors such as the increase in a number of nuclear power plants across the globe and rise in work safety are also expected to propel the growth of the market.
However, high raw material cost and lack of training provided to caregivers on efficient use of equipment can hamper market growth over the forecast period.
Segmentation
The global hazmat suits market is segmented based on application, end use, safety standards, and region.
The global market for hazmat suits, by application, has been segmented into infection control & biohazard, chemical waste, haz-mat, and others.
Based on end use, the market has been divided into oil & gas, healthcare, manufacturing, mining & metallurgy, construction, utilities, transportation, and others.
Based on the safety standards, the market has been segregated into level A, level B, level C, and others.
In the current scope of the study, the segments mentioned above are covered into the four global regions, namely, the Americas, Europe, Asia-Pacific, and the Middle East & Africa.
The hazmat suits market in the Americas has further been segmented into North America and South America, with the North American market divided into the US and Canada.
The European hazmat suits market has been segmented into Western Europe and Eastern Europe. Western Europe has been classified as Germany, France, the UK, Italy, Spain, and the rest of Western Europe. The hazmat suits market in Asia-Pacific has been segmented into Japan, China, India, South Korea, Australia, and the rest of Asia-Pacific. The hazmat suits market in the Middle East & Africa has been segmented into the Middle East and Africa.
Regional Market Summary
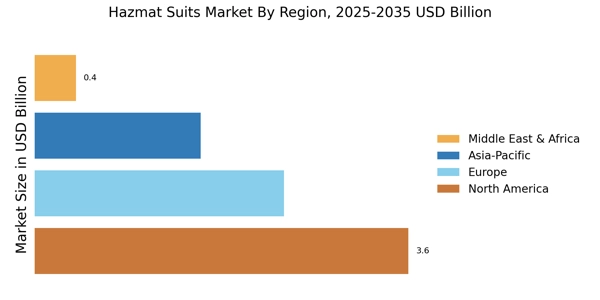
Global Hazmat Suits Market Share (%), by Region, 2018
Sources: MRFR Analysis
The Americas dominated the global market for hazmat suits owing to the increase in the number of nuclear plants, and growth in the number of pharmaceutical and biotechnological industries. According to the World Nuclear Association, the US is the world's largest producer of nuclear power, accounting for more than 30% of worldwide nuclear generation of electricity. Moreover, according to the US Energy Information Administration, as of June 18, 2019, there are 59 commercially operating nuclear power plants with 97 nuclear reactors in 29 of the US states. Additionally, increasing initiatives taken by the US-based manufacturers to develop effective chemical protective suits. For instance, DuPont has introduced ProShield FR, which has been designed as a disposable suit that helps protect primary flame-resistant clothing worn underneath.
In 2018, it was estimated that Europe stood second in the global hazmat suits market. Increasing safety awareness among people and strict government guidelines are driving the growth of the market in European region. Germany commanded the largest share in the European market for hazmat suits due to the increasing need for protection against both the chemical and biological hazardous waste materials.
Asia-Pacific (APAC) is expected to represent the fastest growth in hazmat suits throughout the forecast period due to an increase in the end use applications of hazmat suits and an increase in the economic activities in this region. Countries in Asia-Pacific are adopting advanced waste management practices; this in turn fuels the market growth in this region. Moreover, China is a hub for the manufacturing companies of Level C and D type of hazmat suits. This is expected to have a positive impact on market growth.
On the other hand, the Middle East & Africa holds the least share in the global hazmat suits market due to the low economic development, especially within the African region.
Key Players
Market Segmentation
Global Hazmat Suits Market, by Application
Global Hazmat Suits Market, by End Use
Global Hazmat Suits Market, by Safety Standards
Intended Audience
Frequently Asked Questions (FAQ) :
hazmat suits market was valued at USD 6.7 billion in 2018.
The global market is expected to exhibit a strong 5.9% CAGR over the forecast period from 2019 to 2025.
The growing awareness about workplace safety is the major driver for the market.
Asia Pacific is the largest regional market for hazmat suits due to the growing industrial sector in the region.
Leading players in the market include Lakeland Industries, Alpha Pro Tech, and DuPont, among others.
Table of Contents
Chapter 1. Executive Summary
Chapter 2. Market Introduction
2.1 Definition
2.2 Scope of the Study
2.2.1 Research Objective
2.2.2 Assumptions
2.2.3 Limitations
Chapter 3. Research Methodology
3.1 Overview
3.2 Primary Research
3.3 Secondary Research
3.4 Market Size Estimation
Chapter 4. Market Dynamics
4.1 Drivers
4.2 Restraints
4.3 Opportunities
Chapter 5. Market Factor Analysis
5.1 Porter’s Five Forces Analysis
5.1.1 Bargaining Power of Suppliers
5.1.2 Bargaining Power of Buyers
5.1.3 Threat of New Entrants
5.1.4 Threat of Substitutes
5.1.5 Intensity of Rivalry
5.2 Value Chain Analysis
5.2.1 R&D and Designing
5.2.2 Manufacturing
5.2.3 Distribution & Sales
5.2.4 Post-Sales Review
Chapter 6. Global Hazmat Suits Market, by Application
6.1 Overview
6.2 Infection Control & Biohazard
Market Estimates & Forecast, by Region, 2019–2025
Market Estimates & Forecast, by Country, 2019–2025
6.3 Chemical Waste
Market Estimates & Forecast, by Region, 2019–2025
Market Estimates & Forecast, by Country, 2019–2025
6.4 Haz-Mat
Market Estimates & Forecast, by Region, 2019–2025
Market Estimates & Forecast, by Country, 2019–2025
6.5 Others
Market Estimates & Forecast, by Region, 2019–2025
Market Estimates & Forecast, by Country, 2019–2025
Chapter 7. Global Hazmat Suits Market, by End Use
7.1 Overview
7.2 Oil & Gas
Market Estimates & Forecast, by Region, 2019–2025
Market Estimates & Forecast, by Country, 2019–2025
7.3 Healthcare
Market Estimates & Forecast, by Region, 2019–2025
Market Estimates & Forecast, by Country, 2019–2025
7.4 Manufacturing
Market Estimates & Forecast, by Region, 2019–2025
Market Estimates & Forecast, by Country, 2019–2025
7.5 Mining & Metallurgy
Market Estimates & Forecast, by Region, 2019–2025
Market Estimates & Forecast, by Country, 2019–2025
7.6 Construction
Market Estimates & Forecast, by Region, 2019–2025
Market Estimates & Forecast, by Country, 2019–2025
7.7 Utilities
Market Estimates & Forecast, by Region, 2019–2025
Market Estimates & Forecast, by Country, 2019–2025
7.8 Transportation
Market Estimates & Forecast, by Region, 2019–2025
Market Estimates & Forecast, by Country, 2019–2025
7.9 Others
Market Estimates & Forecast, by Region, 2019–2025
Market Estimates & Forecast, by Country, 2019–2025
Chapter 8. Global Hazmat Suits Market, by Safety Standards
8.1 Overview
8.2 Level A
Market Estimates & Forecast, by Region, 2019–2025
Market Estimates & Forecast, by Country, 2019–2025
8.3 Level B
Market Estimates & Forecast, by Region, 2019–2025
Market Estimates & Forecast, by Country, 2019–2025
8.4 Level C
Market Estimates & Forecast, by Region, 2019–2025
Market Estimates & Forecast, by Country, 2019–2025
8.5 Others
Market Estimates & Forecast, by Region, 2019–2025
Market Estimates & Forecast, by Country, 2019–2025
Chapter 9. Global Hazmat Suits Market, by Region
9.1 Overview
9.2 Americas
9.2.1 North America
9.2.1.1 US
9.2.1.2 Canada
9.2.2 Latin America
9.3 Europe
9.3.1 Western Europe
9.3.1.1 Germany
9.3.1.2 France
9.3.1.3 Italy
9.3.1.4 Spain
9.3.1.5 UK
9.3.1.6 Rest of Western Europe
9.3.2 Eastern Europe
9.4 Asia-Pacific
10.4.1 Japan
10.4.2 China
10.4.3 India
10.4.4 Australia
10.4.5 South Korea
10.4.6 Rest of Asia-Pacific
9.5 Middle East & Africa
10.5.1 Middle East
10.5.2 Africa
Chapter 10. Company Landscape
10.1 Overview
10.2 Competitive Analysis
Chapter 11. Company Profile
11.1 Lakeland Industries Inc.
11.1.1 Company Overview
11.1.2 Products/Services Offered
11.1.3 Financial Overview
11.1.4 Key Developments
11.1.5 SWOT Analysis
11.1.6 Key Strategies
11.2 Alpha Pro Tech Inc.
11.2.1 Company Overview
11.2.2 Products/Services Offered
11.2.3 Financial Overview
11.2.4 Key Developments
11.2.5 SWOT Analysis
11.2.6 Key Strategies
11.3 Dupont Inc.
11.3.1 Company Overview
11.3.2 Products/Services Offered
11.3.3 Financial Overview
11.3.4 Key Development
11.3.5 SWOT Analysis
11.3.6 Key Strategies
11.4 Honeywell Inc.
11.4.1 Company Overview
11.4.2 Products/Services Offered
11.4.3 Financial Overview
11.4.4 Key Development
11.4.5 SWOT Analysis
11.4.6 Key Strategies
11.5 Kimblery-Clark Corporation
11.5.1 Company Overview
11.5.2 Products/Services Offered
11.5.3 Financial overview
11.5.4 Key Developments
11.5.5 SWOT Analysis
11.5.6 Key Strategies
11.6 3M Company
11.6.1 Company Overview
11.6.2 Products/Services Offered
11.6.3 Financial Overview
11.6.4 Key Developments
11.6.5 SWOT Analysis
11.6.6 Key Strategies
11.7 Halyard Health Inc.
11.7.1 Overview
11.7.2 Products/Services Offered
11.7.3 Financial Overview
11.7.4 Key Developments
11.7.5 SWOT Analysis
11.7.6 Key Strategies
11.8 Sioen Industries NV
11.8.1 Overview
11.8.2 Products/Services Offered
11.8.3 Financial Overview
11.8.4 Key Developments
11.8.5 SWOT Analysis
11.8.6 Key Strategies
11.9 Drägerwerk AG & Co.
11.9.1 Overview
11.9.2 Products/Services Offered
11.9.3 Financial Overview
11.9.4 Key Developments
11.9.5 SWOT Analysis
11.9.6 Key Strategies
11.10 Msa Safety Inc.
11.10.1 Overview
11.10.2 Products/Services Offered
11.10.3 Financial Overview
11.10.4 Key Developments
11.10.5 SWOT Analysis
11.10.6 Key Strategies
11.11 Ansell Inc.
11.11.1 Overview
11.11.2 Products/Services Offered
11.11.3 Financial Overview
11.11.4 Key Developments
11.11.5 SWOT Analysis
11.11.6 Key Strategies
11.12 Others
Chapter 12 Appendix
12.1 References
12.2 Related Reports
LIST OF TABLES
Table 1 Global Hazmat Suits Market Synopsis, 2019–2025
Table 2 Global Hazmat Suits Market Estimates and Forecast, 2019–2025 (USD Million)
Table 3 Global Hazmat Suits Market, by Application, 2019–2025 (USD Million)
Table 4 Global Hazmat Suits Market, by End Use, 2019–2025 (USD Million)
Table 5 Global Hazmat Suits Market, by Safety Standards, 2019–2025 (USD Million)
Table 6 Global Hazmat Suits Market, by Region, 2019–2025 (USD Million)
Table 7 Americas: Hazmat Suits Market, by Region, 2018 and 2025
Table 8 Americas: Hazmat Suits Market, by Application, 2019–2025 (USD Million)
Table 9 Americas: Hazmat Suits Market, by End Use, 2019–2025 (USD Million)
Table 10 Americas: Hazmat Suits Market, by Safety Standards, 2019–2025 (USD Million)
Table 11 North America: Hazmat Suits Market, by Country, 2019–2025 (USD Million)
Table 12 North America: Hazmat Suits Market, by Application, 2019–2025 (USD Million)
Table 13 North America: Hazmat Suits Market, by End Use, 2019–2025 (USD Million)
Table 14 North America: Hazmat Suits Market, by Safety Standards, 2019–2025 (USD Million)
Table 15 Latin America: Hazmat Suits Market, by Application, 2019–2025 (USD Million)
Table 16 Latin America: Hazmat Suits Market, by End Use, 2019–2025 (USD Million)
Table 17 Latin America: Hazmat Suits Market, by Safety Standards, 2019–2025 (USD Million)
Table 18 Europe: Hazmat Suits Market, by Region, 2019–2025 (USD Million)
Table 19 Europe: Hazmat Suits Market, by Application, 2019–2025 (USD Million)
Table 20 Europe: Hazmat Suits Market, by End Use, 2019–2025 (USD Million)
Table 21 Europe: Hazmat Suits Market, by Safety Standards, 2019–2025 (USD Million)
Table 22 Western Europe: Hazmat Suits Market, by Country, 2019–2025 (USD Million)
Table 23 Western Europe: Hazmat Suits Market, by Application, 2019–2025 (USD Million)
Table 24 Western Europe: Hazmat Suits Market, by End Use, 2019–2025 (USD Million)
Table 25 Western Europe: Hazmat Suits Market, by Safety Standards, 2019–2025 (USD Million)
Table 26 Eastern Europe: Hazmat Suits Market, by Application, 2019–2025 (USD Million)
Table 27 Eastern Europe: Hazmat Suits Market, by End Use, 2019–2025 (USD Million)
Table 28 Eastern Europe: Hazmat Suits Market, by Safety Standards, 2019–2025 (USD Million)
Table 29 Asia-Pacific: Hazmat Suits Market, by Country, 2019–2025 (USD Million)
Table 30 Asia-Pacific: Hazmat Suits Market, by Application, 2019–2025 (USD Million)
Table 31 Asia-Pacific: Hazmat Suits Market, by End Use, 2019–2025 (USD Million)
Table 32 Asia-Pacific: Hazmat Suits Market, by Safety Standards, 2019–2025 (USD Million)
Table 33 Middle East & Africa: Hazmat Suits Market, by Region, 2019–2025 (USD Million)
Table 34 Middle East & Africa: Hazmat Suits Market, by Application, 2019–2025 (USD Million)
Table 35 Middle East & Africa: Hazmat Suits Market, by End Use, 2019–2025 (USD Million)
Table 36 Middle East & Africa: Hazmat Suits Market, by Safety Standards, 2019–2025 (USD Million)
LIST OF FIGURES
Figure 1 Research Process
Figure 2 Market Structure for Global Hazmat Suits Market
Figure 3 Market Dynamics for Global Hazmat Suits Market
Figure 4 Global Hazmat Suits Market Share, by Application, 2018 (%)
Figure 5 Global Hazmat Suits Market Share, by Application, 2018 (USD Million)
Figure 6 Global Hazmat Suits Market Share, by End Use, 2018 (%)
Figure 7 Global Hazmat Suits Market Share, by End Use, 2018 (USD Million)
Figure 8 Global Hazmat Suits Market Share, by Safety Standards, 2018 (%)
Figure 9 Global Hazmat Suits Market Share, by Safety Standards, 2018 (USD Million)
Figure 10 Global Hazmat Suits Market Share, by Region, 2018 (%)
Figure 11 Americas: Hazmat Suits Market Share, by Region, 2018 (%)
Figure 12 North America: Hazmat Suits Market Share, by Country, 2018 (%)
Figure 13 Europe: Hazmat Suits Market Share, by Region, 2018 (%)
Figure 14 Western Europe: Hazmat Suits Market Share, by Country, 2018 (%)
Figure 15 Asia-Pacific: Hazmat Suits Market Share, by Country, 2018 (%)
Figure 16 Middle East & Africa: Hazmat Suits Market Share, by Region, 2018 (%)
Figure 17 Global Hazmat Suits Market: Company Share Analysis, 2018 (%)
Figure 18 Lakeland Industries Inc.: Key Financials
Figure 19 Lakeland Industries Inc.: Segmental Revenue
Figure 20 Lakeland Industries Inc.: Geographical Revenue
Figure 21 Alpha Pro Tech Inc.: Key Financials
Figure 22 Alpha Pro Tech Inc.: Segmental Revenue
Figure 23 Alpha Pro Tech Inc.: Geographical Revenue
Figure 24 Dupont Inc.: Key Financials
Figure 25 Dupont Inc.: Segmental Revenue
Figure 26 Dupont Inc.: Geographical Revenue
Figure 27 Honeywell Inc.: Key Financials
Figure 28 Honeywell Inc.: Segmental Revenue
Figure 29 Honeywell Inc.: Geographical Revenue
Figure 30 Kimblery-Clark Corporation: Key Financials
Figure 31 Kimblery-Clark Corporation: Segmental Revenue
Figure 32 Kimblery-Clark Corporation: Geographical Revenue
Figure 33 3M Company: Key Financials
Figure 34 3M Company: Segmental Revenue
Figure 35 3M Company: Geographical Revenue
Figure 36 Glenmark Pharmaceuticals, Inc.: Key Financials
Figure 37 Glenmark Pharmaceuticals, Inc.: Segmental Revenue
Figure 38 Glenmark Pharmaceuticals, Inc.: Geographical Revenue
Figure 39 Halyard Health Inc.: Key Financials
Figure 40 Halyard Health Inc.: Segmental Revenue
Figure 41 Halyard Health Inc.: Geographical Revenue
Figure 42 Sioen Industries NV: Key Financials
Figure 43 Sioen Industries NV: Segmental Revenue
Figure 44 Sioen Industries NV: Geographical Revenue
Figure 45 Drägerwerk AG & Co.: Key Financials
Figure 46 Drägerwerk AG & Co.: Segmental Revenue
Figure 47 Drägerwerk AG & Co.: Geographical Revenue
Figure 48 Msa Safety Inc.: Key Financials
Figure 49 Msa Safety Inc.: Segmental Revenue
Figure 50 Msa Safety Inc.: Geographical Revenue
Figure 51 Ansell Inc.: Key Financials
Figure 52 Ansell Inc.: Segmental Revenue
Figure 53 Ansell Inc.: Geographical Revenue
This table of content is tentative and subject to change as the research progresses.
Please Note: Financial details of company cannot be provided if the information of the company is not available in public domain and or reliable source.