Hazardous Area Equipment Market (2026 – 2035)

ID: MRFR/SEM/2448-HCR 100 Pages Ankit Gupta Last Updated: October 27, 2026
Hazardous Area Equipment Market Size, Share and Research Report By Equipment (Power Supply Systems, Electric Motors, Surveillance Systems, Cable Glands and Connectors, Automation and Control Products, Enclosures, Lighting Products, Push Buttons and Signaling Devices), By End-User Industry (Oil and Gas, Energy and Power Generation, Chemical, Mining and Metals, Food and Beverage, Pharmaceuticals) and By Regional (North America, Europe, Asia-Pacific, South America, Middle East & Africa) - Industry Forecast to 2035.
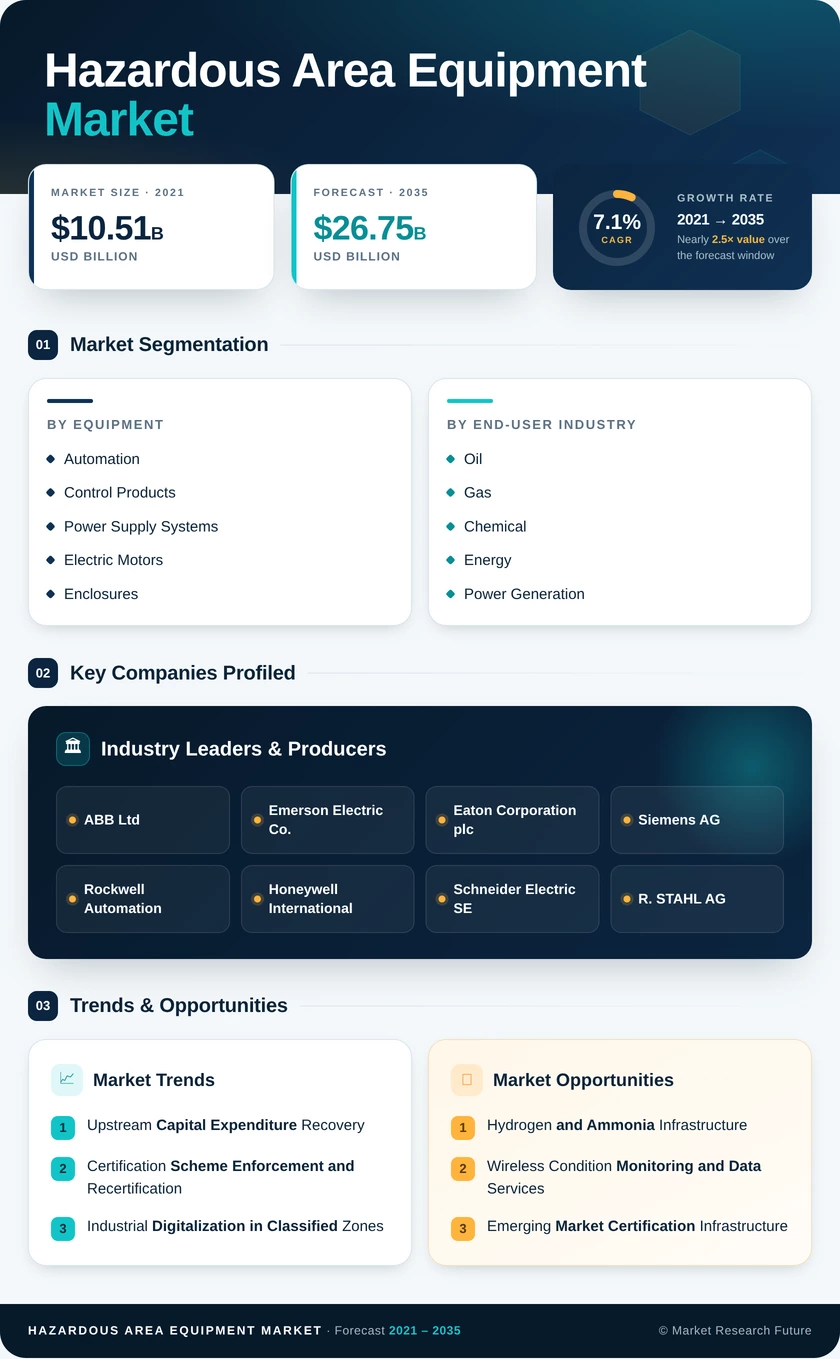
Hazardous Area Equipment Market
Market Size
Forecast Period2026-2035
CAGR (2026-2035)7.10%
2025 Market SizeUSD 13.47 Billion
2035 Market SizeUSD 26.75 Billion
Key Players
ABB Ltd
Emerson Electric Co.
Eaton Corporation plc
Siemens AG
Rockwell Automation
Honeywell International
Opportunities
  • Hydrogen and Ammonia Infrastructure
  • Wireless Condition Monitoring and Data Services
  • Emerging Market Certification Infrastructure
  1. 1 Market Summary | |
    1. 1.1 Study Assumptions & Market Definition | |
    2. 1.2 Scope of the Study | |
    3. 1.3 Research Methodology | |
  2. 2 Key Report Takeaways | |
    1. 2.1 By Equipment | |
    2. 2.2 By End-User Industry | |
    3. 2.3 By Region | |
  3. 3 Market Size and Forecast (2021–2035) | |
    1. 3.1 Historical Market Size (2021–2025) | |
    2. 3.2 Current & Forecast Market Size (2026–2035) | |
    3. 3.3 Market Size by Revenue (USD Billion) | |
    4. 3.4 Year-over-Year Growth Analysis | |
  4. 4 Driver Impact Analysis | |
    1. 4.1 Upstream Capital Expenditure Recovery | |
    2. 4.2 Certification Scheme Enforcement and Recertification | |
    3. 4.3 Industrial Digitalization in Classified Zones | |
    4. 4.4 Chemical and Petrochemical Capacity Additions | |
    5. 4.5 Mining Modernization and Underground Mandates | |
    6. 4.6 Hydrogen and Battery Value Chain Buildout | |
    7. 4.7 Aging Installed Base Replacement | |
  5. 5 Restraints Impact Analysis | |
    1. 5.1 Certification Cost and Testing Lead Times | |
    2. 5.2 Fragmented Scheme Recognition | |
    3. 5.3 Hydrocarbon Capex Cyclicality | |
    4. 5.4 Shortage of Certified Ex Personnel | |
    5. 5.5 Brownfield Retrofit Complexity | |
  6. 6 Opportunities | |
    1. 6.1 Hydrogen and Ammonia Infrastructure | |
    2. 6.2 Wireless Condition Monitoring and Data Services | |
    3. 6.3 Emerging Market Certification Infrastructure | |
    4. 6.4 LED and Energy Efficiency Retrofit | |
    5. 6.5 Zone-Certified Private Connectivity | |
  7. 7 Regional Market Share and Country-Level Analysis | |
    1. 7.1 North America | | |
      1. 7.1.1 US | | |
      2. 7.1.2 Canada | | |
      3. 7.1.3 Mexico | |
    2. 7.2 Europe | | |
      1. 7.2.1 Germany | | |
      2. 7.2.2 UK | | |
      3. 7.2.3 France | | |
      4. 7.2.4 Italy | | |
      5. 7.2.5 Spain | | |
      6. 7.2.6 Nordic Countries | | |
      7. 7.2.7 Russia | | |
      8. 7.2.8 Rest of Europe | |
    3. 7.3 Asia-Pacific | | |
      1. 7.3.1 China | | |
      2. 7.3.2 India | | |
      3. 7.3.3 Japan | | |
      4. 7.3.4 South Korea | | |
      5. 7.3.5 ASEAN | | |
      6. 7.3.6 Rest of Asia-Pacific | |
    4. 7.4 South America | | |
      1. 7.4.1 Brazil | | |
      2. 7.4.2 Argentina | | |
      3. 7.4.3 Rest of South America | |
    5. 7.5 Middle East & Africa | | |
      1. 7.5.1 Saudi Arabia | | |
      2. 7.5.2 UAE | | |
      3. 7.5.3 South Africa | | |
      4. 7.5.4 Egypt | | |
      5. 7.5.5 Rest of MEA | |
  8. 8 Future Outlook (2026–2035) | |
    1. 8.1 Autonomous Inspection and AI-Driven Maintenance | |
    2. 8.2 Electrification Supercycle | |
    3. 8.3 Service Contracts and Platform Economics | |
    4. 8.4 Emissions Regulation and ESG Reporting | |
  9. 9 Segmentation Analysis | |
    1. 9.1 By Equipment | | |
      1. 9.1.1 Power Supply Systems | | |
      2. 9.1.2 Electric Motors | | |
      3. 9.1.3 Surveillance Systems | | |
      4. 9.1.4 Cable Glands and Connectors | | |
      5. 9.1.5 Automation and Control Products | | |
      6. 9.1.6 Enclosures | | |
      7. 9.1.7 Lighting Products | | |
      8. 9.1.8 Push Buttons and Signaling Devices | |
    2. 9.2 By End-User Industry | | |
      1. 9.2.1 Oil and Gas | | |
      2. 9.2.2 Energy and Power Generation | | |
      3. 9.2.3 Chemical | | |
      4. 9.2.4 Mining and Metals | | |
      5. 9.2.5 Food and Beverage | | |
      6. 9.2.6 Pharmaceuticals | | |
      7. 9.2.7 Others | |
  10. 10 Competitive Landscape | |
    1. 10.1 Market Share Analysis (2026) | |
    2. 10.2 Competitive Benchmarking Matrix | |
    3. 10.3 Company Profiles | | |
      1. 10.3.1 ABB Ltd | | |
      2. 10.3.2 Emerson Electric Co. | | |
      3. 10.3.3 Eaton Corporation plc | | |
      4. 10.3.4 Siemens AG | | |
      5. 10.3.5 Rockwell Automation | | |
      6. 10.3.6 Honeywell International | | |
      7. 10.3.7 Schneider Electric SE | | |
      8. 10.3.8 R. STAHL AG | | |
      9. 10.3.9 Pepperl+Fuchs SE | | |
      10. 10.3.10 BARTEC Group | | |
      11. 10.3.11 Hubbell Incorporated | | |
      12. 10.3.12 Weidmüller Interface | |
  11. 11 Recent News & Developments | |
  12. 12 Report Scope and Methodology | |
    1. 12.1 Study Period & Base Year | |
    2. 12.2 Data Sources & Citations | |
    3. 12.3 Abbreviations | |
  13. 13 Detailed Sources and Citations | |
  14. 14 Frequently Asked Questions | | LIST OF TABLES | |
  15. TABLE 1 Global Hazardous Area Equipment Market Size & Forecast, by Revenue (USD Billion), 2021–2035 | |
  16. TABLE 2 Global Hazardous Area Equipment Market – Year-over-Year Growth Analysis, 2021–2035 | |
  17. TABLE 3 Driver Impact Analysis – Estimated Contribution to CAGR, 2026–2035 | |
  18. TABLE 4 Restraint Impact Analysis – Estimated Drag on CAGR, 2026–2035 | |
  19. TABLE 5 Global Market Size, by Equipment, 2021–2035 (USD Billion) | |
  20. TABLE 6 Global Market Size, by End-User Industry, 2021–2035 (USD Billion) | |
  21. TABLE 7 Global Market Size, by Region, 2021–2035 (USD Billion) | |
  22. TABLE 8 North America Market Size, by Country, 2021–2035 (USD Billion) | |
  23. TABLE 9 Europe Market Size, by Country, 2021–2035 (USD Billion) | |
  24. TABLE 10 Asia-Pacific Market Size, by Country, 2021–2035 (USD Billion) | |
  25. TABLE 11 South America Market Size, by Country, 2021–2035 (USD Billion) | |
  26. TABLE 12 Middle East & Africa Market Size, by Country, 2021–2035 (USD Billion) | |
  27. TABLE 13 North America Market Size, by Equipment, 2021–2035 (USD Billion) | |
  28. TABLE 14 North America Market Size, by End-User Industry, 2021–2035 (USD Billion) | |
  29. TABLE 15 Europe Market Size, by Equipment, 2021–2035 (USD Billion) | |
  30. TABLE 16 Europe Market Size, by End-User Industry, 2021–2035 (USD Billion) | |
  31. TABLE 17 Asia-Pacific Market Size, by Equipment, 2021–2035 (USD Billion) | |
  32. TABLE 18 Asia-Pacific Market Size, by End-User Industry, 2021–2035 (USD Billion) | |
  33. TABLE 19 South America Market Size, by Equipment, 2021–2035 (USD Billion) | |
  34. TABLE 20 South America Market Size, by End-User Industry, 2021–2035 (USD Billion) | |
  35. TABLE 21 Middle East & Africa Market Size, by Equipment, 2021–2035 (USD Billion) | |
  36. TABLE 22 Middle East & Africa Market Size, by End-User Industry, 2021–2035 (USD Billion) | |
  37. TABLE 23 Competitive Benchmarking Matrix – Global Hazardous Area Equipment Market, 2026 | |
  38. TABLE 24 Company Profiles – Key Players, Global Hazardous Area Equipment Market | |
  39. TABLE 25 Recent Developments & Strategic Announcements, 2023–2025 | |
  40. TABLE 26 Report Scope & Methodology Summary | |
  41. TABLE 27 Detailed Sources and Citations Index | | LIST OF FIGURES | |
  42. FIGURE 1 Global Hazardous Area Equipment Market Dynamics – Drivers, Restraints, Opportunities | |
  43. FIGURE 2 Industry Value Chain Analysis – Component Supply to Certified Installation | |
  44. FIGURE 3 Porter's Five Forces Analysis | |
  45. FIGURE 4 Global Market Size Trend, 2021–2035 (USD Billion) | |
  46. FIGURE 5 Year-over-Year Growth Trajectory, 2022–2035 (%) | |
  47. FIGURE 6 Market Share by Equipment Segment, 2025 vs 2035 (%) | |
  48. FIGURE 7 Market Share by End-User Industry, 2025 vs 2035 (%) | |
  49. FIGURE 8 Regional Revenue Share Distribution, 2025 (%) | |
  50. FIGURE 9 Regional CAGR Comparison, 2026–2035 (%) | |
  51. FIGURE 10 Country-Level Share within Asia-Pacific, 2025 (%) | |
  52. FIGURE 11 Country-Level Share within Europe, 2025 (%) | |
  53. FIGURE 12 Competitive Landscape – Estimated Revenue Share Positioning, 2026 | |
  54. FIGURE 13 Market Concentration Analysis – HHI and Top-5 | | Hazardous Area Equipment Market — Table of Contents & Market Segmentation | | Executive Summary | |
  55. 1 Market Summary | |
  56. 2 Key Report Takeaways | |
    1. 2.1 By Equipment | |
    2. 2.2 By End-User Industry | |
  57. 3 Market Size and Forecast (2021–2035) | |
  58. 4 Driver Impact Analysis | |
  59. 5 Restraints Impact Analysis | |
  60. 6 Opportunities | |
  61. 7 Regional Market Share and Country-Level Analysis | |
    1. 7.1 North America | |
    2. 7.2 Europe | |
    3. 7.3 Asia-Pacific | |
    4. 7.4 South America | |
    5. 7.5 Middle East & Africa | |
  62. 8 Future Outlook (2026–2035) | |
  63. 9 Segmentation Analysis | |
    1. 9.1 By Equipment | | |
      1. 9.1.1 Automation and Control Products | | |
      2. 9.1.2 Power Supply Systems | | |
      3. 9.1.3 Electric Motors | | |
      4. 9.1.4 Enclosures | | |
      5. 9.1.5 Lighting Products | | |
      6. 9.1.6 Surveillance Systems | | |
      7. 9.1.7 Cable Glands and Connectors | | |
      8. 9.1.8 Push Buttons and Signaling Devices | |
    2. 9.2 By End-User Industry | | |
      1. 9.2.1 Oil and Gas | | |
      2. 9.2.2 Chemical | | |
      3. 9.2.3 Energy and Power Generation | | |
      4. 9.2.4 Mining and Metals | | |
      5. 9.2.5 Food and Beverage | | |
      6. 9.2.6 Pharmaceuticals | | |
      7. 9.2.7 Others | |
  64. 10 Competitive Landscape | |
  65. 11 Recent News & Developments | |
  66. 12 Report Scope and Methodology | |
  67. 13 Detailed Sources and Citations | |
  68. 14 Frequently Asked Questions | | LIST OF TABLES | |
  69. TABLE 1 Hazardous Area Equipment Market Summary Table | |
  70. TABLE 2 Hazardous Area Equipment Market Size and Forecast, 2021–2035 | |
  71. TABLE 3 Driver Impact Analysis | |
  72. TABLE 4 Restraints Impact Analysis | |
  73. TABLE 5 Regional Market Share Summary | |
  74. TABLE 6 North America Country-Level Analysis | |
  75. TABLE 7 Europe Country-Level Analysis | |
  76. TABLE 8 Asia-Pacific Country-Level Analysis | |
  77. TABLE 9 South America Country-Level Analysis | |
  78. TABLE 10 Middle East & Africa Country-Level Analysis | |
  79. TABLE 11 Hazardous Area Equipment Market Segmentation by Equipment | |
  80. TABLE 12 Hazardous Area Equipment Market Segmentation by End-User Industry | |
  81. TABLE 13 Competitive Benchmarking Matrix | |
  82. TABLE 14 Report Scope and Methodology | |
  83. TABLE 15 Detailed Sources and Citations | | LIST OF FIGURES | |
  84. FIGURE 1 Hazardous Area Equipment Market Size Trend, 2021–2035 | |
  85. FIGURE 2 Hazardous Area Equipment Market Year-over-Year Growth Outlook | |
  86. FIGURE 3 Regional Revenue Share Analysis | |
  87. FIGURE 4 Driver and Restraint Impact Matrix | |
  88. FIGURE 5 Competitive Landscape Snapshot | |
  89. FIGURE 6 Segment Share by Equipment | |
  90. FIGURE 7 Segment Share by End-User Industry

Segmentation Quick Reference

DimensionSub-SegmentsDominant SegmentFastest Growing Segment
By EquipmentAutomation and Control Products, Power Supply Systems, Electric Motors, Enclosures, Lighting Products, Surveillance Systems, Cable Glands and Connectors, Push Buttons and Signaling DevicesAutomation and Control ProductsPower Supply Systems
By End-User IndustryOil and Gas, Chemical, Energy and Power Generation, Mining and Metals, Food and Beverage, Pharmaceuticals, OthersOil and GasChemical


Market Segmentation Overview

By Equipment

Sub-SegmentKey Trend
Automation and Control ProductsIntegrated Zone 1 control and safety instrumented systems
Power Supply SystemsDistributed power distribution in classified areas
Electric MotorsElectrification of pumps, compressors, and conveyors
EnclosuresCorrosion-resistant housings for offshore and coastal duty
Lighting ProductsLED retrofit of legacy flameproof fixtures
Surveillance SystemsCertified thermal imaging and perimeter monitoring
Cable Glands and ConnectorsIngress protection for terminations and cable entries
Push Buttons and Signaling DevicesLocal control stations and audible-visual alarms


Automation and Control Products lead the Hazardous Area Equipment Market on both share and growth, expanding at roughly 7.5% as operators consolidate discrete instruments into addressable nodes and safety-rated logic solvers. Power Supply Systems hold second position because every added node needs certified power distribution and isolation. Surveillance Systems grow quickly from a small base as gas-imaging cameras become standard on new-build assets, while Push Buttons and Signaling Devices remain the smallest category with limited technology differentiation.

By End-User Industry

Sub-SegmentKey Trend
Oil and GasUpstream, midstream, and LNG facility construction
ChemicalPetrochemical capacity additions and plant renewal
Energy and Power GenerationGas turbine plants, biomass, and hydrogen facilities
Mining and MetalsUnderground mechanization and methane classification
Food and BeverageCombustible dust zones in milling and powder handling
PharmaceuticalsSolvent handling and intrinsically safe devices in cleanrooms
OthersWastewater, grain handling, and defence applications


Oil and Gas remains the anchor vertical of the Hazardous Area Equipment Market, but its share is drifting down as adjacent industries expand faster. Mining and Metals grows fastest at 8.6%, driven by battery-electric underground fleets and tightening methane monitoring in coal operations. Chemical ranks second by absolute value, sustained by Asian cracker construction. Food and Beverage represents an under-recognized dust-hazard opportunity where classification compliance remains inconsistent across mid-sized processors.


Download PDF ×

We do not share your information with anyone. However, we may send you emails based on your report interest from time to time. You may contact us at any time to opt-out.