ID: MRFR/SEM/3429-HCR | February 2021 | Region: Global | 100 pages
Market Synopsis: Hardware encryption is a technology that encrypts the data stored on a hard drive using sophisticated mathematical functions. Data on an encrypted hard drive cannot be read by anyone who does not have access to the appropriate key or password. This can help prevent access to data by unauthorized entities and provides a layer of security against hackers and other online threats. The concept of hard-drive encryption is simple enough. When a file is written to the drive, it is automatically encrypted by specialized software. When a file is read from the drive, the software automatically decrypts it while leaving all other data on the drive encrypted. The encryption and decryption processes are transparent to all common applications such as word processors, databases, spreadsheets or imaging programs.
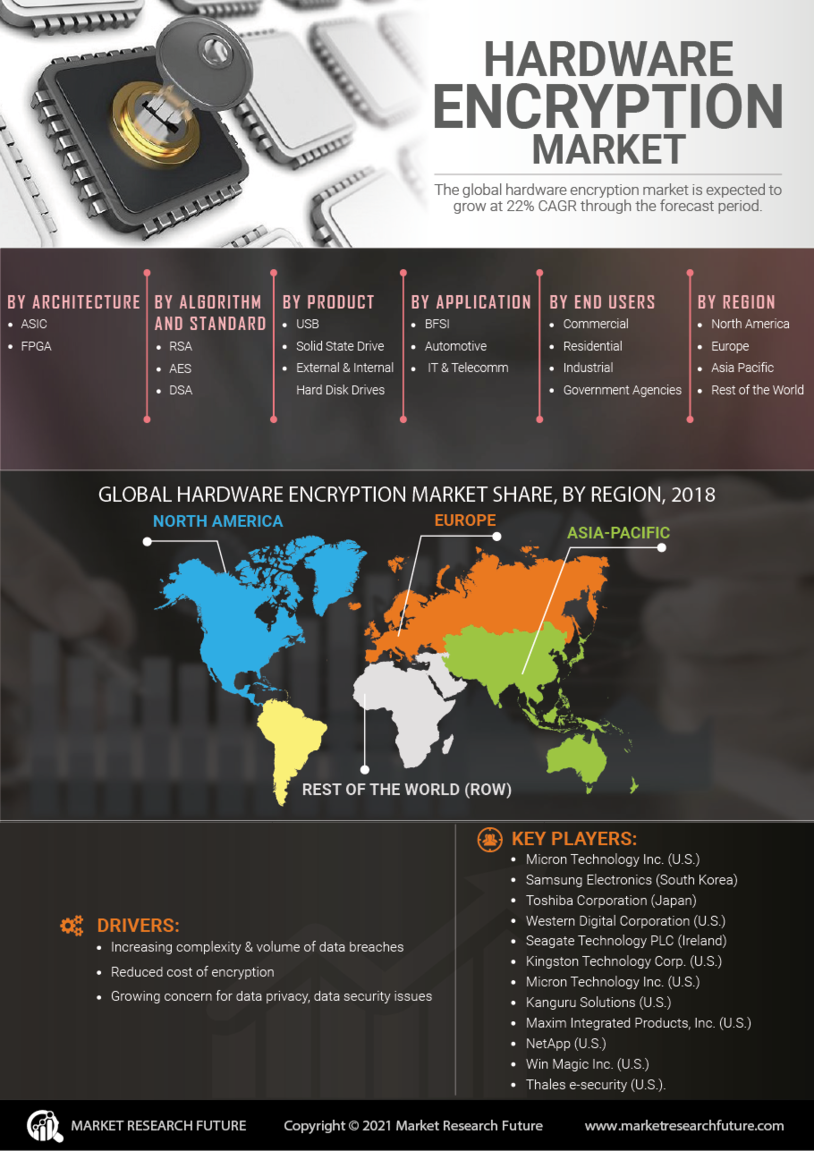
Increasing complexity & volume of data breaches and reduced cost of encryption are major drivers boosting the growth of hardware encryption market. In addition, several advantages offered by hardware encryption in comparison with software encryption technology and the rising need of regulatory framework are some of the other factors estimated to accelerate the growth of the overall market in the near future.
In August 2017, Spyrus Inc. announced the development of a secure environment for Security in a Box ® Secure Storage SDK with FIPS 140-2 Level 3 encrypted storage devices. SPYRUS storage products meet the needs of securing mission critical end points and data collection devices in the Internet of Things (IoT). Other uses are mission data storage for UAVs, wearable and in-vehicle cameras, power grids, homeland security and much more.
Segmentation: The global hardware encryption market is segmented as architecture, algorithm & standard, product, application and end users. Hardware data encryption covers a wide area of applications such as BFSI, automotive, military & aerospace, healthcare etc. In the area of automotive, Symantec Corporation, a leader in software services, designed software for automotive security. It protects critical modules including Engine Control Units (ECU), Body Control Modules (BCM), In Vehicle Infotainment (IVI), and gateway chips protecting the CAN bus from modems and Single Board Computers (SBC) such as the IVI all requiring additional protection. Symantec Critical System Protection is built on proven technology already protecting countless daily financial transactions in core back-end systems of the world’s largest financial services providers, and is “embedded” in countless ATMs.
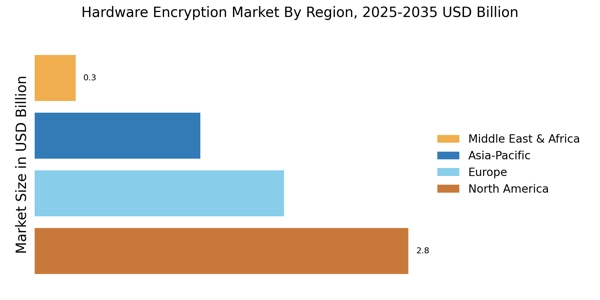
The North America is having the largest share of the hardware encryption market during the forecast period. This region is home to many established hardware encryption manufacturing companies. The hardware encryption market in APAC is expected to grow at a high rate during the forecast period. The primary reason behind this market growth is the expansion of IT and telecommunication network in China, Thailand, Malaysia, South Korea, India, and other developing countries in APAC.
Global Hardware Encryption Market Size, 2017-2023 (USD Billion):
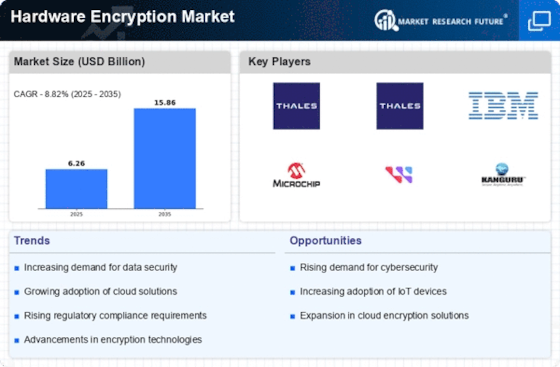
The global hardware encryption market is expected to grow at 22% CAGR through the forecast period.
Some of the key players in the market are Micron Technology Inc. (U.S.), Samsung Electronics (South Korea), Toshiba Corporation (Japan), Western Digital Corporation (U.S.), Seagate Technology PLC (Ireland), Kingston Technology Corp. (U.S.), Micron Technology Inc. (U.S.), Kanguru Solutions (U.S.), Maxim Integrated Products, Inc. (U.S.), NetApp (U.S.), Win Magic Inc. (U.S.), Thales e-security (U.S.).
The market for hardware encryption is segmented into architecture, algorithm and standard, product, application and vertical. The architecture is further segmented in to application specific integrated circuits (ASIC), Field programmable gate arrays (FPGA). On the basis of algorithm and standard, the segment is further divided in to Rivest – Shamir –Adleman (RSA) Algorithm, Advanced encryption standard, secure hash algorithm, digital signature algorithm, data encryption standard and elliptic curve cryptography. On the basis of product the segment is further classified in to external hard disk drives, inline network encryptors, internal hard disk drives, solid state drives, flash drives. The segment application is further divided in to automotive & transportation, BFSI, consumer electronics, healthcare, IT & telecom, military and aerospace. On basis of end user the segment is further divided in to commercial, industrial, residential and government agencies.
By Architecture
By Algorithm & Standard
By Product
By Application
By End users
By Region
Intended Audience
Frequently Asked Questions (FAQ) :
The hardware encryption market is predicted to grow at a 22% CAGR between 2017- 2023.
The hardware encryption market is predicted to reach USD 200 billion by 2023.
North America will lead the hardware encryption market.
Reduced cost of encryption and growing need for regulatory framework are driving the hardware encryption market growth.
Notable players profiled in the hardware encryption market include Thales e-security (U.S.), WinMagic Inc. (U.S.), NetApp (U.S.), Maxim Integrated Products, Inc. (U.S.), Kanguru Solutions (U.S.), Micron Technology Inc. (U.S.), Kingston Technology Corp. (U.S.), Western Digital Corporation (U.S.), Toshiba Corporation (Japan), Samsung Electronics (South Korea), and Micron Technology Inc. (U.S.).
TABLE OF CONTENTS
1 Executive Summary
2 Scope of the Report
2.1 Market Definition
2.2 Scope of the Study
2.2.1 Research Objectives
2.2.2 Assumptions & Limitations
2.3 Markets Structure
3 Market Research Methodology
3.1 Research Process
3.2 Secondary Research
3.3 Primary Research
3.4 Forecast Model
4 Market Landscape
4.1 Five Forces Analysis
4.1.1 Threat of New Entrants
4.1.2 Bargaining power of buyers
4.1.3 Threat of substitutes
4.1.4 Segment rivalry
4.2 Value Chain/Supply Chain of Global Hardware Encryption Market
5 Industry Overview of Global Hardware Encryption Market
5.1 Introduction
5.2 Growth Drivers
5.3 Impact analysis
5.4 Market Challenges
6 Market Trends
6.1 Introduction
6.2 Growth Trends
6.3 Impact analysis
7. Global Hardware Encryption Market by Architecture
7.1 Introduction
7.2 Product specific integrated circuits (ASIC)
7.2.1 Market Estimates & Forecast, 2017-2023
7.2.2 Market Estimates & Forecast by Region, 2017-2023
7.3 Field programmable gate arrays (FPGA)
7.3.1 Market Estimates & Forecast, 2017-2023
7.3.2 Market Estimates & Forecast by Region, 2017-2023
8. Global Hardware Encryption Market by Algorithm & Standard
8.1 Introduction
8.2 Rivest- Shamir-Adleman (RSA) Algorithm
8.2.1 Market Estimates & Forecast, 2017-2023
8.2.2 Market Estimates & Forecast by Region, 2017-2023
8.3 Advanced Encryption Standard (AES)
8.3.1 Market Estimates & Forecast, 2017-2023
8.3.2 Market Estimates & Forecast by Region, 2017-2023
8.4 Secure Hash Algorithm (SHA)
8.4.1 Market Estimates & Forecast, 2017-2023
8.4.2 Market Estimates & Forecast by Region, 2017-2023
8.5 Digital Signature Algorithm (DSA)
8.5.1 Market Estimates & Forecast, 2017-2023
8.5.2 Market Estimates & Forecast by Region, 2017-2023
8.6 Data Encryption Standard (DES)
8.6.1 Market Estimates & Forecast, 2017-2023
8.6.2 Market Estimates & Forecast by Region, 2017-2023
8.7 Elliptic Curve Cryptography (ECC)
8.7.1 Market Estimates & Forecast, 2017-2023
8.7.2 Market Estimates & Forecast by Region, 2017-2023
9. Global Hardware Encryption Market by Product
9.1 Introduction
9.2 External Hard Disk Drives
9.2.1 Market Estimates & Forecast, 2017-2023
9.2.2 Market Estimates & Forecast by Region, 2017-2023
9.3 Inline Network Encryptors
9.3.1 Market Estimates & Forecast, 2017-2023
9.3.2 Market Estimates & Forecast by Region, 2017-2023
9.4 Internal Hard Disk Drives
9.4.1 Market Estimates & Forecast, 2017-2023
9.4.2 Market Estimates & Forecast by Region, 2017-2023
9.5 Solid-State Drives
9.5.1 Market Estimates & Forecast, 2017-2023
9.5.2 Market Estimates & Forecast by Region, 2017-2023
9.6 USB Flash Drives
9.6.1 Market Estimates & Forecast, 2017-2023
9.6.2 Market Estimates & Forecast by Region, 2017-2023
10. Global Hardware Encryption Market by Application
10.1 Introduction
10.2 Automotive
10.2.1 Market Estimates & Forecast, 2017-2023
10.2.2 Market Estimates & Forecast by Region, 2017-2023
10.3 BFSI
10.3.1 Market Estimates & Forecast, 2017-2023
10.3.2 Market Estimates & Forecast by Region, 2017-2023
10.4 IT & Telecom
10.4.1 Market Estimates & Forecast, 2017-2023
10.4.2 Market Estimates & Forecast by Region, 2017-2023
10.5 Military & Aerospace
10.5.1 Market Estimates & Forecast, 2017-2023
10.5.2 Market Estimates & Forecast by Region, 2017-2023
10.6 Healthcare
10.6.1 Market Estimates & Forecast, 2017-2023
10.6.2 Market Estimates & Forecast by Region, 2017-2023
11. Global Hardware Encryption Market by End-Users
11.1 Introduction
11.2 Commercial
11.2.1 Market Estimates & Forecast, 2017-2023
11.2.2 Market Estimates & Forecast by Region, 2017-2023
11.3 Residential
11.3.1 Market Estimates & Forecast, 2017-2023
11.3.2 Market Estimates & Forecast by Region, 2017-2023
11.4 Industrial
11.4.1 Market Estimates & Forecast, 2017-2023
11.4.2 Market Estimates & Forecast by Region, 2017-2023
11.5 Government Agencies
11.5.1 Market Estimates & Forecast, 2017-2023
11.5.2 Market Estimates & Forecast by Region, 2017-2023
12. Global Hardware Encryption Market by Region
12.1 Introduction
12.2 North America
12.2.1 Market Estimates & Forecast, 2017-2023
12.2.2 Market Estimates & Forecast by Architecture, 2017-2023
12.2.3 Market Estimates & Forecast by Algorithm & Standard, 2017-2023
12.2.4 Market Estimates & Forecast by Product, 2017-2023
12.2.5 U.S.
12.2.5.1 Market Estimates & Forecast, 2017-2023
12.2.5.2 Market Estimates & Forecast by Architecture, 2017-2023
12.2.5.3 Market Estimates & Forecast by Algorithm & Standard, 2017-2023
12.2.5.4 Market Estimates & Forecast by Product, 2017-2023
12.2.6 Mexico
12.2.6.1 Market Estimates & Forecast, 2017-2023
12.2.6.2 Market Estimates & Forecast by Architecture, 2017-2023
12.2.6.3 Market Estimates & Forecast by Algorithm & Standard, 2017-2023
12.2.6.4 Market Estimates & Forecast by Product, 2017-2023
12.2.7 Canada
12.2.7.1 Market Estimates & Forecast, 2017-2023
12.2.7.2 Market Estimates & Forecast by Architecture, 2017-2023
12.2.7.3 Market Estimates & Forecast by Algorithm & Standard, 2017-2023
12.2.7.4 Market Estimates & Forecast by Product, 2017-2023
12.3 Europe
12.3.1 Market Estimates & Forecast, 2017-2023
12.3.2 Market Estimates & Forecast by Architecture, 2017-2023
12.3.3 Market Estimates & Forecast by Algorithm & Standard, 2017-2023
12.3.4 Market Estimates & Forecast by Product, 2017-2023
12.3.5 Germany
12.3.5.1 Market Estimates & Forecast, 2017-2023
12.3.5.2 Market Estimates & Forecast by Architecture, 2017-2023
12.3.5.3 Market Estimates & Forecast by Algorithm & Standard, 2017-2023
12.3.5.4 Market Estimates & Forecast by Product, 2017-2023
12.3.6. France
12.3.6.1 Market Estimates & Forecast, 2017-2023
12.3.6.2 Market Estimates & Forecast by Architecture, 2017-2023
12.3.6.3 Market Estimates & Forecast by Algorithm & Standard, 2017-2023
12.3.6.4 Market Estimates & Forecast by Product, 2017-2023
12.3.7 Italy
12.3.7.1 Market Estimates & Forecast, 2017-2023
12.3.7.2 Market Estimates & Forecast by Architecture, 2017-2023
12.3.7.3 Market Estimates & Forecast by Algorithm & Standard, 2017-2023
12.3.7.4 Market Estimates & Forecast by Product, 2017-2023
12.3.8 Spain
12.3.8.1 Market Estimates & Forecast, 2017-2023
12.3.8.2 Market Estimates & Forecast by Architecture, 2017-2023
12.3.8.3 Market Estimates & Forecast by Algorithm & Standard 2017-2023
12.3.8.4 Market Estimates & Forecast by Product, 2017-2023
12.3.9 U.K
12.3.9.1 Market Estimates & Forecast, 2017-2023
12.3.9.2 Market Estimates & Forecast by Architecture, 2017-2023
12.3.9.3 Market Estimates & Forecast by Algorithm & Standard, 2017-2023
12.3.9.4 Market Estimates & Forecast by Product, 2017-2023
12.4 Asia Pacific
12.4.1 Market Estimates & Forecast, 2017-2023
12.4.2 Market Estimates & Forecast by Architecture, 2017-2023
12.4.3 Market Estimates & Forecast by Algorithm & Standard, 2017-2023
12.2.4 Market Estimates & Forecast by Product, 2017-2023
12.4.5 China
12.4.5.1 Market Estimates & Forecast, 2017-2023
12.4.5.2 Market Estimates & Forecast by Architecture, 2017-2023
12.4.5.3 Market Estimates & Forecast by Algorithm & Standard, 2017-2023
12.4.5.4 Market Estimates & Forecast by Product, 2017-2023
12.4.6 India
12.4.6.1 Market Estimates & Forecast, 2017-2023
12.4.6.2 Market Estimates & Forecast by Architecture, 2017-2023
12.4.6.3 Market Estimates & Forecast by Algorithm & Standard, 2017-2023
12.2.6.4 Market Estimates & Forecast by Product, 2017-2023
12.4.7 Japan
12.4.7.1 Market Estimates & Forecast, 2017-2023
12.4.7.2 Market Estimates & Forecast by Architecture, 2017-2023
12.4.7.3 Market Estimates & Forecast by Algorithm & Standard, 2017-2023
12.4.7.4 Market Estimates & Forecast by Product, 2017-2023
12.4.8 Rest of Asia Pacific
12.4.8.1 Market Estimates & Forecast, 2017-2023
12.4.8.2 Market Estimates & Forecast by Architecture, 2017-2023
12.4.8.3 Market Estimates & Forecast by Algorithm & Standard, 2017-2023
12. 4. 8.4 Market Estimates & Forecast by Product, 2017-2023
12.5 Rest of the world
12.5.1 Market Estimates & Forecast, 2017-2023
12.5.2 Market Estimates & Forecast by Architecture, 2017-2023
12.5.3 Market Estimates & Forecast by Algorithm & Standard, 2017-2023
12.5.4 Market Estimates & Forecast by Product, 2017-2023
12.5.5 Middle East & Africa
12.5.5.1 Market Estimates & Forecast, 2017-2023
12.5.5.2 Market Estimates & Forecast by Architecture, 2017-2023
12.5.5.3 Market Estimates & Forecast by Algorithm & Standard, 2017-2023
12.5.5.4 Market Estimates & Forecast by Product, 2017-2023
12.5.6 Latin Countries
12.5.6.1 Market Estimates & Forecast, 2017-2023
12.5.6.2 Market Estimates & Forecast by Architecture, 2017-2023
12.5.6.3 Market Estimates & Forecast by Algorithm & Standard, 2017-2023
12.5.6.4 Market Estimates & Forecast by Product, 2017-2023
13. Company Landscape
14. Company Profiles
14.1 Micron Technology Inc. (U.S.).
14.1.1 Company Overview
14.1.2 Product/Business Segment Overview
14.1.3 Financial Updates
14.1.4 Key Developments
14.2 Samsung Electronics (South Korea)
14.2.1 Company Overview
14.2.2 Product/Business Segment Overview
14.2.3 Financial Updates
14.2.4 Key Developments
14.3 Toshiba Corporation (Japan)
14.3.1 Company Overview
14.3.2 Product/Business Segment Overview
14.3.3 Financial Updates
14.3.4 Key Developments
14.4 Western Digital Corporation (U.S.)
14.4.1 Company Overview
14.4.2 Product/Business Segment Overview
14.4.3 Financial Updates
14.4.4 Key Developments
14.5 Seagate Technology PLC (Ireland)
14.5.1 Company Overview
14.5.2 Product/Business Segment Overview
14.5.3 Financial Updates
14.5.4 Key Developments
14.6 Kingston Technology Corp. (U.S.)
14.6.1 Company Overview
14.6.2 Product/Business Segment Overview
14.6.3 Financial Updates
14.6.4 Key Developments
14.7 Micron Technology Inc. (U.S.)
14.7.1 Company Overview
14.7.2 Product/Business Segment Overview
14.7.3 Financial Updates
14.7.4 Key Developments
14.8 Kanguru Solutions (U.S.)
14.8.1 Company Overview
14.8.2 Product/Business Segment Overview
14.8.3 Financial Updates
14.8.4 Key Developments
14.9 Maxim Integrated Products, Inc. (U.S.)
14.9.1 Company Overview
14.9.2 Product/Business Segment Overview
14.9.3 Financial Updates
14.9.4 Key Developments
15 Conclusion
LIST OF TABLES
Table 1World Population by Major Regions (2017 To 2030)
Table 2 Global VR Software Market: By Region, 2017-2023
Table 3 North America VR Software Market: By Country, 2017-2023
Table 4 Europe VR Software Market: By Country, 2017-2023
Table 5 Asia-Pacific VR Software Market: By Country, 2017-2023
Table 6 Middle East & Africa VR Software Market: By Country, 2017-2023
Table 7 Latin America VR Software Market: By Country, 2017-2023
Table 8 Global VR Software by Architecture Market: By Regions, 2017-2023
Table 9 North America VR Software by Architecture Market: By Country, 2017-2023
Table10 Europe VR Software by Architecture Market: By Country, 2017-2023
Table11 Asia-Pacific VR Software by Architecture Market: By Country, 2017-2023
Table12 Middle East & Africa VR Software by Architecture Market: By Country, 2017-2023
Table13 Latin America VR Software by Architecture Market: By Country, 2017-2023
Table14 Global VR Software by Product Market: By Regions, 2017-2023
Table15 North America VR Software by Product Market: By Country, 2017-2023
Table16 Europe VR Software by Product Market: By Country, 2017-2023
Table17 Asia-Pacific VR Software by Product Market: By Country, 2017-2023
Table18 Middle East & Africa VR Software by Product Market: By Country, 2017-2023
Table19 Latin America VR Software by Product Market: By Country, 2017-2023
Table20 North America VR Software for Form Market: By Country, 2017-2023
Table21 Europe VR Software for Form Market: By Country, 2017-2023
Table22 Asia-Pacific VR Software for Form Market: By Country, 2017-2023
Table23 Middle East & Africa VR Software for Form Market: By Country, 2017-2023
Table24 Latin America VR Software for Form Market: By Country, 2017-2023
Table25 Global Architecture Market: By Region, 2017-2023
Table26 North America VR Software Market, By Country
Table27 North America VR Software Market, By Architecture
Table28 North America VR Software Market, By Algorithm & Standard
Table29 North America VR Software Market, By Product
Table30 North America VR Software Market, By Application
Table31 North America VR Software Market, By End-User
Table32 Europe: VR Software Market, By Country
Table33 Europe: VR Software Market, By Architecture
Table34 Europe: VR Software Market, By Algorithm & Standard
Table 35 Europe: VR Software Market, By Product
Table36 Europe VR Software Market, By Application
Table37 Europe VR Software Market, By End-User
Table38 Asia-Pacific: VR Software Market, By Country
Table39 Asia-Pacific: VR Software Market, By Architecture
Table40 Asia-Pacific: VR Software Market, By Algorithm & Standard
Table 41 Asia-Pacific: VR Software Market, By Product
Table42 Asia-Pacific VR Software Market, By Application
Table43 Asia-Pacific VR Software Market, By End-User
Table44 Middle East & Africa: VR Software Market, By Country
Table45 Middle East & Africa VR Software Market, By Architecture
Table46 Middle East & Africa VR Software Market, By Algorithm & Standard
Table47 Middle East & Africa: VR Software Market, By Product
Table48 Middle East & Africa VR Software Market, By Application
Table49 Middle East & Africa VR Software Market, By End-User
Table50 Latin America: VR Software Market, By Country
Table51 Latin America VR Software Market, By Architecture
Table52 Latin America VR Software Market, By Algorithm & Standard
Table53 Latin America: VR Software Market, By Product
Table54 Latin America VR Software Market, By Application
Table55 Latin America VR Software Market, By End-User
LIST OF FIGURES
FIGURE 1 Global VR Software Market segmentation
FIGURE 2 Forecast Methodology
FIGURE 3 Five Forces Analysis of Global VR Software Market
FIGURE 4 Value Chain of Global VR Software Market
FIGURE 5 Share of Global VR Software Market in 2017, by country (in %)
FIGURE 6 Global VR Software Market, 2017-2023,
FIGURE 7 Sub segments of Architecture
FIGURE 8 Global VR Software Market size by Architecture, 2017
FIGURE 9 Share of Global VR Software Market by Architecture, 2017 TO 2023
FIGURE 10 Global VR Software Market size by Algorithm & Standard, 2017
FIGURE 11 Share of Global VR Software Market by Algorithm & Standard, 2017 TO 2023
FIGURE 12 Global VR Software Market size by Product, 2017 TO 2023
FIGURE 13 Share of Global VR Software Market by Product, 2017 TO 2023
FIGURE 14 Global VR Software Market size by Application, 2017 TO 2023
FIGURE 15 Share of Global VR Software Market by Application, 2017 TO 2023
FIGURE 16 Global VR Software Market size by End-user, 2017 TO 2023
FIGURE 17 Share of Global VR Software Market by End-user, 2017 TO 2023