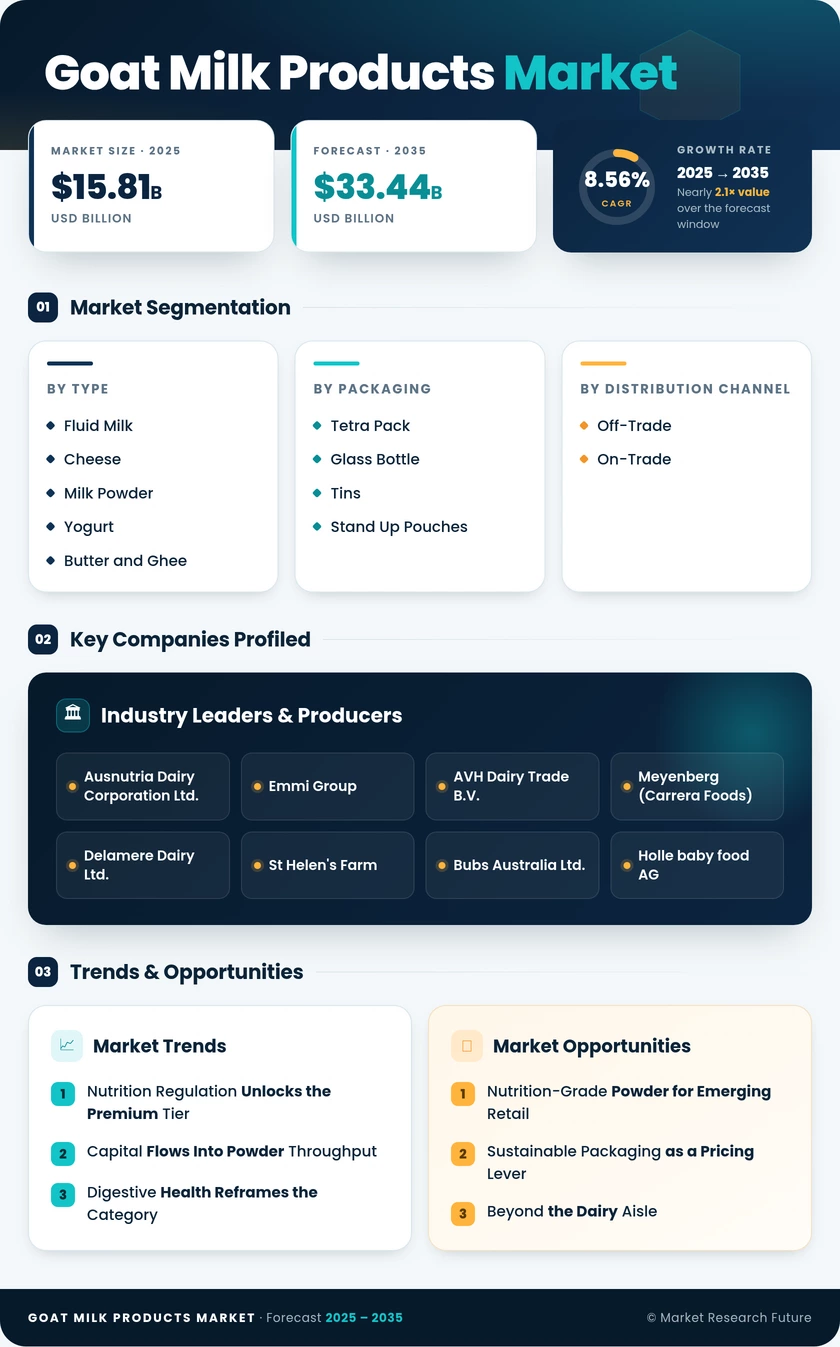
Segmentation Quick Reference
| Dimension | Sub-Segments | Dominant Segment | Fastest Growing Segment |
| By Product Type | Fluid Milk; Cheese; Milk Powder; Yogurt; Butter and Ghee; Ice Cream and Desserts | Fluid Milk | Milk Powder |
| By Packaging | Glass Bottle; Tetra Pack; Stand Up Pouches; Tins | Tetra Pack | Stand Up Pouches |
| By Distribution Channel | On-Trade; Off-Trade | Off-Trade | Off-Trade |
| By Geography | North America; Europe; Asia-Pacific; South America; Middle East & Africa | Asia-Pacific | Middle East & Africa |
Market Segmentation Overview
By Product Type
| Sub-Segment | Key Trend |
| Fluid Milk | Migration from specialty aisles into mainstream grocery distribution |
| Cheese | Designation-of-origin protection sustaining premium unit values |
| Milk Powder | Capacity commissioning tied to nutrition registration pipelines |
| Yogurt | Probiotic and high-protein functional reformulation |
| Butter and Ghee | Culinary and clinical demand concentrated in South Asia |
| Ice Cream and Desserts | Premium foodservice innovation and limited-edition formats |
Product mix is the clearest indicator of where value is heading. Fluid milk carries the volume and builds the household habit, while powder and cheese capture disproportionate margin. Processors that can flex between wet and dried output across the lactation curve consistently outperform single-format operators.
By Packaging
| Sub-Segment | Key Trend |
| Glass Bottle | Premium and artisanal signalling in developed retail |
| Tetra Pack | Ambient logistics enabling secondary-city distribution |
| Stand Up Pouches | Recyclable mono-material formats meeting retailer mandates |
| Tins | Barrier protection standard for nutrition-grade powder |
Format choice now sits at the intersection of cost, shelf life and compliance. Aseptic cartons unlock geographies that chilled distribution cannot reach economically, while pouches answer packaging directives without sacrificing the premium cue that shoppers expect from this category.
By Distribution Channel
| Sub-Segment | Key Trend |
| On-Trade | Café and restaurant placement driving trial and brand discovery |
| Off-Trade | Supermarket listings plus e-commerce and quick-commerce expansion |
Retail dominance reflects the fundamentally domestic nature of consumption, but the two channels work together. Foodservice placement functions as paid sampling; off-trade converts that awareness into repeat purchase, increasingly through mobile platforms rather than physical shelf.
By Geography
| Sub-Segment | Key Trend |
| North America | Mainstream retail distribution gains and clinical nutrition entry |
| Europe | Protected-designation cheese value growth against flat volume |
| Asia-Pacific | Formula registration cycles and e-commerce-led penetration |
| South America | Collection infrastructure modernisation converting informal supply. |
| Middle East & Africa | Sovereign livestock programmes and import substitution |
Regional divergence is widening rather than narrowing. Asia-Pacific supplies scale, Europe supplies value, and the Middle East supplies momentum. Any credible ten-year strategy has to address all three with different operating models, because what works in Hunan will not work in Provence.


 Noah Malgeri
Co-Founder

 Peter Groot koerkamp
Account and Business Manager

 Younghwan Choi
Senior Retail Manager

 Mark Irwin
Management Consultant

 Akif Moroglu
Strategy & Business Development Director

 Guilherme Gomes Martins
Product Management Director

 Joseph Aguayo
Sales Operations & Pricing Manager

 La Terria Dodd
Program Support Specialist

 Rob Kooiker
Group Product Manager HVAC & Fire Protection GMA