Globe Valve Market (2026 - 2035)

ID: MRFR/Equip/40853-HCR 200 Pages Aarti Dhapte Last Updated: October 05, 2026
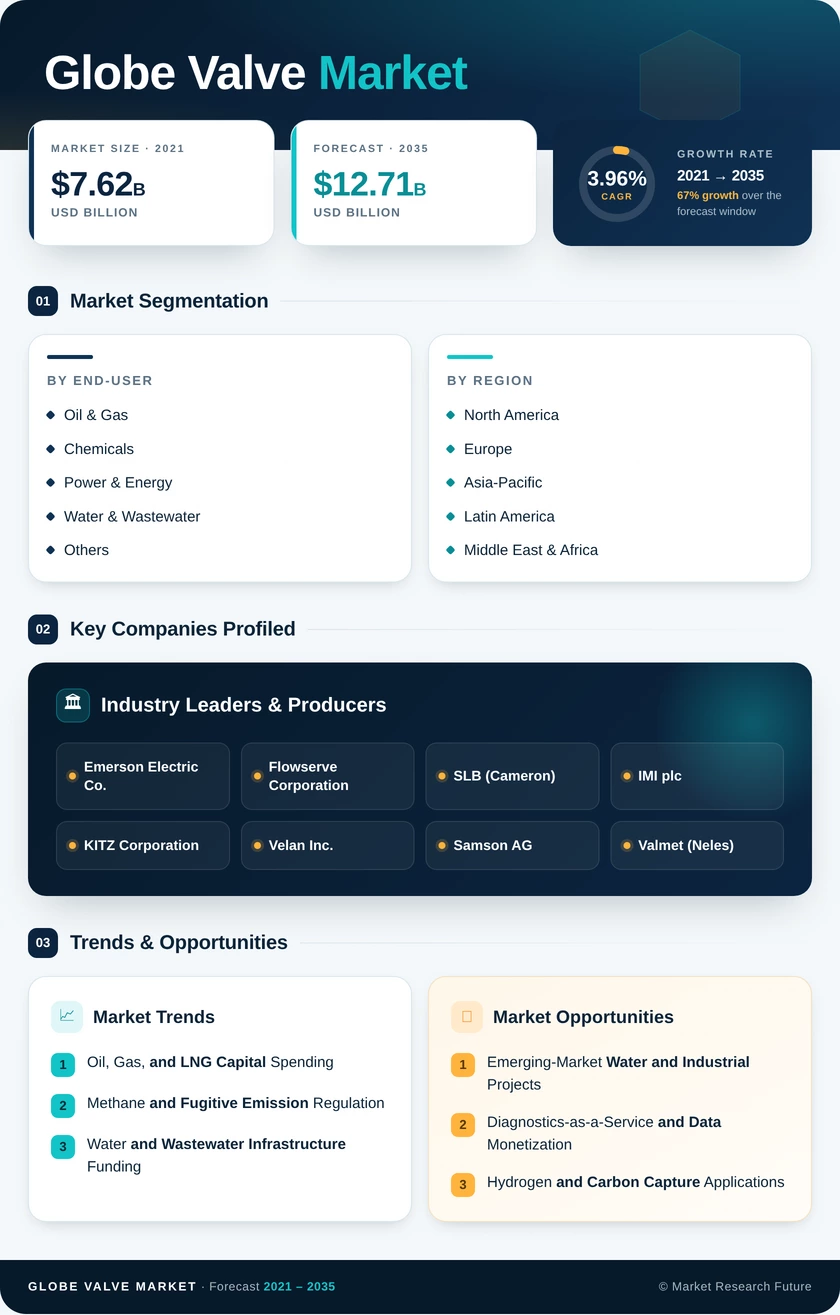
Globe Valve Market Research Report By End-User (Oil & Gas, Chemicals, Power & Energy, Water & Wastewater, Others) - Forecast to 2035
Globe Valve Market
Market Size
Forecast Period2026-2035
CAGR (2026-2035)3.96%
2025 Market SizeUSD 8.62 Billion
2035 Market SizeUSD 12.71 Billion
Key Players
Emerson Electric Co.
Flowserve Corporation
SLB
IMI plc
KITZ Corporation
Velan Inc.
Opportunities
  • Emerging-Market Water and Industrial Projects
  • Diagnostics-as-a-Service and Data Monetization
  • Hydrogen and Carbon Capture Applications
  1. 1 Market Summary | |
  2. 2 Key Report Takeaways | |
    1. 2.1 By End-User | |
    2. 2.2 By Region | |
  3. 3 Market Size and Forecast (2021–2035) | |
  4. 4 Driver Impact Analysis | |
    1. 4.1 Oil, Gas, and LNG Capital Spending | |
    2. 4.2 Methane and Fugitive Emission Regulation | |
    3. 4.3 Water and Wastewater Infrastructure Funding | |
    4. 4.4 Process Automation and Valve Diagnostics | |
    5. 4.5 Power Generation Build-Out, Including Nuclear | |
    6. 4.6 Chemical and Refining Capacity in Asia | |
  5. 5 Restraints Impact Analysis | |
    1. 5.1 Fragmented Regional Certifications and Standards | |
    2. 5.2 Raw Material and Alloy Price Volatility | |
    3. 5.3 Substitution by Ball and Butterfly Valves | |
    4. 5.4 Oil Price Cyclicality and Project Deferrals | |
    5. 5.5 Tariffs and Trade Barriers on Steel Products | |
  6. 6 Opportunities | |
    1. 6.1 Emerging-Market Water and Industrial Projects | |
    2. 6.2 Diagnostics-as-a-Service and Data Monetization | |
    3. 6.3 Hydrogen and Carbon Capture Applications | |
    4. 6.4 Low-Emission Retrofit Kits for the Installed Base | |
    5. 6.5 Small Modular Reactor Supply Chains | |
  7. 7 Regional Market Share and Country-Level Analysis | |
    1. 7.1 North America | | |
      1. 7.1.1 United States | | |
      2. 7.1.2 Canada | |
    2. 7.2 Europe | | |
      1. 7.2.1 Germany | | |
      2. 7.2.2 United Kingdom | | |
      3. 7.2.3 France | | |
      4. 7.2.4 Rest of Europe | |
    3. 7.3 Asia-Pacific | | |
      1. 7.3.1 China | | |
      2. 7.3.2 India | | |
      3. 7.3.3 Japan | | |
      4. 7.3.4 South Korea | | |
      5. 7.3.5 Rest of Asia-Pacific | |
    4. 7.4 Latin America | |
    5. 7.5 Middle East & Africa | | |
      1. 7.5.1 Saudi Arabia | | |
      2. 7.5.2 South Africa | | |
      3. 7.5.3 Rest of Middle East & Africa | |
  8. 8 Future Outlook (2026–2035) | |
    1. 8.1 Diagnostics and Autonomous Plant Operations | |
    2. 8.2 Energy Transition Applications | |
    3. 8.3 Water Security and Reuse | |
    4. 8.4 Supply Chain Localization and Emissions Reporting | |
  9. 9 Segmentation Analysis | |
    1. 9.1 By End-User | | |
      1. 9.1.1 Oil & Gas | | |
      2. 9.1.2 Chemicals | | |
      3. 9.1.3 Power & Energy | | |
      4. 9.1.4 Water & Wastewater | | |
      5. 9.1.5 Others | |
  10. 10 Competitive Landscape | |
  11. 11 Recent News & Developments | |
  12. 12 Report Scope and Methodology | |
  13. 13 Detailed Sources and Citations | |
  14. 14 Frequently Asked Questions (FAQs) | | LIST OF TABLES | |
  15. TABLE 1 Global Globe Valve Market Summary Snapshot, 2025–2035 | |
  16. TABLE 2 Global Globe Valve Market Size & Forecast, by Revenue (USD Billion), 2021–2035 | |
  17. TABLE 3 Driver Impact Analysis, 2026–2035 | |
  18. TABLE 4 Restraints Impact Analysis, 2026–2035 | |
  19. TABLE 5 Global Globe Valve Market, by Region, 2025 | |
  20. TABLE 6 North America Globe Valve Market, by Country, 2025 | |
  21. TABLE 7 Europe Globe Valve Market, by Country, 2025 | |
  22. TABLE 8 Asia-Pacific Globe Valve Market, by Country, 2025 | |
  23. TABLE 9 Latin America Globe Valve Market Overview, 2025 | |
  24. TABLE 10 Middle East & Africa Globe Valve Market, by Country, 2025 | |
  25. TABLE 11 Global Globe Valve Market, by End-User, 2025 | |
  26. TABLE 12 Competitive Benchmarking Matrix, 2025 | |
  27. TABLE 13 Report Scope and Methodology | |
  28. TABLE 14 Detailed Sources and Citations | | LIST OF FIGURES | |
  29. FIGURE 1 Market Dynamics Overview — Drivers, Restraints, Opportunities | |
  30. FIGURE 2 Globe Valve Industry Value Chain Analysis | |
  31. FIGURE 3 Porter's Five Forces Analysis | |
  32. FIGURE 4 Global Market Size Trend, 2021–2035 (USD Billion) | |
  33. FIGURE 5 Market Share by End-User, 2025 (%) | |
  34. FIGURE 6 Market Share by Region, 2025 (%) | |
  35. FIGURE 7 Asia-Pacific Country Share, 2025 (%) | |
  36. FIGURE 8 Competitive Landscape — Estimated Revenue Share Ranges, 2025

Segmentation Quick Reference

DimensionSub-SegmentsDominant SegmentFastest Growing Segment
By End-UserOil & Gas, Chemicals, Power & Energy, Water & Wastewater, OthersOil & Gas (33.5% share)Water & Wastewater (5.1% CAGR)
By RegionNorth America, Europe, Asia-Pacific, Latin America, Middle East & AfricaAsia-Pacific (41.5% share)Asia-Pacific (41.5% share; highest growth)


Market Segmentation Overview

By End-User

Sub-SegmentKey Trend
Oil & GasLow-emission valve retrofits under methane rules; LNG train build-out
ChemicalsAlloy trims for corrosive service in integrated Asian complexes
Power & EnergySevere-service feedwater and steam valves for nuclear and CCGT plants
Water & WastewaterAutomated dosing and pressure control in treatment upgrades
OthersHygienic and sanitary globe valves for pharma and food processing


Oil & Gas leads at a 33.5% share because choke and separator loops demand tight throttling under high pressure, and methane rules are forcing stem-seal upgrades across existing sites. Water & Wastewater grows fastest at a 5.1% CAGR, as federal and national programs fund treatment plants that rely on automated globe valves for dosing and backwash control. Power & Energy and Chemicals hold steady positions tied to nuclear life extension and Asian chemical capacity.


 

Download PDF ×

We do not share your information with anyone. However, we may send you emails based on your report interest from time to time. You may contact us at any time to opt-out.