ID: MRFR/ICT/1491-HCR | February 2021 | Region: Global | 100 pages
Market Synopsis of Global data colocation Market:
Market Scenario:
Data colocation refers to data center services provided to businesses to power & cool their servers, storage, networking and other computing devices. The data colocation facility leases server cabinets and cages, enables connections to its network & physical infrastructure, and provides optional services such as structured cabling, server monitoring, remote support and hardware leasing to the user. Colocation data centers usually serve as a bridge between on-premises and on-cloud data centers. It also helps organization in saving time, cost and disturbances of on-premises data centers which demand constant maintenance. The major driving factor for growth of data colocation market is its ability to provide access to managed security or hosting servers, central data storage, backups, firewalls, fire suppression systems, and environmental controls and the reduce the hassle of on-premises data centers that require constant maintenance, power, and cooling, to support the IT equipment. Data colocation also enables the organizations to increase their business potential by focusing on their core business and reducing their capabilities in recovery of catastrophes.
Study Objectives of Global data colocation Market:
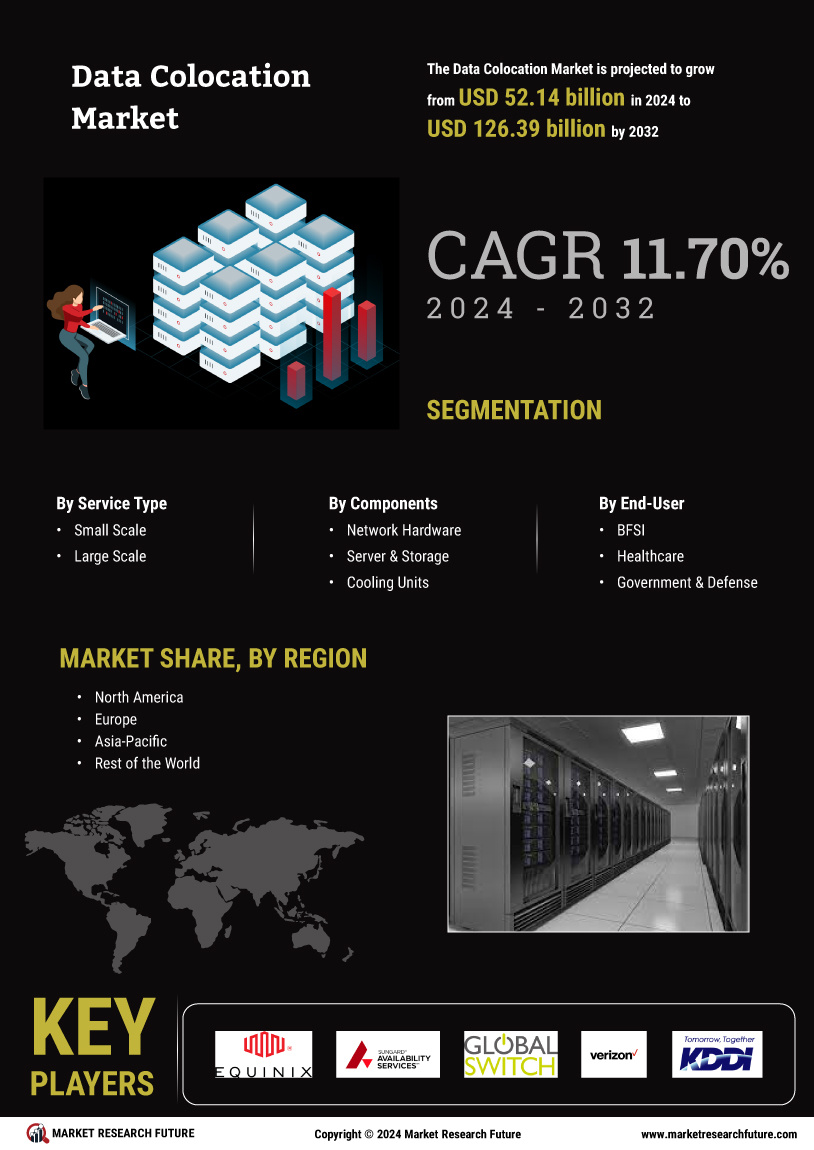
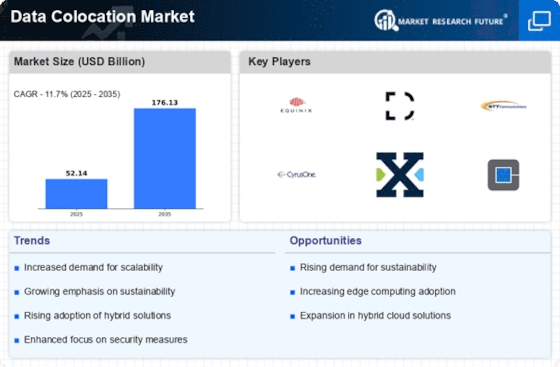
The Global data colocation Market has been segmented on the basis of service type, components, and end users. Service type includes small scale and large scale services. Components comprises of network hardware, server & storage, cooling units and others. End users includes healthcare, IT & telecom, energy, banking & insurance and government among others. Key Players The prominent players in the market of data colocation market are – Equinix, Inc.(U.S.), SunGard availability services (U.S.), CenturyLink, Inc.(U.S.), CoreSite Realty Corporation(U.S.), Global Switch Corporation (UK), KDDI Telehouse Corporation (Japan), Verizon Communication, Inc.(U.S.), Interxion Holding NV (Netherlands, Europe), DuPont Fabros Technology, Inc.(U.S.) and American Telephone & Telegraph, Inc. (U.S.) among others.
Intended Audience
Regional Analysis
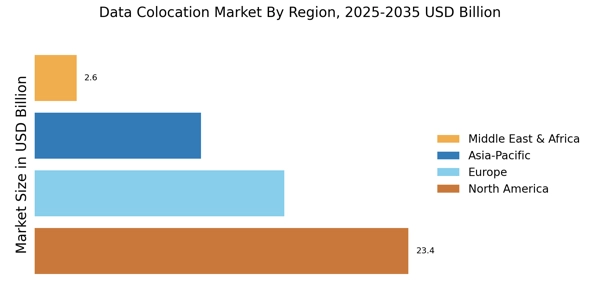
The regional analysis of data colocation market is being studied for areas such as Asia pacific, North America, Europe and rest of the world. North America is expected to dominate the data colocation market due to its increasing data center requirements in IT capacity management. The colocation providers in North America region are leveraging their advanced technological architectures which are helping in increasing their market share. Furthermore, Asia pacific region is forecast to grow in the data colocation market in upcoming years owing to the vast increase in data production and therefore migration of organizations towards cloud. The growth of Europe, on the other hand, can be attributed to show high growth opportunity in data colocation market due to the increasing investment by tech leaders into European IT market. For instance, Apple is investing to set up its data centers in Denmark and Ireland and Facebook has made investments in north Sweden for data colocation services.
Frequently Asked Questions (FAQ) :
The North American region is expected to be a major force in the global region.
SunGard availability services (U.S.), Equinix, Inc.(U.S.), CenturyLink, Inc.(U.S.), KDDI Telehouse Corporation (Japan), CoreSite Realty Corporation(U.S.), Global Switch Corporation (UK), Verizon Communication, Inc.(U.S.) are the contenders in the market.
The segments existing in the market are components, service type, and end-users.
The revenues of the market are expected to rise from USD 26 Billion in 2016 to USD 51 Billion approx. by 2022.
A 12% CAGR is predicted to drive the market progress in the coming period.
TABLE OF CONTENTS
1 MARKET INTRODUCTION
1.1 INTRODUCTION
1.2 SCOPE OF STUDY
1.2.1 RESEARCH OBJECTIVE
1.2.2 ASSUMPTIONS
1.2.3 LIMITATIONS
1.3 MARKET STRUCTURE
2 RESEARCH METHODOLOGY
2.1 RESEARCH NETWORK SOLUTION
2.2 PRIMARY RESEARCH
2.3 SECONDARY RESEARCH
2.4 FORECAST MODEL
2.4.1 MARKET DATA COLLECTION, ANALYSIS & FORECAST
2.4.2 MARKET SIZE ESTIMATION
3 MARKET DYNAMICS
3.1 INTRODUCTION
3.2 MARKET DRIVERS
3.3 MARKET CHALLENGES
3.4 MARKET OPPORTUNITIES
3.5 MARKET RESTRAINTS
4 EXECUTIVE SUMMARY
5. MARKET FACTOR ANALYSIS
5.1 PORTER’S FIVE FORCES ANALYSIS
5.2 SUPPLY CHAIN ANALYSIS
6 GLOBAL DATA COLOCATION MARKET, BY SEGMENTS
6.1 INTRODUCTION
6.2 MARKET STATISTICS
6.2.1 BY SERVICE TYPE
6.2.1.1 SMALL SCALE
6.2.1.2 LARGE SCALE
6.2.2 BY COMPONENTS
6.2.2.1 NETWORK HARDWARE
6.2.2.2 SERVER & STORAGE
6.2.2.3 COOLING UNITS
6.2.2.4 OTHERS
6.2.1 BY END USERS
6.2.2.1 BANKING & INSURANCE
6.2.2.2 IT & TELECOM
6.2.2.3 HEALTHCARE
6.2.2.4 GOVERNMENT
6.2.2.5 ENERGY
6.2.2.6 OTHERS
6.2.4 BY GEOGRAPHY
6.2.4.1 NORTH AMERICA
6.2.4.2 EUROPE
6.2.4.3 ASIA-PACIFIC
6.2.4.4 REST OF THE WORLD
7 COMPETITIVE ANALYSIS
7.1 MARKET SHARE ANALYSIS
7.2 COMPANY PROFILES
7.2.1 EQUINIX, INC. (U.S.)
7.2.2 SUNGARD AVAILABILITY SERVICES (U.S.)
7.2.3 CENTURYLINK, INC. (U.S.)
7.2.4 CORESITE REALTY CORPORATION (U.S.)
7.2.5 COLT'S MANUFACTURING COMPANY (U.S.)
7.2.6 TELEHOUSE TELECOMMUNICATIONS COMPANY (EUROPE)
7.2.7 VERIZON COMMUNICATION, INC. (U.S.)
7.2.8 INTERXION HOLDING NV (NETHERLANDS, EUROPE)
7.2.9 DUPONT FABROS TECHNOLOGY, INC. (U.S.)
7.2.10 AMERICAN TELEPHONE & TELEGRAPH, INC, (U.S.)
7.2.11 OTHERS
LIST OF TABLES
TABLE 1 GLOBAL DATA COLOCATION MARKET, BY SERVICE TYPE
TABLE 2 GLOBAL DATA COLOCATION MARKET, BY COMPONENTS
TABLE 3 GLOBAL DATA COLOCATION MARKET, BY END USERS
TABLE 4 GLOBAL DATA COLOCATION MARKET, BY REGIONS
TABLE 5 NORTH AMERICA DATA COLOCATION MARKET, BY SERVICE TYPE
TABLE 6 NORTH AMERICA DATA COLOCATION MARKET, BY COMPONENTS
TABLE 7 NORTH AMERICA DATA COLOCATION MARKET, BY END USERS
TABLE 8 U.S. DATA COLOCATION MARKET, BY SERVICE TYPE
TABLE 9 U.S. DATA COLOCATION MARKET, BY COMPONENTS
TABLE 10 U.S. DATA COLOCATION MARKET, BY END USERS
TABLE 11 CANADA DATA COLOCATION MARKET, BY SERVICE TYPE
TABLE 12 CANADA DATA COLOCATION MARKET, BY COMPONENTS
TABLE 13 CANADA DATA COLOCATION MARKET, BY END USERS
TABLE 14 EUROPE DATA COLOCATION MARKET, BY SERVICE TYPE
TABLE 15 EUROPE DATA COLOCATION MARKET, BY COMPONENTS
TABLE 16 EUROPE DATA COLOCATION MARKET, BY END USERS
TABLE 17 GERMANY DATA COLOCATION MARKET, BY SERVICE TYPE
TABLE 18 GERMANY DATA COLOCATION MARKET, BY COMPONENTS
TABLE 19 GERMANY DATA COLOCATION MARKET, BY END USERS
TABLE 20 FRANCE DATA COLOCATION MARKET, BY SERVICE TYPE
TABLE 21 FRANCE DATA COLOCATION MARKET, BY COMPONENTS
TABLE 22 FRANCE DATA COLOCATION MARKET, BY END USERS
TABLE 23 U.K. DATA COLOCATION MARKET, BY SERVICE TYPE
TABLE 24 U.K. DATA COLOCATION MARKET, BY COMPONENTS
TABLE 25 U.K. DATA COLOCATION MARKET, BY END USERS
TABLE 26 REST OF EUROPE DATA COLOCATION MARKET, BY SERVICE TYPE
TABLE 27 REST OF EUROPE DATA COLOCATION MARKET, BY COMPONENTS
TABLE 28 REST OF EUROPE DATA COLOCATION MARKET, BY END USERS
TABLE 29 ASIA-PACIFIC DATA COLOCATION MARKET, BY SERVICE TYPE
TABLE 30 ASIA-PACIFIC DATA COLOCATION MARKET, BY COMPONENTS
TABLE 31 ASIA-PACIFIC DATA COLOCATION MARKET, BY END USERS
TABLE 32 MIDDLE EAST & AFRICA DATA COLOCATION MARKET, BY SERVICE TYPE
TABLE 33 MIDDLE EAST & AFRICA DATA COLOCATION MARKET, BY COMPONENTS
TABLE 34 MIDDLE EAST & AFRICA DATA COLOCATION MARKET, BY END USERS
LIST OF FIGURES
FIGURE 1 RESEARCH NETWORK SOLUTION
FIGURE 2 GLOBAL DATA COLOCATION MARKET: BY SERVICE TYPE (%)
FIGURE 3 GLOBAL DATA COLOCATION MARKET: BY COMPONENTS (%)
FIGURE 4 GLOBAL DATA COLOCATION MARKET: BY END USERS (%)
FIGURE 5 GLOBAL DATA COLOCATION MARKET: BY REGION
FIGURE 6 NORTH AMERICA DATA COLOCATION MARKET, BY SERVICE TYPE (%)
FIGURE 7 NORTH AMERICA DATA COLOCATION MARKET, BY COMPONENTS (%)
FIGURE 8 NORTH AMERICA DATA COLOCATION MARKET, BY END USERS (%)
FIGURE 9 EUROPE DATA COLOCATION MARKET, BY SERVICE TYPE (%)
FIGURE 10 EUROPE DATA COLOCATION MARKET, BY COMPONENTS (%)
FIGURE 11 EUROPE DATA COLOCATION MARKET, BY VERTICALS (%)
FIGURE 12 ASIA-PACIFIC DATA COLOCATION MARKET, BY SERVICE TYPE (%)
FIGURE 13 ASIA-PACIFIC DATA COLOCATION MARKET, BY COMPONENTS (%)
FIGURE 14 ASIA-PACIFIC DATA COLOCATION MARKET, BY END USERS (%)
FIGURE 15 ROW DATA COLOCATION MARKET, BY SERVICE TYPE (%)
FIGURE 16 ROW DATA COLOCATION MARKET, BY COMPONENTS (%)
FIGURE 17 ROW DATA COLOCATION MARKET, BY END USERS (%)