×
  • Cat-intel
  • MedIntelliX
  • Resources
  • About Us
  • Hero Background
    English
    Chinese
    French
    Japanese
    Korean
    German
    Spanish

    Global Lubricants Market Size

    ID: MRFR/CnM/4733-CR
    100 Pages
    Chitranshi Jaiswal
    July 2018

    ASEAN, GCC, India, Africa Lubricants Market Research Report Information: Base Oil (Mineral Oil) Application (Automotive) End-user (Energy) – Forecast Till 2035

    Share:
    Download PDF ×

    We do not share your information with anyone. However, we may send you emails based on your report interest from time to time. You may contact us at any time to opt-out.

    Global Lubricants Market Infographic
    Purchase Options

    Global Lubricants Size

    Global Lubricants Market Growth Projections and Opportunities

    The lubricants market in ASEAN, GCC, Africa, and India was valued at $22.94 billion in 2017 and is predicted to reach $29.53 billion by the end of the assessment period, growing at a rate of 4.30%. In terms of volume, it was 8,115.8 KT in 2017 and is estimated to grow at 3.53% during the forecast period. Many factors are influencing this market, including the growing industrial sector in emerging economies and the increasing recognition of the benefits of synthetic oils for the environment and performance.

    Various industries like paper & mill, metal forming, foundry, mining, quarrying, energy, plastics, food & beverages, and machining are using more lubricants, contributing to the market's revenue. The automobile industry has a big impact too, especially due to the increased demand for automobiles in regions like ASEAN and India. Their growing GDP has pushed up the demand for cars, which in turn has increased the need for lubricants. Government policies, like tax benefits and incentives, are also attracting automobile companies to set up their manufacturing hubs in these regions, boosting the lubricants market further.

    The energy industry is expected to be a significant driver for lubricant demand, valued at $5.54 billion in 2017 and likely to grow at 4.64% during the assessment period. The chemical manufacturing industry is expected to have the highest growth rate at 5.62%.

    The market is divided by base oil type, application, end-use industry, and region. Base oil types include mineral oil, synthetic oil, and bio-based oil. Mineral oil was the largest segment in 2017 and is expected to grow at 4.20%. The bio-based base oil segment is likely to grow the most due to its increasing popularity. Mineral oil's lower cost and easy production are major factors driving its growth. Applications are divided into automotive lubricants and industrial lubricants. Automotive lubricants had a significant share in 2017 and are expected to maintain this trend. Within automotive lubricants, segments like engine oil, gear oil, transmission fluids, brake oil, coolants, and greases are contributing. Gear oil is projected to grow the most at 4.95%.

    Geographically, the Indian lubricant market is expected to grow the fastest during the forecast period, followed by the ASEAN region. The automobile industry's growth plays a significant role here. Additionally, the increased use of agricultural equipment, mainly in the African region, is expected to contribute significantly to market growth. Egypt had the highest share in value in 2017 and is expected to maintain this pace during the forecast period.

    Global Lubricants Market Size Graph
    Author
    Chitranshi Jaiswal
    Research Analyst Level I

    In her 3 years of experience in the market research field, she has handled critical cross-domain projects. She has an in-depth knowledge of market estimation & analysis, problem-solving, primary as well as secondary research, and team management.She holds an engineering degree and is an MBA professional from a well-known university, capable of evaluating the market and competitive conditions. An exceptional strategist with excellent communication skills and a passion for delivering cutting-edge & practical insights for the market. Proficient in multi-tasking, and can successfully deal with competing demands, while maintaining complete confidentiality. Generated business through active client and project development, networking, and high-quality responses. Her knowledge and skills have helped in making solid business decisions, securing funding from investors, and avoiding business failures.

    Leave a Comment

    FAQs

    What is the expected valuation of the ASEAN, GCC, India, Africa lubricants market?

    The ASEAN, GCC, India, Africa lubricants market is expected to touch USD 193.03 Billion by 2035.

    What is the expected growth rate of the ASEAN, GCC, India, Africa lubricants market?

    Lubricants Market is projected to grow at a CAGR of 4.32% during the forecast period, 2025-2035

    What are the drivers of the ASEAN, GCC, India, Africa lubricants market?

    Massive demand of lubricants from the automotive sector can drive the ASEAN, GCC, India, Africa lubricants market.

    What are major restraints of the ASEAN, GCC, India, Africa lubricants market?

    Disposal of lubricants and production of electric vehicles are threats for the ASEAN, GCC, India, Africa lubricants market.

    Which application within the ASEAN, GCC, India, Africa lubricants market can display a respectable growth rate?

    Lubricants Market is projected to register a CAGR of 4.32% from 2025-2035

    Who are the key players of the ASEAN, GCC, India, Africa lubricants market?

    Morris Lubricants, Valvoline, Inc., Sinopec Corporation, Lukoil, Calumet Specialty Products Partners, L.P, Chevron Corporation, Total S., Exxon Mobil Corporation, Fuchs Petrolub SE, Phillips 66 Company, Gulf Oil India, Lucas Oil Products, Inc., Yushiro Chemical Industry, Royal Dutch Shell Plc, AMSOIL INC., PetroChina Company Ltd., Clariant, BP Plc, Rock Valley Oil and Chemical Co., Quaker Chemical Corporation, Petronas, Indian Oil Corporation Limited are the key players in the ASEAN, GCC, India, Africa lubricants market.

    Market Summary

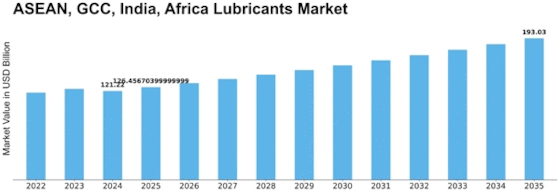
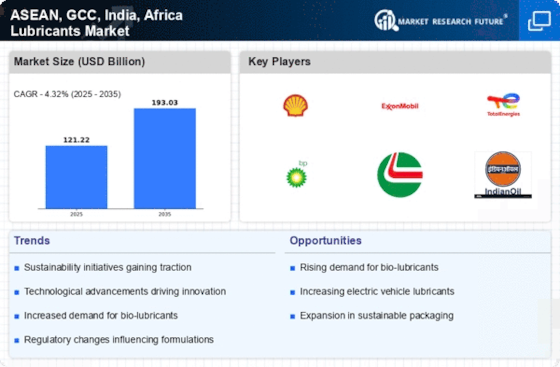
    As per MRFR analysis, the ASEAN, GCC, India, and Africa Lubricants Market Size was estimated at 121.22 USD Billion in 2024. The lubricants industry is projected to grow from 126.46 USD Billion in 2025 to 193.03 USD Billion by 2035, exhibiting a compound annual growth rate (CAGR) of 4.32 during the forecast period 2025 - 2035.

    Key Market Trends & Highlights

    The ASEAN, GCC, India, and Africa lubricants market is experiencing a transformative shift towards sustainability and advanced technologies.

    • The market is witnessing a notable shift towards synthetic lubricants, driven by their superior performance and environmental benefits.
    • Sustainability is becoming a central theme, with increasing emphasis on eco-friendly products across various sectors.
    • Technological advancements in lubrication solutions are enhancing efficiency and performance, particularly in the automotive segment.
    • Rising automotive production and industrial growth are key drivers, alongside the need for compliance with stringent regulatory standards.

    Market Size & Forecast

    2024 Market Size 121.22 (USD Billion)
    2035 Market Size 193.03 (USD Billion)
    CAGR (2025 - 2035) 4.32%
    Largest Regional Market Share in 2024 MEA

    Major Players

    <p>Shell (GB), ExxonMobil (US), TotalEnergies (FR), BP (GB), Castrol (GB), Indian Oil Corporation (IN), Petrobras (BR), Sasol (ZA), Gulf Oil (IN), Fuchs Petrolub (DE)</p>

    Market Trends

    The ASEAN, GCC, India, Africa Lubricants Market is currently experiencing a dynamic evolution, driven by various factors including industrial growth, increasing automotive production, and rising consumer awareness regarding the importance of lubrication in machinery and vehicles. The market appears to be influenced by a growing demand for high-performance lubricants, which are essential for enhancing the efficiency and longevity of engines and equipment. Additionally, the shift towards environmentally friendly products is becoming more pronounced, as consumers and industries alike seek sustainable alternatives that minimize environmental impact. This trend suggests a potential transformation in product offerings, with manufacturers likely to invest in research and development to create innovative solutions that meet these emerging needs. Moreover, the competitive landscape within the ASEAN, GCC, India, Africa Lubricants Market is intensifying, as both local and international players strive to capture market share. Strategic partnerships and collaborations are becoming increasingly common, as companies look to leverage each other's strengths and expand their reach. The regulatory environment is also evolving, with governments implementing stricter standards for lubricant quality and performance. This regulatory shift may compel manufacturers to enhance their product formulations and adhere to higher quality benchmarks, thereby fostering a more robust and competitive market environment. Overall, the ASEAN, GCC, India, Africa Lubricants Market appears poised for growth, driven by innovation, sustainability, and heightened competition.

    Shift Towards Synthetic Lubricants

    There is a noticeable trend towards the adoption of synthetic lubricants across various sectors. These products are recognized for their superior performance characteristics, including enhanced thermal stability and reduced friction. As industries increasingly prioritize efficiency and longevity, synthetic options are likely to gain traction, potentially reshaping consumer preferences.

    Emphasis on Sustainability

    Sustainability is becoming a focal point within the ASEAN, GCC, India, Africa Lubricants Market. Manufacturers are exploring bio-based and eco-friendly lubricants to meet the growing demand for environmentally responsible products. This shift may lead to the development of innovative formulations that align with global sustainability goals.

    Technological Advancements in Lubrication Solutions

    Technological innovation is playing a crucial role in the evolution of lubrication solutions. The integration of smart technologies, such as IoT and predictive maintenance, is enhancing the efficiency of lubricant usage. This trend suggests that future products may incorporate advanced features that optimize performance and reduce waste.

    Global Lubricants Market Market Drivers

    Rising Automotive Production

    The ASEAN, GCC, India, Africa Lubricants Market is experiencing a notable surge in automotive production, driven by increasing consumer demand for vehicles. In ASEAN, the automotive sector is projected to grow at a compound annual growth rate of approximately 6.5% from 2023 to 2028. This growth is likely to enhance the demand for lubricants, as vehicles require high-quality lubricants for optimal performance. Similarly, in India, the automotive industry is expected to reach a market size of USD 300 billion by 2026, further propelling lubricant consumption. The GCC region, with its focus on diversifying economies, is also witnessing a rise in automotive manufacturing, which could lead to increased lubricant sales. Consequently, the rising automotive production across these regions is a significant driver for the lubricants market.

    Increasing Demand for Renewable Energy

    The ASEAN, GCC, India, Africa Lubricants Market is witnessing a shift towards renewable energy sources, which is influencing lubricant demand. As countries in these regions invest in renewable energy projects, such as wind and solar, there is a growing need for specialized lubricants that can withstand unique operational conditions. For instance, the GCC is focusing on diversifying its energy sources, with investments in solar energy expected to reach USD 200 billion by 2030. This transition may lead to the development of new lubricant formulations tailored for renewable energy applications. In India, the government aims to achieve 175 GW of renewable energy capacity by 2022, which could further drive the demand for innovative lubrication solutions. Thus, the increasing emphasis on renewable energy is a pivotal driver for the lubricants market.

    Technological Innovations in Lubrication

    The ASEAN, GCC, India, Africa Lubricants Market is benefiting from rapid technological innovations in lubrication solutions. Advancements in formulation technology are leading to the development of high-performance lubricants that offer superior protection and efficiency. For instance, the introduction of nanotechnology in lubricant formulations is enhancing the performance characteristics of lubricants, making them more effective in extreme conditions. In India, the lubricant market is projected to grow at a CAGR of 4.5% from 2023 to 2028, driven by these technological advancements. Similarly, in the GCC, the adoption of smart lubrication systems is gaining traction, which could optimize lubricant usage and reduce waste. Therefore, technological innovations are likely to play a pivotal role in shaping the future of the lubricants market across these regions.

    Industrial Growth and Infrastructure Development

    The ASEAN, GCC, India, Africa Lubricants Market is significantly influenced by the ongoing industrial growth and infrastructure development initiatives. In India, the government has launched the National Infrastructure Pipeline, aiming to invest USD 1.4 trillion in infrastructure projects by 2025. This investment is expected to boost various industries, including manufacturing and construction, which are substantial consumers of lubricants. Similarly, in the GCC, the Vision 2030 initiative is driving infrastructure projects that require extensive lubrication solutions. ASEAN countries are also investing in infrastructure to enhance connectivity and trade, which could lead to increased lubricant demand. The industrial growth across these regions is likely to create a robust market for lubricants, as machinery and equipment require effective lubrication for efficiency and longevity.

    Regulatory Compliance and Environmental Standards

    The ASEAN, GCC, India, Africa Lubricants Market is increasingly shaped by stringent regulatory compliance and environmental standards. Governments in these regions are implementing regulations aimed at reducing emissions and promoting environmentally friendly products. For example, the European Union's REACH regulations are influencing lubricant formulations globally, including in ASEAN and GCC markets. In India, the Bureau of Indian Standards is setting guidelines for lubricant quality and environmental impact, which could lead to a shift towards bio-based and eco-friendly lubricants. As industries strive to meet these regulations, the demand for high-performance lubricants that comply with environmental standards is likely to rise. Consequently, regulatory compliance is a crucial driver for the lubricants market, pushing manufacturers to innovate and adapt their products.

    Market Segment Insights

    By Base Oil: Mineral Oil (Largest) vs. Synthetic Oil (Fastest-Growing)

    <p>In the ASEAN, GCC, India, and Africa lubricants market, the base oil segment is predominantly led by Mineral Oil, which holds a significant market share due to its widespread application in various industrial sectors. This traditional oil type is favored for its cost-effectiveness and availability, making it the first choice for many lubricant manufacturers. Synthetic Oil, although a smaller portion of the market, is gaining traction, driven by advancements in technology that enhance performance and efficiency, catering to high-end applications in automotive and industrial uses.</p>

    <p>Base Oils: Mineral Oil (Dominant) vs. Synthetic Oil (Emerging)</p>

    <p>Mineral Oil remains the dominant player in the ASEAN, GCC, India, and Africa lubricants market, characterized by its established infrastructure and strong supply chain. Its composition, derived from refining crude oil, provides significant advantages in terms of lubrication and cost. However, Synthetic Oil is emerging rapidly, primarily due to its superior performance characteristics like better thermal stability and efficiency. As environmental concerns heighten, the demand for Synthetic Oil is fueled by a shift toward eco-friendly solutions, making it a viable alternative for industries seeking sustainability in their operations.</p>

    By Application: Automotive (Largest) vs. Industrial (Fastest-Growing)

    <p>In the ASEAN, GCC, India, and Africa lubricants market, the automotive segment holds the largest share, driven by the increasing vehicle population and growing consumer preference for quality lubricants that enhance engine performance. The demand for automotive lubricants is poised for sustained growth as automotive sales continue to rise, particularly in emerging markets within this region. Meanwhile, the industrial segment is showing the fastest growth, attributed to expanding manufacturing activities and the increasing need for efficient machinery operations in various industries.</p>

    <p>Lubricants: Automotive (Dominant) vs. Industrial (Emerging)</p>

    <p>The automotive lubricants segment is characterized by a robust demand due to the continuous growth in the automotive sector, fuelled by increasing disposable incomes and a rising middle-class population. This segment is dominant, providing a wide range of products designed for various engine types. On the other hand, the industrial lubricants segment is emerging rapidly, spurred by the rise in industrial activities and the need for advanced lubrication solutions that improve equipment efficiency and reliability. As industries evolve, the demand for specialty lubricants tailored for specific applications is also growing, positioning the industrial segment as a significant player in the lubricants market.</p>

    By End-user: Food Processing (Largest) vs. Energy (Fastest-Growing)

    <p>The ASEAN, GCC, India, Africa Lubricants Market showcases a diverse distribution among various end-user segments, with Food Processing holding the largest share. This sector is pivotal due to its extensive requirements for food-grade lubricants, ensuring safety and efficiency in operations. Following closely behind is Energy, which is gaining traction with increasing investments in renewable and traditional energy sources that depend heavily on the use of high-performance lubricants to maintain operational efficiency. Growth trends indicate a robust rise in the Energy segment, driven by the global push towards sustainable energy solutions, alongside the continued expansion of the Food Processing sector due to rising consumer demands for processed foods. Additionally, regional developments, government initiatives promoting manufacturing, and a focus on improving operational efficiency across industries are propelling growth in these segments, creating opportunities for lubricant manufacturers.</p>

    <p>Food Processing (Dominant) vs. Energy (Emerging)</p>

    <p>Food Processing stands as a dominant force in the lubricants market, primarily characterized by stringent safety standards and the necessity for FDA-approved lubricants. This ensures not only optimal equipment performance but also compliance with health regulations, making it a priority for manufacturers in this industry. On the other hand, the Energy segment is emerging rapidly due to increased investments in both renewable energy sources and traditional oil and gas. As energy producers place greater emphasis on sustainability and operational efficiency, there is a growing need for specialized lubricants that can withstand extreme conditions, thus driving innovation in formulations and application processes within this sector.</p>

    Get more detailed insights about ASEAN, GCC, India, Africa lubricants Market Research Report – Forecast to 2035

    Regional Insights

    North America : Mature Market with Innovation

    The North American lubricants market is driven by technological advancements and stringent environmental regulations. The U.S. holds the largest market share at approximately 70%, followed by Canada at 15%. The demand for high-performance lubricants is increasing, fueled by the automotive and industrial sectors. Regulatory catalysts, such as the EPA's Clean Air Act, are pushing for more eco-friendly products, enhancing market growth. Leading players like ExxonMobil, BP, and Shell dominate the landscape, focusing on innovation and sustainability. The competitive environment is characterized by significant investments in R&D to develop advanced lubricants. The presence of major oil companies ensures a robust supply chain, while local players are also emerging to capture niche markets. Overall, the North American lubricants market is poised for steady growth, driven by both demand and regulatory frameworks.

    Europe : Regulatory-Driven Market Dynamics

    The European lubricants market is characterized by stringent regulations and a strong push towards sustainability. Germany and France are the largest markets, holding approximately 30% and 20% market shares, respectively. The EU's Green Deal and REACH regulations are significant drivers, promoting the use of bio-based and environmentally friendly lubricants. This regulatory landscape is fostering innovation and shifting consumer preferences towards sustainable products. Key players like TotalEnergies and BP are adapting to these changes by investing in green technologies. The competitive landscape is marked by a mix of multinational corporations and local manufacturers, all striving to meet regulatory standards. The presence of established brands ensures a high level of competition, while new entrants are focusing on niche markets, particularly in bio-lubricants. Overall, the European market is evolving rapidly, driven by regulatory pressures and sustainability goals.

    Asia-Pacific : Emerging Markets with High Demand

    The Asia-Pacific lubricants market is experiencing rapid growth, driven by industrialization and increasing automotive production. China and India are the largest markets, accounting for approximately 40% and 25% of the total market share, respectively. The rising demand for high-quality lubricants in manufacturing and automotive sectors is a key growth driver. Additionally, government initiatives to enhance infrastructure are further boosting market potential. Leading players such as Indian Oil Corporation and Castrol are expanding their presence in the region, focusing on product innovation and distribution networks. The competitive landscape is dynamic, with both The ASEAN, GCC, India, Africa Lubricants share. The increasing adoption of advanced lubricants is also evident, as consumers become more aware of the benefits of high-performance products. Overall, the Asia-Pacific market is set for significant growth, driven by demand and competitive strategies.

    Middle East and Africa : Resource-Rich Market Potential

    The Middle East and Africa lubricants market is characterized by abundant natural resources and growing industrial activities. The UAE and South Africa are the largest markets, holding approximately 35% and 20% market shares, respectively. The demand for lubricants is increasing due to the expansion of the automotive and manufacturing sectors, alongside government initiatives to diversify economies. Regulatory frameworks are also evolving to support sustainable practices in the industry. Key players like Sasol and Gulf Oil are well-positioned in the market, leveraging local resources and expertise. The competitive landscape features a mix of multinational corporations and regional players, all aiming to capture the growing demand. The presence of established brands ensures a competitive environment, while new entrants are focusing on innovative solutions to meet market needs. Overall, the Middle East and Africa market presents significant growth opportunities, driven by resource availability and industrial expansion.

    Key Players and Competitive Insights

    The ASEAN, GCC, India, and Africa lubricants market is characterized by a dynamic competitive landscape, driven by increasing industrialization, automotive growth, and a rising demand for high-performance lubricants. Key players such as Shell (GB), ExxonMobil (US), and Indian Oil Corporation (IN) are strategically positioned to leverage these growth drivers. Shell (GB) focuses on innovation and sustainability, investing heavily in developing eco-friendly lubricants, while ExxonMobil (US) emphasizes digital transformation and advanced supply chain solutions to enhance operational efficiency. Indian Oil Corporation (IN) is expanding its regional footprint through strategic partnerships and local manufacturing initiatives, which collectively shape a competitive environment that is increasingly focused on sustainability and technological advancement.

    The market structure appears moderately fragmented, with a mix of multinational corporations and regional players. Key business tactics include localizing manufacturing to reduce costs and optimize supply chains, which is essential in a market where logistics can significantly impact profitability. The collective influence of major players fosters a competitive atmosphere where innovation and customer-centric strategies are paramount, as companies strive to differentiate themselves in a crowded marketplace.

    In August 2025, Shell (GB) announced the launch of a new line of biodegradable lubricants aimed at reducing environmental impact. This strategic move not only aligns with global sustainability trends but also positions Shell as a leader in eco-friendly solutions, potentially attracting environmentally conscious consumers and businesses. The introduction of these products may enhance Shell's market share in regions where regulatory pressures for sustainability are increasing.

    In September 2025, ExxonMobil (US) unveiled a state-of-the-art digital platform designed to optimize lubricant supply chains across the ASEAN region. This initiative is significant as it leverages advanced analytics and AI to improve inventory management and distribution efficiency. By enhancing operational capabilities, ExxonMobil is likely to strengthen its competitive edge, particularly in markets where timely delivery and product availability are critical.

    In July 2025, Indian Oil Corporation (IN) entered into a strategic partnership with a local manufacturer in Africa to enhance its lubricant production capabilities. This collaboration is indicative of a broader trend where companies seek to localize operations to better serve regional markets. By establishing a manufacturing presence in Africa, Indian Oil Corporation may not only reduce costs but also improve its responsiveness to local demand, thereby solidifying its market position.

    As of October 2025, the competitive trends in the lubricants market are increasingly defined by digitalization, sustainability, and the integration of AI technologies. Strategic alliances are becoming more prevalent, as companies recognize the value of collaboration in navigating complex market dynamics. Looking ahead, competitive differentiation is likely to evolve from traditional price-based strategies to a focus on innovation, technological advancements, and supply chain reliability, reflecting a shift in consumer expectations and regulatory landscapes.

    Key Companies in the Global Lubricants Market market include

    Industry Developments

    Future Outlook

    Global Lubricants Market Future Outlook

    <p>The ASEAN, GCC, India, and Africa lubricants market is projected to grow at a 4.32% CAGR from 2024 to 2035, driven by industrialization, automotive demand, and technological advancements.</p>

    New opportunities lie in:

    • <p>Expansion of bio-lubricants product lines to meet sustainability demands.</p>
    • <p>Development of smart lubricant monitoring systems for predictive maintenance.</p>
    • <p>Investment in regional distribution centers to enhance supply chain efficiency.</p>

    <p>By 2035, the lubricants market is expected to exhibit robust growth, driven by innovation and strategic investments.</p>

    Market Segmentation

    Global Lubricants Market Base Oil Outlook

    • Mineral Oil
    • Synthetic Oil
    • Bio-based Oil

    Global Lubricants Market End-user Outlook

    • Food Processing
    • Construction and Mining
    • Metal Production
    • Cement Production
    • Textile
    • General Industrial Manufacturing
    • Chemical Manufacturing
    • Energy

    Global Lubricants Market Application Outlook

    • Automotive
    • Industrial

    Report Scope

    MARKET SIZE 2024121.22(USD Billion)
    MARKET SIZE 2025126.46(USD Billion)
    MARKET SIZE 2035193.03(USD Billion)
    COMPOUND ANNUAL GROWTH RATE (CAGR)4.32% (2024 - 2035)
    REPORT COVERAGERevenue Forecast, Competitive Landscape, Growth Factors, and Trends
    BASE YEAR2024
    Market Forecast Period2025 - 2035
    Historical Data2019 - 2024
    Market Forecast UnitsUSD Billion
    Key Companies ProfiledMarket analysis in progress
    Segments CoveredMarket segmentation analysis in progress
    Key Market OpportunitiesGrowing demand for bio-based lubricants driven by environmental regulations and consumer preferences in ASEAN, GCC, India, Africa Lubricants Market.
    Key Market DynamicsRising demand for bio-based lubricants reflects shifting consumer preferences towards sustainable and environmentally friendly products.
    Countries CoveredNorth America, Europe, APAC, South America, MEA

    FAQs

    What is the expected valuation of the ASEAN, GCC, India, Africa lubricants market?

    The ASEAN, GCC, India, Africa lubricants market is expected to touch USD 193.03 Billion by 2035.

    What is the expected growth rate of the ASEAN, GCC, India, Africa lubricants market?

    Lubricants Market is projected to grow at a CAGR of 4.32% during the forecast period, 2025-2035

    What are the drivers of the ASEAN, GCC, India, Africa lubricants market?

    Massive demand of lubricants from the automotive sector can drive the ASEAN, GCC, India, Africa lubricants market.

    What are major restraints of the ASEAN, GCC, India, Africa lubricants market?

    Disposal of lubricants and production of electric vehicles are threats for the ASEAN, GCC, India, Africa lubricants market.

    Which application within the ASEAN, GCC, India, Africa lubricants market can display a respectable growth rate?

    Lubricants Market is projected to register a CAGR of 4.32% from 2025-2035

    Who are the key players of the ASEAN, GCC, India, Africa lubricants market?

    Morris Lubricants, Valvoline, Inc., Sinopec Corporation, Lukoil, Calumet Specialty Products Partners, L.P, Chevron Corporation, Total S., Exxon Mobil Corporation, Fuchs Petrolub SE, Phillips 66 Company, Gulf Oil India, Lucas Oil Products, Inc., Yushiro Chemical Industry, Royal Dutch Shell Plc, AMSOIL INC., PetroChina Company Ltd., Clariant, BP Plc, Rock Valley Oil and Chemical Co., Quaker Chemical Corporation, Petronas, Indian Oil Corporation Limited are the key players in the ASEAN, GCC, India, Africa lubricants market.

    1. Report Prologue
      1. \r\n
      2. \r\n
      3. \r\n
      4. \r\n2
      5. Market Introduction
      6. \r\n
      7. \r\n2.1 Introduction
      8. \r\n
      9. \r\n2.2
      10. Assumptions & Limitations
      11. \r\n
      12. \r\n3 Research Methodology
      13. \r\n
      14. \r\n3.1
      15. Research Process
      16. \r\n
      17. \r\n3.2 Primary Research
      18. \r\n
      19. \r\n3.3
      20. Secondary Research
      21. \r\n
      22. \r\n3.4 Market Size Estimation
      23. \r\n
      24. \r\n4
      25. Market Dynamics
      26. \r\n
      27. \r\n4.1 Introduction
      28. \r\n
      29. \r\n4.2
      30. Drivers
      31. \r\n
      32. \r\n4.2.1 Increasing Demand From The Automotive Industry
      33. In ASEAN & South Africa
      34. \r\n
      35. \r\n4.2.2 Strong Performance
      36. Of Industrial Sector And Wide Application Scope Of Lubricants
      37. \r\n
      38. \r\n4.2.3
      39. Increasing Awareness Linked With Strict Governmental Regulations Surging The Sales
      40. Ofsynthetic Lubricants
      41. \r\n
      42. \r\n4.3 Restraints
      43. \r\n
      44. \r\n4.3.1
      45. Rising Environmental Concerns Regarding Usage, Disposal, And Recycling Of Lubricants
      46. \r\n
      47. \r\n4.3.2
      48. Increasing Prevalence Of Electric Vehicles Resulting In Declining Demand
      49. \r\n
      50. \r\n4.4
      51. Trends & Opportunities
      52. \r\n
      53. \r\n4.4.1 Significant FDI In The
      54. ASEAN Industrial Sector
      55. \r\n
      56. \r\n4.4.2 Sanguine Demand For Agricultural
      57. Equipment In African Region To Offer Lucrative Opportunities
      58. \r\n
      59. \r\n4.5
      60. Challenge
      61. \r\n
      62. \r\n4.5.1 High Cost Of Bio-Based Lubricants
      63. \r\n
      64. \r\n5
      65. Market Factor Analysis
      66. \r\n
      67. \r\n5.1 Supply Chain Analysis
      68. \r\n
      69. \r\n5.1.1
      70. Raw Material Suppliers
      71. \r\n
      72. \r\n5.1.2 Lubriacants Producers
      73. \r\n
      74. \r\n5.1.3
      75. Distributors
      76. \r\n
      77. \r\n5.1.4 End Use Industries
      78. \r\n
      79. \r\n5.2
      80. Porter’s Five Forces Model
      81. \r\n
      82. \r\n5.2.1 Bargaining Power
      83. Of Suppliers
      84. \r\n
      85. \r\n5.2.2 Bargaining Power Of Buyers
      86. \r\n
      87. \r\n5.2.3
      88. Threat Of New Entrants
      89. \r\n
      90. \r\n5.2.4 Threat Of Substitutes
      91. \r\n
      92. \r\n5.2.5
      93. Intensity Of Rivalry
      94. \r\n
      95. \r\n6 ASEAN, Africa, India, & G.C.C.
    2. Lubricants Market, By Base Oil
      1. \r\n
      2. \r\n6.1 Overview
      3. \r\n
      4. \r\n6.1.1
      5. Mineral Oil
      6. \r\n
      7. \r\n6.1.1.1 Market Estimates & Forecast,
      8. \r\n
      9. \r\n6.1.1.2 Market Estimates & Forecast By
      10. Region/Country, 2020-2027
      11. \r\n
      12. \r\n6.1.2 Synthetic Oil
      13. \r\n
      14. \r\n6.1.2.1
      15. Market Estimates & Forecast, 2020-2027
      16. \r\n
      17. \r\n6.1.2.2 Market
      18. Estimates & Forecast By Region/Country, 2020-2027
      19. \r\n
      20. \r\n6.1.3
      21. Bio Based Oil
      22. \r\n
      23. \r\n6.1.3.1 Market Estimates & Forecast,
      24. \r\n
      25. \r\n6.1.3.2 Market Estimates & Forecast By
      26. Region/Country, 2020-2027
      27. \r\n
      28. \r\n7 ASEAN, Africa, India, &
    3. G.C.C. Lubricants Market, By Application
      1. \r\n
      2. \r\n7.1 Overview
      3. \r\n
      4. \r\n7.1.1
      5. Automotive
      6. \r\n
      7. \r\n7.1.1.1 Market Estimates & Forecast, 2020-2027
      8. \r\n
      9. \r\n7.1.1.2
      10. Market Estimates & Forecast By Region/Country, 2020-2027
      11. \r\n
      12. \r\n7.1.1.3
      13. Engine Oil
      14. \r\n
      15. \r\n7.1.1.3.1 Market Estimates & Forecast,
      16. \r\n
      17. \r\n7.1.1.3.2 Market Estimates & Forecast By
      18. Region/Country, 2020-2027
      19. \r\n
      20. \r\n7.1.1.4 Gear Oil
      21. \r\n
      22. \r\n7.1.1.4.1
      23. Market Estimates & Forecast, 2020-2027
      24. \r\n
      25. \r\n7.1.1.4.2
      26. Market Estimates & Forecast By Region/Country, 2020-2027
      27. \r\n
      28. \r\n7.1.1.5
      29. Transmission Fluids
      30. \r\n
      31. \r\n7.1.1.5.1 Market Estimates &
      32. Forecast, 2020-2027
      33. \r\n
      34. \r\n7.1.1.5.2 Market Estimates &
      35. Forecast By Region/Country, 2020-2027
      36. \r\n
      37. \r\n7.1.1.6 Break Oil
      38. \r\n
      39. \r\n7.1.1.6.1
      40. Market Estimates & Forecast, 2020-2027
      41. \r\n
      42. \r\n7.1.1.6.2
      43. Market Estimates & Forecast By Region/Country, 2020-2027
      44. \r\n
      45. \r\n7.1.1.7
      46. Coolants
      47. \r\n
      48. \r\n7.1.1.7.1 Market Estimates & Forecast, 2020-2027
      49. \r\n
      50. \r\n7.1.1.7.2
      51. Market Estimates & Forecast By Region/Country, 2020-2027
      52. \r\n
      53. \r\n7.1.1.8
      54. Greases
      55. \r\n
      56. \r\n7.1.1.8.1 Market Estimates & Forecast, 2020-2027
      57. \r\n
      58. \r\n7.1.1.8.2
      59. Market Estimates & Forecast By Region/Country, 2020-2027
      60. \r\n
      61. \r\n7.1.2
      62. Industrial
      63. \r\n
      64. \r\n7.1.2.1 Market Estimates & Forecast, 2020-2027
      65. \r\n
      66. \r\n7.1.2.2
      67. Market Estimates & Forecast By Region/Country, 2020-2027
      68. \r\n
      69. \r\n7.1.2.3
      70. Process Oil
      71. \r\n
      72. \r\n7.1.2.3.1 Market Estimates & Forecast,
      73. \r\n
      74. \r\n7.1.2.3.2 Market Estimates & Forecast By
      75. Region/Country, 2020-2027
      76. \r\n
      77. \r\n7.1.2.4 General Industrial
      78. Oil
      79. \r\n
      80. \r\n7.1.2.4.1 Market Estimates & Forecast, 2020-2027
      81. \r\n
      82. \r\n7.1.2.4.2
      83. Market Estimates & Forecast By Region/Country, 2020-2027
      84. \r\n
      85. \r\n7.1.2.5
      86. Metal Working Fluids
      87. \r\n
      88. \r\n7.1.2.5.1 Market Estimates &
      89. Forecast, 2020-2027
      90. \r\n
      91. \r\n7.1.2.5.2 Market Estimates &
      92. Forecast By Region/Country, 2020-2027
      93. \r\n
      94. \r\n7.1.2.6 Industrial
      95. Engine Oil
      96. \r\n
      97. \r\n7.1.2.6.1 Market Estimates & Forecast,
      98. \r\n
      99. \r\n7.1.2.6.2 Market Estimates & Forecast By
      100. Region/Country, 2020-2027
      101. \r\n
      102. \r\n7.1.2.7 Compressor Oil
      103. \r\n
      104. \r\n7.1.2.7.1
      105. Market Estimates & Forecast, 2020-2027
      106. \r\n
      107. \r\n7.1.2.7.2
      108. Market Estimates & Forecast By Region/Country, 2020-2027
      109. \r\n
      110. \r\n7.1.2.8
      111. Greases
      112. \r\n
      113. \r\n7.1.2.8.1 Market Estimates & Forecast, 2020-2027
      114. \r\n
      115. \r\n7.1.2.8.2
      116. Market Estimates & Forecast By Region/Country, 2020-2027
      117. \r\n
      118. \r\n7.1.2.9
      119. Hydraulic Oil
      120. \r\n
      121. \r\n7.1.2.9.1 Market Estimates & Forecast,
      122. \r\n
      123. \r\n7.1.2.9.2 Market Estimates & Forecast By
      124. Region/Country, 2020-2027
      125. \r\n
      126. \r\n7.1.2.10 Turbine Oil
      127. \r\n
      128. \r\n7.1.2.10.1
      129. Market Estimates & Forecast, 2020-2027
      130. \r\n
      131. \r\n7.1.2.10.2
      132. Market Estimates & Forecast By Region/Country, 2020-2027
      133. \r\n
      134. \r\n7.1.2.11
      135. Others
      136. \r\n
      137. \r\n7.1.2.11.1 Market Estimates & Forecast, 2020-2027
      138. \r\n
      139. \r\n7.1.2.11.2
      140. Market Estimates & Forecast By Region/Country, 2020-2027
      141. \r\n
      142. \r\n7.1.3
      143. Marine
      144. \r\n
      145. \r\n7.1.3.1 Market Estimates & Forecast, 2020-2027
      146. \r\n
      147. \r\n7.1.3.2
      148. Market Estimates & Forecast By Region/Country, 2020-2027
      149. \r\n
      150. \r\n7.1.3.3
      151. Engine Oil
      152. \r\n
      153. \r\n7.1.3.3.1 Market Estimates & Forecast,
      154. \r\n
      155. \r\n7.1.3.3.2 Market Estimates & Forecast By
      156. Region/Country, 2020-2027
      157. \r\n
      158. \r\n7.1.3.4 Hydraulic Oil
      159. \r\n
      160. \r\n7.1.3.4.1
      161. Market Estimates & Forecast, 2020-2027
      162. \r\n
      163. \r\n7.1.3.4.2
      164. Market Estimates & Forecast By Region/Country, 2020-2027
      165. \r\n
      166. \r\n7.1.3.5
      167. Gear Oil
      168. \r\n
      169. \r\n7.1.3.5.1 Market Estimates & Forecast, 2020-2027
      170. \r\n
      171. \r\n7.1.3.5.2
      172. Market Estimates & Forecast By Region/Country, 2020-2027
      173. \r\n
      174. \r\n7.1.3.6
      175. Turbine Oil
      176. \r\n
      177. \r\n7.1.3.6.1 Market Estimates & Forecast,
      178. \r\n
      179. \r\n7.1.3.6.2 Market Estimates & Forecast By
      180. Region/Country, 2020-2027
      181. \r\n
      182. \r\n7.1.3.7 Greases
      183. \r\n
      184. \r\n7.1.3.7.1
      185. Market Estimates & Forecast, 2020-2027
      186. \r\n
      187. \r\n7.1.3.7.2
      188. Market Estimates & Forecast By Region/Country, 2020-2027
      189. \r\n
      190. \r\n7.1.3.8
      191. Others
      192. \r\n
      193. \r\n7.1.3.8.1 Market Estimates & Forecast, 2020-2027
      194. \r\n
      195. \r\n7.1.3.8.2
      196. Market Estimates & Forecast By Region/Country, 2020-2027
      197. \r\n
      198. \r\n8
    4. ASEAN, Africa, India, & G.C.C. Lubricants Market, By End Use
      1. \r\n
      2. \r\n8.1
      3. Overview
      4. \r\n
      5. \r\n8.1.1 Metal Production
      6. \r\n
      7. \r\n8.1.1.1
      8. Market Estimates & Forecast, 2020-2027
      9. \r\n
      10. \r\n8.1.1.2 Market
      11. Estimates & Forecast By Region/Country, 2020-2027
      12. \r\n
      13. \r\n8.1.2
      14. Textile
      15. \r\n
      16. \r\n8.1.2.1 Market Estimates & Forecast, 2020-2027
      17. \r\n
      18. \r\n8.1.2.2
      19. Market Estimates & Forecast By Region/Country, 2020-2027
      20. \r\n
      21. \r\n8.1.2.3
      22. Textile Composites
      23. \r\n
      24. \r\n8.1.2.3.1 Market Estimates & Forecast,
      25. \r\n
      26. \r\n8.1.2.3.2 Market Estimates & Forecast By
      27. Region/Country, 2020-2027
      28. \r\n
      29. \r\n8.1.2.4 Textile Finishing
      30. \r\n
      31. \r\n8.1.2.4.1
      32. Market Estimates & Forecast, 2020-2027
      33. \r\n
      34. \r\n8.1.2.4.2
      35. Market Estimates & Forecast By Region/Country, 2020-2027
      36. \r\n
      37. \r\n8.1.2.5
      38. Textile Weaving
      39. \r\n
      40. \r\n8.1.2.5.1 Market Estimates & Forecast,
      41. \r\n
      42. \r\n8.1.2.5.2 Market Estimates & Forecast By
      43. Region/Country, 2020-2027
      44. \r\n
      45. \r\n8.1.2.6 Other Textile Applications
      46. \r\n
      47. \r\n8.1.2.6.1
      48. Market Estimates & Forecast, 2020-2027
      49. \r\n
      50. \r\n8.1.2.6.2
      51. Market Estimates & Forecast By Region/Country, 2020-2027
      52. \r\n
      53. \r\n8.1.3
      54. Energy
      55. \r\n
      56. \r\n8.1.3.1 Market Estimates & Forecast, 2020-2027
      57. \r\n
      58. \r\n8.1.3.2
      59. Market Estimates & Forecast By Region/Country, 2020-2027
      60. \r\n
      61. \r\n8.1.3.3
      62. LNG (Liquid Natural Gas)
      63. \r\n
      64. \r\n8.1.3.3.1 Market Estimates &
      65. Forecast, 2020-2027
      66. \r\n
      67. \r\n8.1.3.3.2 Market Estimates &
      68. Forecast By Region/Country, 2020-2027
      69. \r\n
      70. \r\n8.1.3.4 Piplines
      71. \r\n
      72. \r\n8.1.3.4.1
      73. Market Estimates & Forecast, 2020-2027
      74. \r\n
      75. \r\n8.1.3.4.2
      76. Market Estimates & Forecast By Region/Country, 2020-2027
      77. \r\n
      78. \r\n8.1.3.5
      79. Ocean Energy
      80. \r\n
      81. \r\n8.1.3.5.1 Market Estimates & Forecast,
      82. \r\n
      83. \r\n8.1.3.5.2 Market Estimates & Forecast By
      84. Region/Country, 2020-2027
      85. \r\n
      86. \r\n8.1.3.6 Other Energy Applications
      87. \r\n
      88. \r\n8.1.3.6.1
      89. Market Estimates & Forecast, 2020-2027
      90. \r\n
      91. \r\n8.1.3.6.2
      92. Market Estimates & Forecast By Region/Country, 2020-2027
      93. \r\n
      94. \r\n8.1.4
      95. Chemical Manufacturing
      96. \r\n
      97. \r\n8.1.4.1 Market Estimates &
      98. Forecast, 2020-2027
      99. \r\n
      100. \r\n8.1.4.2 Market Estimates & Forecast
      101. By Region/Country, 2020-2027
      102. \r\n
      103. \r\n8.1.4.3 Industrial Gas
      104. \r\n
      105. \r\n8.1.4.3.1
      106. Market Estimates & Forecast, 2020-2027
      107. \r\n
      108. \r\n8.1.4.3.2
      109. Market Estimates & Forecast By Region/Country, 2020-2027
      110. \r\n
      111. \r\n8.1.4.4
      112. Fertilizers
      113. \r\n
      114. \r\n8.1.4.4.1 Market Estimates & Forecast,
      115. \r\n
      116. \r\n8.1.4.4.2 Market Estimates & Forecast By
      117. Region/Country, 2020-2027
      118. \r\n
      119. \r\n8.1.4.5 Polymer
      120. \r\n
      121. \r\n8.1.4.5.1
      122. Market Estimates & Forecast, 2020-2027
      123. \r\n
      124. \r\n8.1.4.5.2
      125. Market Estimates & Forecast By Region/Country, 2020-2027
      126. \r\n
      127. \r\n8.1.4.6
      128. Other Chemical Manufacturing
      129. \r\n
      130. \r\n8.1.4.6.1 Market Estimates
      131. & Forecast, 2020-2027
      132. \r\n
      133. \r\n8.1.4.6.2 Market Estimates
      134. & Forecast By Region/Country, 2020-2027
      135. \r\n
      136. \r\n8.1.5 Food
      137. Processing
      138. \r\n
      139. \r\n8.1.5.1 Market Estimates & Forecast, 2020-2027
      140. \r\n
      141. \r\n8.1.5.2
      142. Market Estimates & Forecast By Region/Country, 2020-2027
      143. \r\n
      144. \r\n8.1.5.3
      145. Frozen Food
      146. \r\n
      147. \r\n8.1.5.5.1 Market Estimates & Forecast,
      148. \r\n
      149. \r\n8.1.5.5.2 Market Estimates & Forecast By
      150. Region/Country, 2020-2027
      151. \r\n
      152. \r\n8.1.5.4 Beverages
      153. \r\n
      154. \r\n8.1.5.4.1
      155. Market Estimates & Forecast, 2020-2027
      156. \r\n
      157. \r\n8.1.5.4.2
      158. Market Estimates & Forecast By Region/Country, 2020-2027
      159. \r\n
      160. \r\n8.1.5.5
      161. Processed Food
      162. \r\n
      163. \r\n8.1.5.5.1 Market Estimates & Forecast,
      164. \r\n
      165. \r\n8.1.5.5.2 Market Estimates & Forecast By
      166. Region/Country, 2020-2027
      167. \r\n
      168. \r\n8.1.5.6 Other Food Applications
      169. \r\n
      170. \r\n8.1.5.6.1
      171. Market Estimates & Forecast, 2020-2027
      172. \r\n
      173. \r\n8.1.5.6.2
      174. Market Estimates & Forecast By Region/Country, 2020-2027
      175. \r\n
      176. \r\n8.1.6
      177. Construction & Mining
      178. \r\n
      179. \r\n8.1.6.1 Market Estimates &
      180. Forecast, 2020-2027
      181. \r\n
      182. \r\n8.1.6.2 Market Estimates & Forecast
      183. By Region/Country, 2020-2027
      184. \r\n
      185. \r\n8.1.7 Cement Production
      186. \r\n
      187. \r\n8.1.7.1
      188. Market Estimates & Forecast, 2020-2027
      189. \r\n
      190. \r\n8.1.7.2 Market
      191. Estimates & Forecast By Region/Country, 2020-2027
      192. \r\n
      193. \r\n8.1.8
      194. General Industrial Manufacturing
      195. \r\n
      196. \r\n8.1.8.1 Market Estimates
      197. & Forecast, 2020-2027
      198. \r\n
      199. \r\n8.1.8.2 Market Estimates &
      200. Forecast By Region/Country, 2020-2027
      201. \r\n
      202. \r\n9 ASEAN, Africa,
    5. India, & G.C.C. Lubricants Market, By Region
      1. \r\n
      2. \r\n9.1
      3. Overview
      4. \r\n
      5. \r\n9.2 India
      6. \r\n
      7. \r\n9.2.1 Market
      8. Estimates & Forecast By Base Oil, 2020-2027
      9. \r\n
      10. \r\n9.2.2
      11. Market Estimates & Forecast By Application, 2020-2027
      12. \r\n
      13. \r\n9.2.3
      14. Market Estimates & Forecast By End Use, 2020-2027
      15. \r\n
      16. \r\n9.3
      17. ASEAN
      18. \r\n
    6. \r\n9.3.1 Market Estimates & Forecast, By Country,
      1. \r\n
      2. \r\n9.3.2 Market Estimates & Forecast By Base
      3. Oil, 2020-2027
      4. \r\n
      5. \r\n9.3.3 Market Estimates & Forecast
      6. By Application, 2020-2027
      7. \r\n
      8. \r\n9.3.4 Market Estimates &
      9. Forecast By End Use, 2020-2027
      10. \r\n
      11. \r\n9.3.4.1 Malaysia
      12. \r\n
      13. \r\n9.3.4.1.1
      14. Market Estimates & Forecast By Base Oil, 2020-2027
      15. \r\n
      16. \r\n9.3.4.1.2
      17. Market Estimates & Forecast By Application, 2020-2027
      18. \r\n
      19. \r\n9.3.4.1.3
      20. Market Estimates & Forecast By End Use, 2020-2027
      21. \r\n
      22. \r\n9.3.4.2
      23. Thailand
      24. \r\n
      25. \r\n9.3.4.2.1 Market Estimates & Forecast By
      26. Base Oil, 2020-2027
      27. \r\n
      28. \r\n9.3.4.2.2 Market Estimates &
      29. Forecast By Application, 2020-2027
      30. \r\n
      31. \r\n9.3.4.2.3 Market Estimates
      32. & Forecast By End Use, 2020-2027
      33. \r\n
      34. \r\n9.3.4.3 Singapore
      35. \r\n
      36. \r\n9.3.4.3.1
      37. Market Estimates & Forecast By Base Oil, 2020-2027
      38. \r\n
      39. \r\n9.3.4.3.2
      40. Market Estimates & Forecast By Application, 2020-2027
      41. \r\n
      42. \r\n9.3.4.3.3
      43. Market Estimates & Forecast By End Use, 2020-2027
      44. \r\n
      45. \r\n9.3.4.4
      46. Indonesia
      47. \r\n
      48. \r\n9.3.4.4.1 Market Estimates & Forecast By
      49. Base Oil, 2020-2027
      50. \r\n
      51. \r\n9.3.4.4.2 Market Estimates &
      52. Forecast By Application, 2020-2027
      53. \r\n
      54. \r\n9.3.4.4.3 Market Estimates
      55. & Forecast By End Use, 2020-2027
      56. \r\n
      57. \r\n9.3.4.5 Vietnam
      58. \r\n
      59. \r\n9.3.4.5.1
      60. Market Estimates & Forecast By Base Oil, 2020-2027
      61. \r\n
      62. \r\n9.3.4.5.2
      63. Market Estimates & Forecast By Application, 2020-2027
      64. \r\n
      65. \r\n9.3.4.5.3
      66. Market Estimates & Forecast By End Use, 2020-2027
      67. \r\n
      68. \r\n9.3.4.6
      69. Rest Of ASEAN
      70. \r\n
      71. \r\n9.3.4.6.1 Market Estimates & Forecast
      72. By Base Oil, 2020-2027
      73. \r\n
      74. \r\n9.3.4.6.2 Market Estimates &
      75. Forecast By Application, 2020-2027
      76. \r\n
      77. \r\n9.3.4.6.3 Market Estimates
      78. & Forecast By End Use, 2020-2027
      79. \r\n
      80. \r\n9.4 Africa
      81. \r\n
      82. \r\n9.4.1
    7. Market Estimates & Forecast, By Country, 2020-2027
      1. \r\n
      2. \r\n9.4.2
      3. Market Estimates & Forecast By Base Oil, 2020-2027
      4. \r\n
      5. \r\n9.4.3
      6. Market Estimates & Forecast By Application, 2020-2027
      7. \r\n
      8. \r\n9.4.4
      9. Market Estimates & Forecast By End Use, 2020-2027
      10. \r\n
      11. \r\n9.4.4.1
      12. South Africa
      13. \r\n
      14. \r\n9.4.4.1.1 Market Estimates & Forecast
      15. By Base Oil, 2020-2027
      16. \r\n
      17. \r\n9.4.4.1.2 Market Estimates &
      18. Forecast By Application, 2020-2027
      19. \r\n
      20. \r\n9.4.4.1.3 Market Estimates
      21. & Forecast By End Use, 2020-2027
      22. \r\n
      23. \r\n9.4.4.2 Rest Of
      24. North Africa
      25. \r\n
      26. \r\n9.4.4.2.1 Market Estimates & Forecast
      27. By Base Oil, 2020-2027
      28. \r\n
      29. \r\n9.4.4.2.2 Market Estimates &
      30. Forecast By Application, 2020-2027
      31. \r\n
      32. \r\n9.4.4.2.3 Market Estimates
      33. & Forecast By End Use, 2020-2027
      34. \r\n
      35. \r\n9.4.4.3 Nigeria
      36. \r\n
      37. \r\n9.4.4.3.1
      38. Market Estimates & Forecast By Base Oil, 2020-2027
      39. \r\n
      40. \r\n9.4.4.3.2
      41. Market Estimates & Forecast By Application, 2020-2027
      42. \r\n
      43. \r\n9.4.4.3.3
      44. Market Estimates & Forecast By End Use, 2020-2027
      45. \r\n
      46. \r\n9.4.4.4
      47. Tanzania
      48. \r\n
      49. \r\n9.4.4.4.1 Market Estimates & Forecast By
      50. Base Oil, 2020-2027
      51. \r\n
      52. \r\n9.4.4.4.2 Market Estimates &
      53. Forecast By Application, 2020-2027
      54. \r\n
      55. \r\n9.4.4.4.3 Market Estimates
      56. & Forecast By End Use, 2020-2027
      57. \r\n
      58. \r\n9.4.4.5 Kenya
      59. \r\n
      60. \r\n9.4.4.5.1
      61. Market Estimates & Forecast By Base Oil, 2020-2027
      62. \r\n
      63. \r\n9.4.4.5.2
      64. Market Estimates & Forecast By Application, 2020-2027
      65. \r\n
      66. \r\n9.4.4.5.3
      67. Market Estimates & Forecast By End Use, 2020-2027
      68. \r\n
      69. \r\n9.4.4.6
      70. Egypt
      71. \r\n
      72. \r\n9.5.4.6.1 Market Estimates & Forecast By Base
      73. Oil, 2020-2027
      74. \r\n
      75. \r\n9.5.4.6.2 Market Estimates & Forecast
      76. By Application, 2020-2027
      77. \r\n
      78. \r\n9.5.4.6.3 Market Estimates
      79. & Forecast By End Use, 2020-2027
      80. \r\n
      81. \r\n9.4.4.7 Ghana
      82. \r\n
      83. \r\n9.5.4.7.1
      84. Market Estimates & Forecast By Base Oil, 2020-2027
      85. \r\n
      86. \r\n9.5.4.7.2
      87. Market Estimates & Forecast By Application, 2020-2027
      88. \r\n
      89. \r\n9.5.4.7.3
      90. Market Estimates & Forecast By End Use, 2020-2027
      91. \r\n
      92. \r\n9.4.4.8
      93. Rest Of Africa
      94. \r\n
      95. \r\n9.5.4.8.1 Market Estimates & Forecast
      96. By Base Oil, 2020-2027
      97. \r\n
      98. \r\n9.5.4.8.2 Market Estimates &
      99. Forecast By Application, 2020-2027
      100. \r\n
      101. \r\n9.5.4.8.3 Market Estimates
      102. & Forecast By End Use, 2020-2027
      103. \r\n
      104. \r\n9.5 G.C.C.
      105. \r\n
      106. \r\n9.5.1
    8. Market Estimates & Forecast, By Country, 2020-2027
      1. \r\n
      2. \r\n9.5.2
      3. Market Estimates & Forecast By Base Oil, 2020-2027
      4. \r\n
      5. \r\n9.5.3
      6. Market Estimates & Forecast By Application, 2020-2027
      7. \r\n
      8. \r\n9.5.4
      9. Market Estimates & Forecast By End Use, 2020-2027
      10. \r\n
      11. \r\n9.5.4.1
      12. Saudi Arabia
      13. \r\n
      14. \r\n9.5.4.1.1 Market Estimates & Forecast
      15. By Base Oil, 2020-2027
      16. \r\n
      17. \r\n9.5.4.1.2 Market Estimates &
      18. Forecast By Application, 2020-2027
      19. \r\n
      20. \r\n9.5.4.1.3 Market Estimates
      21. & Forecast By End Use, 2020-2027
      22. \r\n
      23. \r\n9.5.4.2 UAE
      24. \r\n
      25. \r\n9.5.4.2.1
      26. Market Estimates & Forecast By Base Oil, 2020-2027
      27. \r\n
      28. \r\n9.5.4.2.2
      29. Market Estimates & Forecast By Application, 2020-2027
      30. \r\n
      31. \r\n9.5.4.2.3
      32. Market Estimates & Forecast By End Use, 2020-2027
      33. \r\n
      34. \r\n9.5.4.3
      35. Qatar
      36. \r\n
      37. \r\n9.5.4.3.1 Market Estimates & Forecast By Base
      38. Oil, 2020-2027
      39. \r\n
      40. \r\n9.5.4.3.2 Market Estimates & Forecast
      41. By Application, 2020-2027
      42. \r\n
      43. \r\n9.5.4.3.3 Market Estimates
      44. & Forecast By End Use, 2020-2027
      45. \r\n
      46. \r\n9.5.4.4 Oman
      47. \r\n
      48. \r\n9.5.4.4.1
      49. Market Estimates & Forecast By Base Oil, 2020-2027
      50. \r\n
      51. \r\n9.5.4.4.2
      52. Market Estimates & Forecast By Application, 2020-2027
      53. \r\n
      54. \r\n9.5.4.4.3
      55. Market Estimates & Forecast By End Use, 2020-2027
      56. \r\n
      57. \r\n9.5.4.5
      58. Kuwait
      59. \r\n
      60. \r\n9.5.4.5.1 Market Estimates & Forecast By Base
      61. Oil, 2020-2027
      62. \r\n
      63. \r\n9.5.4.5.2 Market Estimates & Forecast
      64. By Application, 2020-2027
      65. \r\n
      66. \r\n9.5.4.5.3 Market Estimates
      67. & Forecast By End Use, 2020-2027
      68. \r\n
      69. \r\n9.5.4.6 Bahrain
      70. \r\n
      71. \r\n9.5.4.6.1
      72. Market Estimates & Forecast By Base Oil, 2020-2027
      73. \r\n
      74. \r\n9.5.4.6.2
      75. Market Estimates & Forecast By Application, 2020-2027
      76. \r\n
      77. \r\n9.5.4.6.3
      78. Market Estimates & Forecast By End Use, 2020-2027
      79. \r\n
      80. \r\n10
      81. Competitive Landscape
      82. \r\n
      83. \r\n10.1 Introduction
      84. \r\n
      85. \r\n10.2
      86. Competitive Analysis
      87. \r\n
      88. \r\n10.2.1 Introduction
      89. \r\n
      90. \r\n10.2.2
      91. Market Share Analysis
      92. \r\n
      93. \r\n10.2.3 Key Development Strategies
      94. \r\n
      95. \r\n11
      96. Company Profiles
      97. \r\n
      98. \r\n11.1 PetroChina Company Ltd.
      99. \r\n
      100. \r\n11.1.1
      101. Company Overview
      102. \r\n
      103. \r\n11.1.2 Financial Overview
      104. \r\n
      105. \r\n11.1.3
      106. Products Offering
      107. \r\n
      108. \r\n11.1.4 Key Developments
      109. \r\n
      110. \r\n11.1.5
      111. SWOT Analysis
      112. \r\n
      113. \r\n11.1.6 Key Strategy
      114. \r\n
      115. \r\n11.2
      116. Sinopec Corporation
      117. \r\n
      118. \r\n11.2.1 Company Overview
      119. \r\n
      120. \r\n11.2.2
      121. Financial Overview
      122. \r\n
      123. \r\n11.2.3 Products Offering
      124. \r\n
      125. \r\n11.2.4
      126. Key Developments
      127. \r\n
      128. \r\n11.2.5 SWOT Analysis
      129. \r\n
      130. \r\n11.2.6
      131. Key Strategy
      132. \r\n
      133. \r\n11.3 Fuchs Petrolub SE
      134. \r\n
      135. \r\n11.3.1
      136. Company Overview
      137. \r\n
      138. \r\n11.3.2 Financial Overview
      139. \r\n
      140. \r\n11.3.3
      141. Products Offering
      142. \r\n
      143. \r\n11.3.4 Key Developments
      144. \r\n
      145. \r\n11.3.5
      146. SWOT Analysis
      147. \r\n
      148. \r\n11.3.6 Key Strategy
      149. \r\n
      150. \r\n11.4
      151. Phillips 66 Company
      152. \r\n
      153. \r\n11.4.1 Company Overview
      154. \r\n
      155. \r\n11.4.2
      156. Financial Overview
      157. \r\n
      158. \r\n11.4.3 Products Offering
      159. \r\n
      160. \r\n11.4.4
      161. Key Developments
      162. \r\n
      163. \r\n11.4.5 SWOT Analysis
      164. \r\n
      165. \r\n11.4.6
      166. Key Strategy
      167. \r\n
      168. \r\n11.5 Lucas Oil Products, Inc..
      169. \r\n
      170. \r\n11.5.1
      171. Company Overview
      172. \r\n
      173. \r\n11.5.2 Financial Overview
      174. \r\n
      175. \r\n11.5.3
      176. Products Offering
      177. \r\n
      178. \r\n11.5.4 Key Developments
      179. \r\n
      180. \r\n11.5.5
      181. SWOT Analysis
      182. \r\n
      183. \r\n11.5.6 Key Strategy
      184. \r\n
      185. \r\n11.6
      186. AMSOIL INC.
      187. \r\n
      188. \r\n11.6.1 Company Overview
      189. \r\n
      190. \r\n11.6.2
      191. Financial Overview
      192. \r\n
      193. \r\n11.6.3 Products Offering
      194. \r\n
      195. \r\n11.6.4
      196. Key Developments
      197. \r\n
      198. \r\n11.6.5 SWOT Analysis
      199. \r\n
      200. \r\n11.6.6
      201. Key Strategy
      202. \r\n
      203. \r\n11.7 Valvoline, Inc.
      204. \r\n
      205. \r\n11.7.1
      206. Company Overview
      207. \r\n
      208. \r\n11.7.2 Financial Overview
      209. \r\n
      210. \r\n11.7.3
      211. Products Offering
      212. \r\n
      213. \r\n11.7.4 Key Developments
      214. \r\n
      215. \r\n11.7.5
      216. SWOT Analysis
      217. \r\n
      218. \r\n11.7.6 Key Strategy
      219. \r\n
      220. \r\n11.8
      221. Clariant
      222. \r\n
      223. \r\n11.8.1 Company Overview
      224. \r\n
      225. \r\n11.8.2
      226. Financial Overview
      227. \r\n
      228. \r\n11.8.3 Products Offering
      229. \r\n
      230. \r\n11.8.4
      231. Key Developments
      232. \r\n
      233. \r\n11.8.5 SWOT Analysis
      234. \r\n
      235. \r\n11.8.6
      236. Key Strategy
      237. \r\n
      238. \r\n11.9 Quaker Chemical Corporation
      239. \r\n
      240. \r\n11.9.1
      241. Company Overview
      242. \r\n
      243. \r\n11.9.2 Financial Overview
      244. \r\n
      245. \r\n11.9.3
      246. Products Offering
      247. \r\n
      248. \r\n11.9.4 Key Developments
      249. \r\n
      250. \r\n11.9.5
      251. SWOT Analysis
      252. \r\n
      253. \r\n11.9.6 Key Strategy
      254. \r\n
      255. \r\n11.10
      256. Calumet Specialty Products Partners, L.P
      257. \r\n
      258. \r\n11.10.1 Company
      259. Overview
      260. \r\n
      261. \r\n11.10.2 Financial Overview
      262. \r\n
      263. \r\n11.10.3
      264. Products Offering
      265. \r\n
      266. \r\n11.10.4 Key Developments
      267. \r\n
      268. \r\n11.10.5
      269. SWOT Analysis
      270. \r\n
      271. \r\n11.10.6 Key Strategy
      272. \r\n
      273. \r\n11.11
      274. Chevron Corporation
      275. \r\n
      276. \r\n11.11.1 Company Overview
      277. \r\n
      278. \r\n11.11.2
      279. Financial Overview
      280. \r\n
      281. \r\n11.11.3 Products Offering
      282. \r\n
      283. \r\n11.11.4
      284. Key Developments
      285. \r\n
      286. \r\n11.11.5 SWOT Analysis
      287. \r\n
      288. \r\n11.11.6
      289. Key Strategy
      290. \r\n
      291. \r\n11.12 BP Plc
      292. \r\n
      293. \r\n11.12.1
      294. Company Overview
      295. \r\n
      296. \r\n11.12.2 Financial Overview
      297. \r\n
      298. \r\n11.12.3
      299. Products Offering
      300. \r\n
      301. \r\n11.12.4 Key Developments
      302. \r\n
      303. \r\n11.12.5
      304. SWOT Analysis
      305. \r\n
      306. \r\n11.12.6 Key Strategy
      307. \r\n
      308. \r\n11.13
      309. Exxon Mobil Corporation.
      310. \r\n
      311. \r\n11.13.1 Company Overview
      312. \r\n
      313. \r\n11.13.2
      314. Financial Overview
      315. \r\n
      316. \r\n11.13.3 Products Offering
      317. \r\n
      318. \r\n11.13.4
      319. Key Developments
      320. \r\n
      321. \r\n11.13.5 SWOT Analysis
      322. \r\n
      323. \r\n11.13.6
      324. Key Strategy
      325. \r\n
      326. \r\n11.14 Royal Dutch Shell Plc
      327. \r\n
      328. \r\n11.14.1
      329. Company Overview
      330. \r\n
      331. \r\n11.14.2 Financial Overview
      332. \r\n
      333. \r\n11.14.3
      334. Products Offering
      335. \r\n
      336. \r\n11.14.4 Key Developments
      337. \r\n
      338. \r\n11.14.5
      339. SWOT Analysis
      340. \r\n
      341. \r\n11.14.6 Key Strategy
      342. \r\n
      343. \r\n11.15
      344. Total S.A.
      345. \r\n
      346. \r\n11.15.1 Company Overview
      347. \r\n
      348. \r\n11.15.2
      349. Financial Overview
      350. \r\n
      351. \r\n11.15.3 Products Offering
      352. \r\n
      353. \r\n11.15.4
      354. Key Developments
      355. \r\n
      356. \r\n11.15.5 SWOT Analysis
      357. \r\n
      358. \r\n11.15.6
      359. Key Strategy
      360. \r\n
      361. \r\n11.16 Lukoil
      362. \r\n
      363. \r\n11.16.1
      364. Company Overview
      365. \r\n
      366. \r\n11.16.2 Financial Overview
      367. \r\n
      368. \r\n11.16.3
      369. Products Offering
      370. \r\n
      371. \r\n11.16.4 Key Developments
      372. \r\n
      373. \r\n11.16.5
      374. SWOT Analysis
      375. \r\n
      376. \r\n11.16.6 Key Strategy
      377. \r\n
      378. \r\n11.17
      379. Petronas
      380. \r\n
      381. \r\n11.17.1 Company Overview
      382. \r\n
      383. \r\n11.17.2
      384. Financial Overview
      385. \r\n
      386. \r\n11.17.3 Products Offering
      387. \r\n
      388. \r\n11.17.4
      389. Key Developments
      390. \r\n
      391. \r\n11.17.5 SWOT Analysis
      392. \r\n
      393. \r\n11.17.6
      394. Key Strategy
      395. \r\n
      396. \r\n11.18 Yushiro Chemical Industry
      397. \r\n
      398. \r\n11.18.1
      399. Company Overview
      400. \r\n
      401. \r\n11.18.2 Financial Overview
      402. \r\n
      403. \r\n11.18.3
      404. Products Offering
      405. \r\n
      406. \r\n11.18.4 Key Developments
      407. \r\n
      408. \r\n11.18.5
      409. SWOT Analysis
      410. \r\n
      411. \r\n11.18.6 Key Strategy
      412. \r\n
      413. \r\n11.19
      414. Morris Lubricants
      415. \r\n
      416. \r\n11.19.1 Company Overview
      417. \r\n
      418. \r\n11.19.2
      419. Financial Overview
      420. \r\n
      421. \r\n11.19.3 Products Offering
      422. \r\n
      423. \r\n11.19.4
      424. Key Developments
      425. \r\n
      426. \r\n11.19.5 SWOT Analysis
      427. \r\n
      428. \r\n11.19.6
      429. Key Strategy
      430. \r\n
      431. \r\n11.20 Rock Valley Oil And Chemical Co.
      432. \r\n
      433. \r\n11.20.1
      434. Company Overview
      435. \r\n
      436. \r\n11.20.2 Financial Overview
      437. \r\n
      438. \r\n11.20.3
      439. Products Offering
      440. \r\n
      441. \r\n11.20.4 Key Developments
      442. \r\n
      443. \r\n11.20.5
      444. SWOT Analysis
      445. \r\n
      446. \r\n11.20.6 Key Strategy
      447. \r\n
      448. \r\n11.21
      449. Indian Oil Corporation Limited
      450. \r\n
      451. \r\n11.21.1 Company Overview
      452. \r\n
      453. \r\n11.21.2
      454. Financial Overview
      455. \r\n
      456. \r\n11.21.3 Products Offering
      457. \r\n
      458. \r\n11.21.4
      459. Key Developments
      460. \r\n
      461. \r\n11.21.5 SWOT Analysis
      462. \r\n
      463. \r\n11.21.6
      464. Key Strategy
      465. \r\n
      466. \r\n11.22 Gulf Oil India
      467. \r\n
      468. \r\n11.22.1
      469. Company Overview
      470. \r\n
      471. \r\n11.22.2 Financial Overview
      472. \r\n
      473. \r\n11.22.3
      474. Products Offering
      475. \r\n
      476. \r\n11.22.4 Key Developments
      477. \r\n
      478. \r\n11.22.5
      479. SWOT Analysis
      480. \r\n
      481. \r\n11.22.6 Key Strategy
      482. \r\n
      483. \r\n12
      484. Appendix
      485. \r\n
      486. \r\n13 List Of Tables
      487. \r\n
      488. \r\n14
      489. List Of Figures
      490. \r\n

    ASEAN, GCC, India, Africa lubricants Market Segmentation

    Market Segmentation Overview

    • Detailed segmentation data will be available in the full report
    • Comprehensive analysis by multiple parameters
    • Regional and country-level breakdowns
    • Market size forecasts by segment
    Infographic

    Free Sample Request

    Kindly complete the form below to receive a free sample of this Report

    Get Free Sample

    Customer Strories

    “I am very pleased with how market segments have been defined in a relevant way for my purposes (such as "Portable Freezers & refrigerators" and "last-mile"). In general the report is well structured. Thanks very much for your efforts.”

    Victoria Milne

    Founder
    Case Study
    Chemicals and Materials

    Compare Licence

    ×
    Features License Type
    Single User Multiuser License Enterprise User
    Price $4,950 $5,950 $7,250
    Maximum User Access Limit 1 User Upto 10 Users Unrestricted Access Throughout the Organization
    Free Customization
    Direct Access to Analyst
    Deliverable Format
    Platform Access
    Discount on Next Purchase 10% 15% 15%
    Printable Versions