


Global Breast Cancer Size
Market Size Snapshot
| Year | Value |
|---|---|
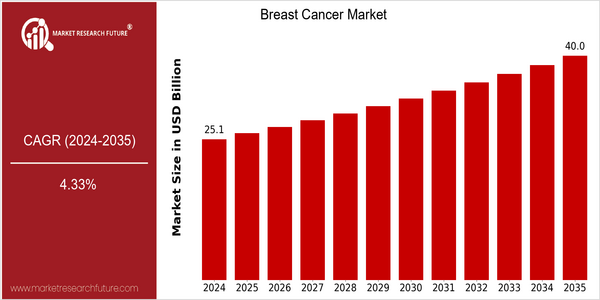
| 2024 | USD 25.09 Billion |
| 2035 | USD 40.0 Billion |
| CAGR (2025-2035) | 4.33 % |
Note – Market size depicts the revenue generated over the financial year
The breast cancer market is expected to grow at a fast pace. It is expected to reach $ 40 billion by 2035. The compound annual growth rate is 4.3% from 2025 to 2035. This shows an increase in demand for breast cancer diagnostics, therapeutics and supportive care. The growth is due to the following factors: a growing incidence of breast cancer in the world, the development of early detection methods, the development of new treatment modalities, such as targeted therapies and immunotherapy. The leading companies in the breast cancer market, such as Roche, Novartis and Pfizer, are actively investing in R & D to improve treatment and patient outcomes. Strategic alliances, aimed at accelerating the development of drugs and increasing access to new therapies, also contribute to the growth of the market. Several recent collaborations between pharmaceutical companies and biotechnology companies have resulted in the launch of new drugs that address the unmet medical needs in the treatment of breast cancer. Awareness and screening programs will also contribute to the growth of the market. Technological progress and the transition to personalized medicine will continue to drive the growth of the market.
Regional Market Size
Regional Deep Dive
The Breast Cancer Market is characterized by significant regional variations that are influenced by the health care systems, the regulatory frameworks and the cultural attitudes towards the treatment of cancer. In North America, the market is driven by advanced research and development, high health care expenditure and a strong emphasis on early detection and individualized medicine. Europe is characterized by the widest range of health care systems and access to novel therapies, while Asia-Pacific is experiencing the fastest growth rates, owing to the growing awareness and improving health care systems. The Middle East and Africa, where access to health care is restricted, are experiencing a number of initiatives to improve the quality of care. Latin America is seeing a rise in awareness campaigns and government support for the access to treatment, which is driving the market growth.
Europe
- The European Medicines Agency (EMA) has introduced streamlined approval processes for innovative breast cancer treatments, facilitating quicker access to new therapies for patients.
- Countries like Germany and the UK are implementing national screening programs that have led to earlier detection rates, thereby improving treatment success and patient outcomes.
Asia Pacific
- China is investing heavily in biotechnology and pharmaceutical research, leading to the development of local breast cancer therapies that cater to the specific needs of its population.
- The rise of telemedicine in countries like India is improving access to breast cancer screening and consultations, particularly in rural areas where healthcare resources are limited.
Latin America
- Brazil has implemented national policies to improve access to breast cancer screening and treatment, significantly impacting early detection rates in urban areas.
- Non-profit organizations are increasingly collaborating with governments to launch awareness campaigns, which are crucial in changing cultural perceptions about breast cancer and encouraging women to seek medical help.
North America
- The FDA has recently approved several novel therapies for breast cancer, including targeted therapies and immunotherapies, which are expected to enhance treatment outcomes and patient survival rates.
- Organizations like the American Cancer Society and Susan G. Komen are actively involved in funding research and awareness campaigns, significantly impacting early detection and treatment accessibility.
Middle East And Africa
- The African Union has launched initiatives aimed at increasing awareness and education about breast cancer, which is crucial in regions with high mortality rates due to late diagnosis.
- Partnerships between local governments and international organizations are focusing on improving access to treatment and screening programs, which are expected to enhance patient outcomes.
Did You Know?
“In some regions, breast cancer is the most commonly diagnosed cancer among women, accounting for nearly 25% of all cancer cases.” — World Health Organization (WHO)
Segmental Market Size
The breast cancer market is currently experiencing a stable growth, owing to the increase in awareness and the improvement in the treatment of this malady. The increase in the number of cases and the increasing emphasis on screening are the two main factors that are driving the market. Moreover, regulatory initiatives such as the U.S. Food and Drug Administration’s (FDA) new policy on breast cancer screening have also been driving the market. The Affordable Care Act, which has made the provision of preventive services compulsory, has also been boosting the market, as it is encouraging the early detection of breast cancer and early intervention. The market for targeted therapies and immunotherapy is currently at a mature stage, with companies such as Genentech and AstraZeneca leading the way. The U.S. and Europe have the highest rates of breast cancer treatment, owing to the excellent health care systems in place in these regions. The major applications include diagnostics such as mammography and MRI, and treatments such as chemotherapy and targeted therapies. Artificial intelligence in diagnostics and patient-centric care are accelerating the market growth. Liquid biopsies and genomics are defining the future of breast cancer management.
Future Outlook
The Breast Cancer Market is expected to grow at a CAGR of 4.33% from 2024 to 2035. This growth is attributed to the development of early detection technology, the emergence of personalized medicine and the increasing emphasis on preventive care. Awareness of breast cancer is rising across the globe. This will lead to an increase in the penetration of screening programs and new treatment options, which will lead to increased diagnoses and better patient outcomes. The screening rates in developed countries are expected to reach a level of 80% by 2035, which will have a significant impact on the market and treatment paradigms. The development of new therapies, especially in the field of genomics and targeted therapies, will revolutionize the treatment landscape. Artificial intelligence in diagnostics and the development of new therapies, such as immunotherapy and hormone therapy, will further enhance treatment efficacy and patient adherence. Furthermore, supportive government policies to increase access to care and increase research and development funding will drive the market. In addition, the emergence of telemedicine and digital health solutions will enhance patient engagement and optimize treatment pathways, which will ultimately lead to the development of a more patient-centric and robust breast cancer care system.


Leave a Comment