Germanium Market (2026 - 2035)

ID: MRFR/CnM/20850-HCR 100 Pages Priya Nagrale Last Updated: October 05, 2026
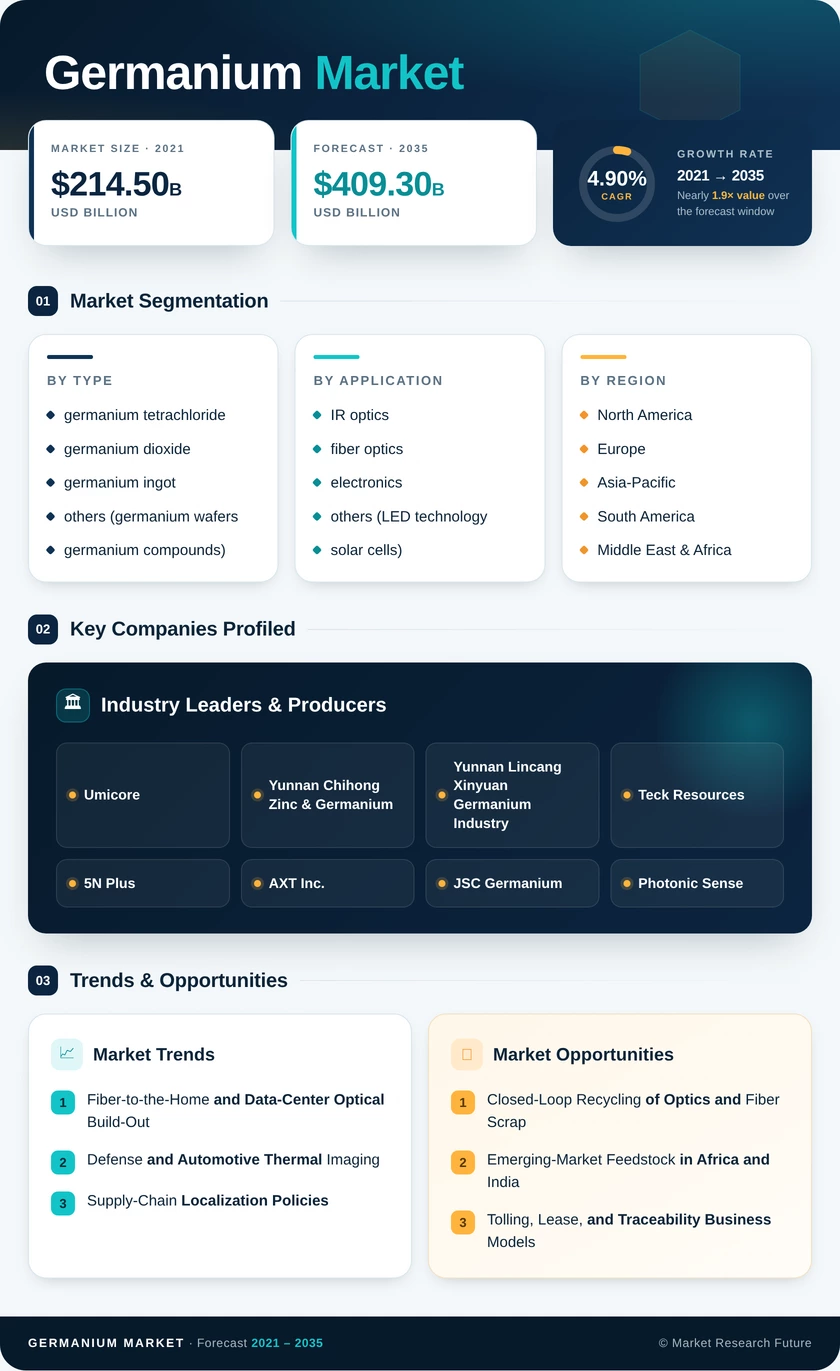
Germanium Market Research Report Information By Type (germanium tetrachloride, germanium dioxide, germanium ingot, and Others (germanium wafers, germanium compounds)), and By Application (IR optics, fiber optics, electronics, and Others (LED technology, solar cells)) – Forecast Till 2035.
Germanium Market
Market Size
Forecast Period2026-2035
CAGR (2026-2035)4.90%
Key Players
Umicore
Yunnan Chihong Zinc & Germanium
Yunnan Lincang Xinyuan Germanium Industry
Teck Resources
5N Plus
AXT Inc.
Opportunities
  • Closed-Loop Recycling of Optics and Fiber Scrap
  • Emerging-Market Feedstock in Africa and India
  • Tolling, Lease, and Traceability Business Models
  1. 1 Market Summary | |
  2. 2 Key Report Takeaways | |
    1. 2.1 By Type | |
    2. 2.2 By Application | |
    3. 2.3 By Region | |
  3. 3 Market Size and Forecast (2021–2035) | |
  4. 4 Driver Impact Analysis | |
    1. 4.1 Fiber-to-the-Home and Data-Center Optical Build-Out | |
    2. 4.2 Defense and Automotive Thermal Imaging | |
    3. 4.3 Supply-Chain Localization Policies | |
    4. 4.4 SiGe RF Chips for 5G and Radar | |
    5. 4.5 Space Solar Cell Demand | |
    6. 4.6 High-Purity Detectors for Nuclear Security | |
  5. 5 Restraints Impact Analysis | |
    1. 5.1 Export Controls and Supply Concentration | |
    2. 5.2 Price Volatility | |
    3. 5.3 Material Substitution | |
    4. 5.4 Inelastic By-Product Supply | |
    5. 5.5 Environmental Compliance Costs | |
  6. 6 Opportunities | |
    1. 6.1 Closed-Loop Recycling of Optics and Fiber Scrap | |
    2. 6.2 Emerging-Market Feedstock in Africa and India | |
    3. 6.3 Tolling, Lease, and Traceability Business Models | |
    4. 6.4 Germanium-on-Silicon Photonics | |
    5. 6.5 Quantum and Radiation-Detection Niches | |
  7. 7 Regional Market Share and Country-Level Analysis | |
    1. 7.1 North America | | |
      1. 7.1.1 US | | |
      2. 7.1.2 Canada | | |
      3. 7.1.3 Mexico | |
    2. 7.2 Europe | | |
      1. 7.2.1 Germany | | |
      2. 7.2.2 UK | | |
      3. 7.2.3 France | | |
      4. 7.2.4 Italy | | |
      5. 7.2.5 Spain | | |
      6. 7.2.6 Nordic Countries | | |
      7. 7.2.7 Russia | | |
      8. 7.2.8 Rest of Europe | |
    3. 7.3 Asia-Pacific | | |
      1. 7.3.1 China | | |
      2. 7.3.2 India | | |
      3. 7.3.3 Japan | | |
      4. 7.3.4 South Korea | | |
      5. 7.3.5 ASEAN | | |
      6. 7.3.6 Rest of Asia-Pacific | |
    4. 7.4 South America | | |
      1. 7.4.1 Brazil | | |
      2. 7.4.2 Argentina | | |
      3. 7.4.3 Rest of South America | |
    5. 7.5 Middle East & Africa | | |
      1. 7.5.1 Saudi Arabia | | |
      2. 7.5.2 UAE | | |
      3. 7.5.3 South Africa | | |
      4. 7.5.4 Egypt | | |
      5. 7.5.5 Rest of MEA | |
  8. 8 Future Outlook (2026–2035) | |
    1. 8.1 AI Infrastructure and Optical Interconnect | |
    2. 8.2 Defense Optics and Autonomous Mobility | |
    3. 8.3 Strategic Stockpiling and Supply Reshoring | |
    4. 8.4 Circularity and ESG Disclosure | |
  9. 9 Segmentation Analysis | |
    1. 9.1 By Type | | |
      1. 9.1.1 germanium tetrachloride | | |
      2. 9.1.2 germanium dioxide | | |
      3. 9.1.3 germanium ingot | | |
      4. 9.1.4 others | |
    2. 9.2 By Application | | |
      1. 9.2.1 IR optics | | |
      2. 9.2.2 Fiber optics | | |
      3. 9.2.3 electronics | | |
      4. 9.2.4 others | |
  10. 10 Competitive Landscape | |
    1. 10.1 Market Concentration Analysis | |
    2. 10.2 Competitive Benchmarking Matrix | |
    3. 10.3 Company Profiles | | |
      1. 10.3.1 Umicore | | |
      2. 10.3.2 Yunnan Chihong Zinc & Germanium | | |
      3. 10.3.3 Yunnan Lincang Xinyuan Germanium Industry | | |
      4. 10.3.4 Teck Resources | | |
      5. 10.3.5 5N Plus | | |
      6. 10.3.6 AXT Inc. | | |
      7. 10.3.7 JSC Germanium | | |
      8. 10.3.8 Photonic Sense | | |
      9. 10.3.9 Indium Corporation | | |
      10. 10.3.10 PPM Pure Metals | |
  11. 11 Recent News & Developments | |
  12. 12 Report Scope and Methodology | |
  13. 13 Detailed Sources and Citations | |
  14. 14 Frequently Asked Questions (FAQs) | | LIST OF TABLES | |
  15. TABLE 1 Global Germanium Market Summary Metrics, 2025–2035 | |
  16. TABLE 2 Global Germanium Market Size & Forecast, by Volume (Tons), 2021–2035 | |
  17. TABLE 3 Driver Impact Analysis, 2026–2035 | |
  18. TABLE 4 Restraints Impact Analysis, 2026–2035 | |
  19. TABLE 5 Global Germanium Market Share, by Region, 2025 | |
  20. TABLE 6 North America Germanium Market, by Country, 2021–2035 (Tons) | |
  21. TABLE 7 Europe Germanium Market, by Country, 2021–2035 (Tons) | |
  22. TABLE 8 Asia-Pacific Germanium Market, by Country, 2021–2035 (Tons) | |
  23. TABLE 9 South America Germanium Market, by Country, 2021–2035 (Tons) | |
  24. TABLE 10 Middle East & Africa Germanium Market, by Country, 2021–2035 (Tons) | |
  25. TABLE 11 Global Germanium Market, by Type, 2021–2035 (Tons) | |
  26. TABLE 12 Global Germanium Market, by Application, 2021–2035 (Tons) | |
  27. TABLE 13 Competitive Benchmarking Matrix, 2025 | |
  28. TABLE 14 Report Scope and Methodology | |
  29. TABLE 15 Detailed Sources and Citations | | LIST OF FIGURES | |
  30. FIGURE 1 Germanium Market Dynamics Overview | |
  31. FIGURE 2 Germanium Value Chain Analysis | |
  32. FIGURE 3 Porter's Five Forces Analysis | |
  33. FIGURE 4 Global Germanium Market Size Trend, 2021–2035 (Tons) | |
  34. FIGURE 5 Germanium Market Share, by Type, 2025 | |
  35. FIGURE 6 Germanium Market Share, by Application, 2025 | |
  36. FIGURE 7 Germanium Market Share, by Region, 2025 | |
  37. FIGURE 8 Asia-Pacific Country Share, 2025 | |
  38. FIGURE 9 Competitive Landscape Positioning Map, 2025 | |
  39. FIGURE 10 Estimated Revenue Share of Key Players, 2025

Segmentation Quick Reference

DimensionSub-SegmentsDominant SegmentFastest Growing Segment
By Typegermanium tetrachloride; germanium dioxide; germanium ingot; others (germanium wafers, germanium compounds)germanium dioxide (28.0% share)germanium tetrachloride (5.20% CAGR)
By ApplicationIR optics; fiber optics; electronics; others (LED technology, solar cells)fiber optics (32.4% share)fiber optics (32.4% share; highest growth)
By RegionNorth America; Europe; Asia-Pacific; South America; Middle East & AfricaAsia-Pacific (60.5%)Asia-Pacific (60.5%; highest growth)

Ā 

Market Segmentation Overview

By Type

Sub-SegmentKey Trend
germanium tetrachlorideRising preform doping for 800G-era fiber
germanium dioxideCatalyst demand pressured by antimony alternatives.
germanium ingotDefense lens blanks and substrate slicing
othersWafers for space solar; niche deposition compounds

Ā 

Germanium dioxide leads by volume share because PET catalyst and optical-glass users buy steady tonnage. Germanium tetrachloride grows fastest, since every MCVD and PCVD preform line depends on it for core doping and data-center fiber demand keeps rising. Germanium ingot remains essential for thermal optics, while wafers within others track satellite launch cycles.

By Application

Sub-SegmentKey Trend
IR opticsShift toward vehicle and drone thermal cameras.
fiber opticsAI cluster interconnect and FTTH expansion
electronicsSiGe RF chips for 5G and radar
othersSatellite solar cells and LED technology phosphors

Ā 

Fiber optics both leads and grows fastest, because hyperscale interconnect and national broadband programs consume germanium tetrachloride at scale. IR optics ranks second on defense procurement, though chalcogenide substitution caps growth at the low end of the market. Electronics benefits from CHIPS Act-funded SiGe capacity, while solar cells in others follow constellation replacement cycles.


Ā 

Download PDF ×

We do not share your information with anyone. However, we may send you emails based on your report interest from time to time. You may contact us at any time to opt-out.