Gas Generator Market (2026 - 2035)

ID: MRFR/EnP/2973-HCR 111 Pages Anshula Mandaokar Last Updated: October 05, 2026
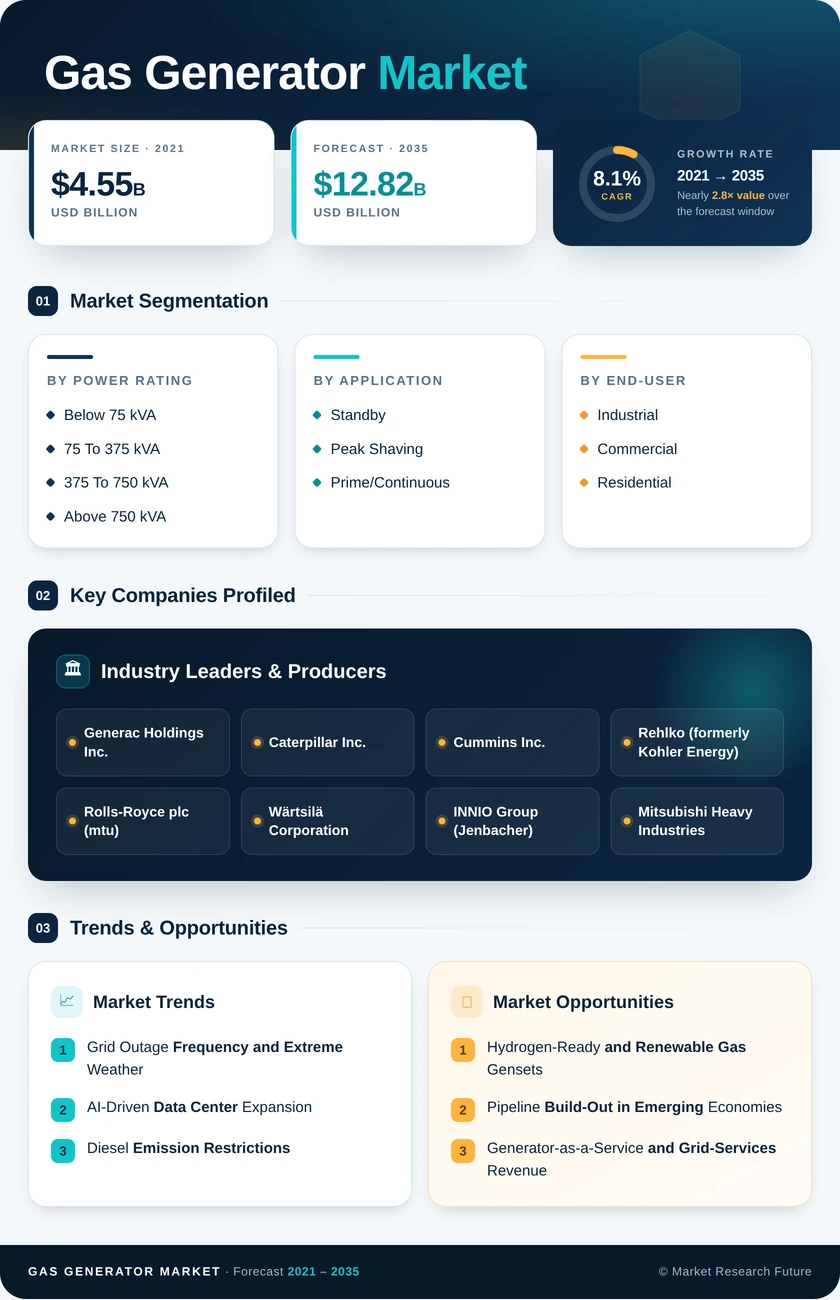
Gas Generator Market Research Report By Power Rating (Below 75 kVA, 75 To 375 kVA, 375 To 750 kVA, Above 750 kVA), By Application (Standby, Peak Shaving, Prime/Continuous), By End-User (Industrial, Commercial, Residential) - Forecast to 2035
Gas Generator Market
Market Size
Forecast Period2026-2035
CAGR (2026-2035)8.1%
2025 Market SizeUSD 5.88 Billion
2035 Market SizeUSD 12.82 Billion
Key Players
Generac Holdings Inc.
Caterpillar Inc.
Cummins Inc.
Rehlko
Rolls-Royce plc
Wärtsilä Corporation
Opportunities
  • Hydrogen-Ready and Renewable Gas Gensets
  • Pipeline Build-Out in Emerging Economies
  • Generator-as-a-Service and Grid-Services Revenue
  1. 1 Market Summary | |
  2. 2 Key Report Takeaways | |
    1. 2.1 By Power Rating | |
    2. 2.2 By Application | |
    3. 2.3 By End-User | |
    4. 2.4 By Region | |
  3. 3 Market Size and Forecast (2021–2035) | |
    1. 3.1 Historical Market Size (2021–2025) | |
    2. 3.2 Forecast Market Size (2026–2035) | |
  4. 4 Driver Impact Analysis | |
    1. 4.1 Grid Outage Frequency and Extreme Weather | |
    2. 4.2 AI-Driven Data Center Expansion | |
    3. 4.3 Diesel Emission Restrictions | |
    4. 4.4 City Gas Network Expansion | |
    5. 4.5 Demand Charges and Grid Flexibility Programs | |
    6. 4.6 Residential Home-Standby Adoption | |
  5. 5 Restraints Impact Analysis | |
    1. 5.1 Natural Gas Price Volatility | |
    2. 5.2 Competition from Battery Energy Storage | |
    3. 5.3 Higher Upfront Cost than Diesel | |
    4. 5.4 Fuel Supply Risk During Pipeline Disruptions | |
    5. 5.5 Tightening Methane and NOx Regulation | |
  6. 6 Opportunities | |
    1. 6.1 Hydrogen-Ready and Renewable Gas Gensets | |
    2. 6.2 Pipeline Build-Out in Emerging Economies | |
    3. 6.3 Generator-as-a-Service and Grid-Services Revenue | |
    4. 6.4 Bridge Power for Grid-Constrained Data Centers | |
    5. 6.5 Combined Heat and Power in Industry | |
  7. 7 Regional Market Share and Country-Level Analysis | |
    1. 7.1 North America | | |
      1. 7.1.1 United States | | |
      2. 7.1.2 Canada | | |
      3. 7.1.3 Rest of North America | |
    2. 7.2 Europe | | |
      1. 7.2.1 Germany | | |
      2. 7.2.2 United Kingdom | | |
      3. 7.2.3 France | | |
      4. 7.2.4 Italy | | |
      5. 7.2.5 Rest of Europe | |
    3. 7.3 Asia-Pacific | | |
      1. 7.3.1 China | | |
      2. 7.3.2 India | | |
      3. 7.3.3 Japan | | |
      4. 7.3.4 Australia | | |
      5. 7.3.5 Rest of Asia-Pacific | |
    4. 7.4 South America | | |
      1. 7.4.1 Brazil | | |
      2. 7.4.2 Argentina | | |
      3. 7.4.3 Rest of South America | |
    5. 7.5 Middle East and Africa | | |
      1. 7.5.1 Saudi Arabia | | |
      2. 7.5.2 United Arab Emirates | | |
      3. 7.5.3 South Africa | | |
      4. 7.5.4 Rest of Middle East and Africa | |
  8. 8 Future Outlook (2026–2035) | |
    1. 8.1 Digital Operations and Predictive Maintenance | |
    2. 8.2 AI-Driven Load Growth and Behind-the-Meter Generation | |
    3. 8.3 Grid-Interactive Generation | |
    4. 8.4 Low-Carbon Fuels and Emissions Disclosure | |
  9. 9 Segmentation Analysis | |
    1. 9.1 By Power Rating | | |
      1. 9.1.1 Below 75 kVA | | |
      2. 9.1.2 75 To 375 kVA | | |
      3. 9.1.3 375 To 750 kVA | | |
      4. 9.1.4 Above 750 kVA | |
    2. 9.2 By Application | | |
      1. 9.2.1 Standby | | |
      2. 9.2.2 Peak Shaving | | |
      3. 9.2.3 Prime/Continuous | |
    3. 9.3 By End-User | | |
      1. 9.3.1 Industrial | | |
      2. 9.3.2 Commercial | | |
      3. 9.3.3 Residential | |
  10. 10 Competitive Landscape | |
    1. 10.1 Market Concentration Analysis | |
    2. 10.2 Competitive Benchmarking Matrix | |
    3. 10.3 Company Profiles | | |
      1. 10.3.1 Generac Holdings Inc. | | |
      2. 10.3.2 Caterpillar Inc. | | |
      3. 10.3.3 Cummins Inc. | | |
      4. 10.3.4 Rehlko | | |
      5. 10.3.5 Rolls-Royce plc (mtu) | | |
      6. 10.3.6 Wärtsilä Corporation | | |
      7. 10.3.7 INNIO Group (Jenbacher) | | |
      8. 10.3.8 Mitsubishi Heavy Industries | | |
      9. 10.3.9 Briggs & Stratton | | |
      10. 10.3.10 Atlas Copco AB | |
  11. 11 Recent News & Developments | |
  12. 12 Report Scope and Methodology | |
  13. 13 Detailed Sources and Citations | |
  14. 14 Frequently Asked Questions (FAQs) | | LIST OF TABLES | |
  15. TABLE 1 Market Snapshot — Key Metrics, 2025–2035 | |
  16. TABLE 2 Global Market Size & Forecast, by Revenue (USD Billion), 2021–2035 | |
  17. TABLE 3 Driver Impact Analysis on CAGR, 2026–2035 | |
  18. TABLE 4 Restraints Impact Analysis on CAGR, 2026–2035 | |
  19. TABLE 5 Regional Summary, 2025 | |
  20. TABLE 6 North America Market, by Country, 2025 | |
  21. TABLE 7 Europe Market, by Country, 2025 | |
  22. TABLE 8 Asia-Pacific Market, by Country, 2025 | |
  23. TABLE 9 South America Market, by Country, 2025 | |
  24. TABLE 10 Middle East and Africa Market, by Country, 2025 | |
  25. TABLE 11 Global Market, by Power Rating, 2025 | |
  26. TABLE 12 Global Market, by Application, 2025 | |
  27. TABLE 13 Global Market, by End-User, 2025 | |
  28. TABLE 14 Competitive Benchmarking Matrix, 2025 | |
  29. TABLE 15 Report Scope and Methodology | |
  30. TABLE 16 Detailed Sources and Citations | | LIST OF FIGURES | |
  31. FIGURE 1 Market Dynamics Overview — Drivers, Restraints and Opportunities | |
  32. FIGURE 2 Industry Value Chain Analysis | |
  33. FIGURE 3 Porter's Five Forces Analysis | |
  34. FIGURE 4 Global Market Size Trend, 2021–2035 (USD Billion) | |
  35. FIGURE 5 Market Share, by Power Rating, 2025 (%) | |
  36. FIGURE 6 Market Share, by Application, 2025 (%) | |
  37. FIGURE 7 Market Share, by End-User, 2025 (%) | |
  38. FIGURE 8 Regional Market Share, 2025 (%) | |
  39. FIGURE 9 Regional Growth Comparison, 2026–2035 (CAGR %) | |
  40. FIGURE 10 Competitive Landscape — Estimated Revenue Share Ranges, 2025

Segmentation Quick Reference

DimensionSub-SegmentsDominant SegmentFastest Growing Segment
By Power RatingBelow 75 kVA; 75 To 375 kVA; 375 To 750 kVA; Above 750 kVABelow 75 kVA (44.0% share)75 To 375 kVA (8.9% CAGR)
By ApplicationStandby; Peak Shaving; Prime/ContinuousStandby (47.5% share)Peak Shaving (9.5% CAGR)
By End-UserIndustrial; Commercial; ResidentialIndustrial (44.5% share)Residential (9.4% CAGR)
By RegionNorth America; Europe; Asia-Pacific; South America; Middle East and AfricaNorth America (38.5% share)Asia-Pacific (9.3% CAGR)


Market Segmentation Overview

The Gas Generator Market is segmented by power rating, application and end-user, with each dimension reflecting distinct buyer needs and duty cycles.

By Power Rating

Sub-SegmentKey Trend
Below 75 kVABuilder pre-wiring and app-based monitoring for homes
75 To 375 kVAModular, paralleling sets for commercial buildings
375 To 750 kVAHospital and campus resilience upgrades
Above 750 kVAMulti-megawatt blocks for data centers


Below 75 kVA leads with a 44.0% share because residential and small-business loads are modest and installation is fast. 75 To 375 kVA grows fastest at an 8.9% CAGR as commercial owners buy modular frames whose digital controllers support both outage protection and peak-shaving cycles. Above 750 kVA gains momentum from data center specifications but remains smaller in total value than the entry tier.

By Application

Sub-SegmentKey Trend
StandbyUptime mandates at hospitals and telecom hubs
Peak ShavingDemand-charge reduction and flexibility payments
Prime/ContinuousOff-grid mines, camps and oil and gas pads


Standby holds the lead at a 47.5% share because safety-critical facilities treat on-site generation as non-negotiable insurance against grid failure. Peak Shaving expands fastest at a 9.5% CAGR, since engines that tolerate frequent start-stop cycles now integrate with building energy management systems to flatten load profiles. Prime/Continuous duty stays a niche tied to sites with pipeline gas but no bulk grid.

By End-User

Sub-SegmentKey Trend
IndustrialCHP integration and process continuity
CommercialMid-range ratings for power quality
ResidentialOutage awareness and subscription maintenance


Industrial facilities lead with a 44.5% share, using gas sets for backup and waste-heat recovery in refining, chemicals and fertilizer plants. Residential demand grows fastest at a 9.4% CAGR as neighborhood gas mains spread and builders fold units into mortgage packages. Commercial buildings sit between the two, specifying mid-range ratings that fit tight footprints.


 

Download PDF ×

We do not share your information with anyone. However, we may send you emails based on your report interest from time to time. You may contact us at any time to opt-out.