• Cat-intel
  • MedIntelliX
  • Resources
  • About Us
  • English
    Chinese
    French
    Japanese
    Korean
    German
    Spanish

    Gaming Hardware Market Share

    ID: MRFR/SEM/9993-HCR
    128 Pages
    Shubham Munde
    September 2025

    Gaming Hardware Market Research Report Information By Product Type (Consoles, Accessories), By End User (Commercial, Residential) and By Region (North America, Europe, Asia-Pacific, And Rest Of The World) –Industry Size, Share and Forecast Till 2035

    Share:
    Download PDF ×

    We do not share your information with anyone. However, we may send you emails based on your report interest from time to time. You may contact us at any time to opt-out.

    Gaming Hardware Market Infographic
    $ 4,950.0
    $ 5,950.0
    $ 7,250.0

    Market Share

    Gaming Hardware Market Share Analysis

    The gaming hardware market is fiercely competitive, and market share positioning strategies play a crucial role in determining the success of companies within this dynamic industry. One prevalent strategy involves product differentiation. Leading companies aim to set themselves apart by introducing unique features, cutting-edge technology, and design innovations in their gaming hardware. Whether it's a graphics card with enhanced performance capabilities, a gaming mouse with customizable RGB lighting, or a console with exclusive gaming titles, differentiation serves as a key driver in attracting consumers and securing a significant market share. Pricing strategies also play a pivotal role in market share positioning within the gaming hardware sector. While premium products with advanced features target the high-end market, companies often introduce entry-level and mid-range products to capture a broader customer base. Price-conscious consumers may opt for more affordable alternatives that still offer satisfactory performance. Striking a balance between quality and affordability is crucial for companies seeking to gain or maintain a substantial market share, as it allows them to cater to a diverse range of consumers with varying budget constraints. Strategic partnerships and collaborations are another integral aspect of market share positioning in the gaming hardware industry. Companies often form alliances with game developers, software providers, and other relevant stakeholders to enhance the overall gaming experience. Exclusive partnerships can result in bundled offerings, limited-edition products, or optimized hardware-software integration, creating a unique value proposition for consumers. By aligning themselves with key players in the gaming ecosystem, companies can strengthen their market presence and differentiate their products from competitors. Global market expansion is a common strategy employed by gaming hardware manufacturers to increase their market share. As the gaming community grows worldwide, companies seek to tap into emerging markets and diversify their consumer base. Localized marketing campaigns, distribution partnerships, and understanding regional preferences are essential components of this strategy. A successful global expansion allows companies to gain a foothold in untapped markets, fostering increased brand recognition and market share growth. Continuous innovation and staying ahead of technological trends are fundamental to market share positioning in the gaming hardware sector. With the rapid pace of technological advancements, companies that invest in research and development to bring cutting-edge products to market gain a competitive edge. Whether it's the introduction of new gaming peripherals, advancements in graphics processing units, or the integration of immersive technologies like virtual reality, staying at the forefront of innovation allows companies to attract early adopters and maintain a leading market share position. Customer-centric strategies, including robust customer support, warranty programs, and community engagement, contribute significantly to market share positioning. Positive customer experiences lead to brand loyalty, positive reviews, and word-of-mouth recommendations, all of which can drive sales and market share growth. Building a strong community around a brand fosters a sense of belonging among consumers, creating advocates who not only purchase the products but also promote them to others. Lastly, strategic acquisitions and mergers can be instrumental in securing a competitive market position. Companies may acquire startups or established players to complement their product offerings, gain access to new technologies, or eliminate potential competitors. This approach allows for rapid market expansion and diversification, consolidating market share and reinforcing the company's standing within the gaming hardware industry.

    Market Summary

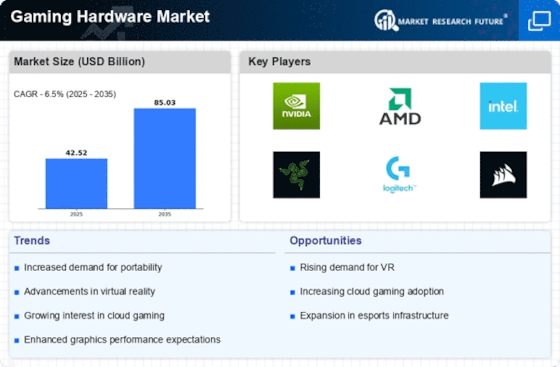
    As per Market Research Future Analysis, the Global Gaming Hardware Market was valued at USD 42.52 billion in 2024 and is projected to grow to USD 85.03 billion by 2035, with a CAGR of 6.50% from 2025 to 2035. The growth is driven by the increasing number of professional gamers and hobbyists seeking high-end gaming gear, alongside innovations from market leaders. The rise of multiplayer gaming and e-sports, particularly during the COVID-19 pandemic, has further fueled demand for advanced gaming hardware.

    Key Market Trends & Highlights

    Key trends driving the gaming hardware market include technological advancements and the rise of e-sports.

    • Global gamer population reached 3.1 billion in 2020, expected to increase by 500 million by 2024.
    • E-sports viewership grew to 496 million in 2020, with a market value nearing $1 billion.
    • Consoles held 56.54% market share in 2022, driven by new launches like PlayStation 5 and Xbox Series X/S.
    • Commercial segment accounted for 61.24% of revenue share in 2022, reflecting increased use in various settings.

    Market Size & Forecast

    2024 Market Size USD 42.52 Billion
    2035 Market Size USD 85.03 Billion
    CAGR (2025-2035) 6.50%
    Largest Regional Market Share in 2022 North America.

    Major Players

    Major players include Microsoft Corporation, Nintendo Co Ltd., NVIDIA Corporation, Sony Corporation, Logitech International S.A, and Venom UK Ltd.

    Market Trends

    Increased multiplayer gaming video streaming is driving the market growth

    Games are becoming a widely popular kind of entertainment on a global scale. In 2020, there were 3.1 billion gamers globally, and it is predicted that number will increase by 500 million by 2024. 7.7 billion People occupy the world, or just under half of it. The industry's revenues in 2021 exceeded those of movies, music, and books combined by $175 billion. The gaming industry has expanded into new territories thanks to artificial intelligence and machine learning. From network performance to player matching, these technologies are being used in everything.

    These cutting-edge technologies make it easier to do the delicate but crucial tasks of attracting new players and repelling bad actors, improving monetization, or creating and expanding new player ecosystems.

    By live broadcasting multiplayer gaming sessions, video game fans are making significant advancements. A new generation of content-obsessed consumers has been created by the live and pre-recorded streaming of video games. Gamers need sophisticated gaming technology, such as speakers, joysticks, motion controllers, and consoles, to enable such massive video streaming events. Also, E-sports is also contributing the market growth. While arcade and action games are still quite popular, the e-sports industry has considerable development potential. During the peak of the COVID-19 epidemic, this trend became very important.

    Outdoor athletic activities were either postponed or canceled throughout 2020 due to the implementation of lockdowns. Hence, in order to experience the same level of enjoyment, sports fans turned to video gaming platforms.

    According to studies, there will be 496 million people watching e-sports in 2020, an increase of 11.7% from the previous year. In addition, 4.4 million people broadcast e-sports content each month on Twitch in 2020, with pro e-sports players earning an average of US$ 5,000 each person. Altogether, the e-sports sector nearly became a $1 billion market in 2020. These developments only serve to highlight the domain's promising future.

    Players are investing in the right hardware as e-sports popularity increases, expanding opportunities for major manufacturers. Also, a lot of start-ups are discovering ways to take advantage of this trend and boost their revenues. For instance, the Indian e-sports gaming platform Gamerji recently announced the funding of US$ 1.1 million for the expansion to MENA and South East Asia, the development of social features for players, and the improvement of tournament management technology. In addition to extending its tournament offerings in MENA and SEA in 2022, the firm expects to add more than five million Indian users to its platform.

    Thus, driving the gaming hardware market revenue.

    The Global Gaming Hardware Market demonstrates a robust trajectory, driven by increasing consumer demand for immersive gaming experiences and advancements in technology.

    U.S. Department of Commerce

    Gaming Hardware Market Market Drivers

    Market Growth Projections

    The Global Gaming Hardware Market Industry is projected to experience substantial growth over the coming years. With a market value of 42.5 USD Billion anticipated in 2024, the industry is expected to expand significantly, reaching 85.0 USD Billion by 2035. This growth is underpinned by a compound annual growth rate (CAGR) of 6.5% from 2025 to 2035. Such projections highlight the increasing consumer interest in gaming hardware and the ongoing innovations within the sector. As the market evolves, it will likely attract new players and investments, further enhancing its global presence and competitiveness.

    Expansion of Cloud Gaming Services

    The Global Gaming Hardware Market Industry is being reshaped by the expansion of cloud gaming services, which allow users to stream games directly to their devices without the need for high-end hardware. This model reduces the barrier to entry for gamers, as they can access high-quality gaming experiences on lower-spec devices. Companies like Google and Microsoft are investing heavily in cloud gaming platforms, which could lead to increased hardware sales as consumers seek compatible peripherals. As cloud gaming continues to gain traction, it is likely to influence hardware trends and consumer preferences, further driving market growth.

    Increasing Popularity of Mobile Gaming

    The Global Gaming Hardware Market Industry is experiencing a notable shift due to the increasing popularity of mobile gaming. With the proliferation of smartphones and tablets, gaming has become more accessible to a broader audience. This trend has prompted hardware manufacturers to develop peripherals and accessories tailored for mobile gamers, such as portable controllers and gaming headsets. The convenience of mobile gaming, combined with advancements in mobile graphics and processing power, is likely to drive hardware sales. As the market adapts to this growing segment, it is expected to contribute significantly to the overall market value, reinforcing the industry's dynamic nature.

    Growth of Esports and Competitive Gaming

    The Global Gaming Hardware Market Industry is significantly influenced by the rapid growth of esports and competitive gaming. With millions of viewers and participants worldwide, esports has become a mainstream entertainment avenue. This popularity drives demand for specialized gaming hardware, such as high-refresh-rate monitors and precision gaming peripherals. Major tournaments and leagues, often featuring substantial prize pools, incentivize players to invest in top-tier equipment. As a result, the market is projected to reach 85.0 USD Billion by 2035, reflecting a compound annual growth rate (CAGR) of 6.5% from 2025 to 2035. This growth trajectory underscores the importance of esports in shaping hardware development and consumer preferences.

    Technological Advancements in Gaming Hardware

    The Global Gaming Hardware Market Industry is propelled by continuous technological advancements that enhance performance and user experience. Innovations in graphics processing units (GPUs), central processing units (CPUs), and storage solutions enable more complex and visually stunning games. For example, the introduction of ray tracing technology has significantly improved lighting and shadow effects in gaming. These advancements not only attract gamers but also encourage developers to create more demanding titles, thereby increasing hardware sales. As the market evolves, the demand for cutting-edge components is likely to rise, further solidifying the industry's growth and expanding its global reach.

    Rising Demand for Immersive Gaming Experiences

    The Global Gaming Hardware Market Industry is witnessing a surge in demand for immersive gaming experiences, driven by advancements in virtual reality (VR) and augmented reality (AR) technologies. As gamers increasingly seek more engaging and interactive environments, hardware manufacturers are compelled to innovate. For instance, the introduction of high-performance VR headsets and motion-sensing controllers has transformed gameplay. This trend is expected to contribute to the market's growth, with projections indicating a market value of 42.5 USD Billion in 2024. The integration of these technologies not only enhances user experience but also expands the potential consumer base, thereby fostering further investment in gaming hardware.

    Market Segment Insights

    Gaming Hardware Product Type Insights

    The Gaming Hardware Market segmentation, based on product type includes consoles and accessories. Consoles dominates the Gaming Hardware Market in terms of product type and held share of 56.54% of the market. The launch of new generation consoles such as PlayStation 5 and Xbox Series X/S in late 2020 created a significant buzz in the gaming industry, resulting in strong sales for both consoles. Additionally, the COVID-19 pandemic has also contributed to the growth of console sales as people spent more time at home and turned to gaming as a form of entertainment.

    Gaming Hardware End User Insights

    The Gaming Hardware Market segmentation, based on end user, includes commercial and residential. In 2022, the commercial category accounted for about 61.24% of the revenue share in the worldwide gaming hardware market. The expansion can be linked to the growing use of video games in a variety of commercial settings, including airports, train stations, hotels, and restaurants. Also, as more people participate in e-sports, there is a growing market for high-end gaming consoles with superior graphics to those found in typical desktop or laptop PCs. The segment is anticipated to grow further because to this tendency.

    Figure 1: Gaming Hardware Market, by End User, 2022 & 2032 (USD billion)

    Source: Secondary Research, Primary Research, MRFR Database and Analyst Review

    Get more detailed insights about Gaming Hardware Market Research Report—Global Forecast till 2034

    Regional Insights

    By Region, the study provides the market insights into North America, Europe, Asia-Pacific and Rest of the World. The North American area will dominate this market, owing to large and established gaming culture with a significant number of gamers and gaming enthusiasts. This culture has resulted in a high demand for gaming hardware products, including consoles, gaming laptops, gaming peripherals, and accessories. In addition, a number of the biggest gaming hardware producers in the world, including Microsoft, Sony, and Nintendo, are based in the North American continent.

    These businesses are well-positioned to address the need for gaming hardware items in North America and elsewhere since they are well-established in the area. Thus, will boost market growth in this region.

    Further, the major countries studied in the market report are The U.S., Canada, German, France, the UK, Italy, Spain, China, Japan, India, Australia, South Korea, and Brazil.

    Figure 2: GAMING HARDWARE MARKET SHARE BY REGION 2022 (%)GAMING HARDWARE MARKET SHARE BY REGION 2022

    Source: Secondary Research, Primary Research, MRFR Database and Analyst Review

    Asia Pacific gaming hardware market accounts for the second-largest market share due to large and growing population with a high proportion of young people, who are the primary consumers of gaming hardware products. Furthermore, the rapid growth of the gaming industry in the APAC region can be attributed to the increasing availability of high-speed internet and mobile connectivity. This has enabled gamers to easily access online games and streaming services, resulting in a surge in demand for gaming hardware products.

    Moreover, China gaming hardware market held the largest market share, and the India gaming hardware market was the fastest-growing market in the region.

    Europe gaming hardware market accounts for the third-largest market share due to several factors. The region has a large population of gamers who are willing to invest in high-quality gaming hardware. Additionally, the growth of Esports and the increasing popularity of mobile gaming has driven demand for gaming hardware in the region. Another important factor contributing to the strength of the gaming hardware market in Europe is the presence of several large gaming hardware companies, such as Logitech, Razer, and Corsair.

    These companies have established a strong presence in the European market, offering a range of gaming hardware products to consumers. Moreover, German gaming hardware market held the largest market share, and the UK gaming hardware market was the fastest-growing market in the European region.

    Key Players and Competitive Insights

    Leading market players are investing heavily in research and development in order to expand their product lines, which will help the gaming hardware market, grow even more. Market participants are also undertaking a variety of strategic activities to expand their global footprint, with important market developments including new product launches, contractual agreements, mergers and acquisitions, higher investments, and collaboration with other organizations. To expand and survive in a more competitive and rising market climate, gaming hardware industry must offer cost-effective items.

    Manufacturing locally to minimize operational costs is one of the key business tactics used by manufacturers in the global gaming hardware industry to benefit clients and increase the market sector. In recent years, the gaming hardware industry has offered some of the most significant advantages to medicine. Major players in the gaming hardware market, including, Microsoft Corporation, Nintendo Co Ltd., NVIDIA Corporation, Sony Corporation, Logitech International S.A, and Venom UK Ltd, Oculus VR, Playstation, Linden Research, Sega games, etc.

    Microsoft is headquartered in Redmond, Washington, the US. Software development, licensing, and support are all services provided by Microsoft Corp. (Microsoft). The company provides a wide variety of operating systems, server applications, cross-device productivity tools, business solution tools, desktop and server administration tools, video games, and training and certification services. Additionally, it creates, produces, and markets hardware items like Computers, tablets, game consoles, and other sophisticated gadgets. The company offers a wide range of services, such as consultancy, cloud-based solutions, and solution support.

    Through original equipment manufacturers, distributors, resellers, online marketplaces, Microsoft stores, and other partner channels, Microsoft promotes, distributes, and sells its products. The company has operations throughout the Middle East, Africa, the Americas, Europe, and Asia-Pacific. In February 2023, Microsoft and NVIDIA announced a 10-year agreement to offer Xbox PC titles to the more than 25 million-user NVIDIA® GeForce NOWTM cloud gaming service, which is available in more than 100 countries. Collaboration will bring popular Xbox games, such as Call of Duty and Minecraft from Activision, to NVIDIA GeForce NOW cloud gaming service.

    Sony Group Corp (Sony) is a manufacturer of electronic equipment, semiconductors, medical-related equipment, instruments, and devices. The company’s products include televisions, mobile phones, cameras, music systems, game consoles and software, semiconductors, batteries, and other electronic components. Sony produces, acquires, and distributes recorded music, motion pictures, and television programming; and operates television and digital networks. It also provides banking and financial services, including life and non-life insurance. The company markets products through sales subsidiaries, distributors, and direct sales through the internet. It markets products under Sony, PlayStation, Walkman, Blu-ray, Cyber-shot, Bravia, Exmor, Experia, and Airpeak brand names.

    The company operates in Asia-Pacific, Europe, the Middle East, Africa, and the Americas. Sony is headquartered in Minato-Ku, Tokyo, Japan.

    Key Companies in the Gaming Hardware Market market include

    Industry Developments

    March 2023: In order to expand the number of games available to users worldwide, Microsoft established a cooperation with cloud gaming service provider Boosteroid.

    February 2023: Microsoft and NVIDIA announced a 10-year agreement to offer Xbox PC titles to the more than 25 million-user NVIDIA® GeForce NOWTM cloud gaming service, which is available in more than 100 countries. Collaboration will bring popular Xbox games, such as Call of Duty and Minecraft from Activision, to NVIDIA GeForce NOW cloud gaming service.

    Future Outlook

    Gaming Hardware Market Future Outlook

    The Global Gaming Hardware Market is projected to grow at a 6.50% CAGR from 2025 to 2035, driven by technological advancements, increasing consumer demand, and the rise of competitive gaming.

    New opportunities lie in:

    • Develop next-gen VR headsets to enhance immersive gaming experiences.
    • Invest in cloud gaming infrastructure to support remote play and accessibility.
    • Create customizable gaming peripherals to cater to diverse gamer preferences.

    By 2035, the market is expected to achieve substantial growth, reflecting evolving consumer needs and technological innovations.

    Market Segmentation

    Gaming Hardware Type Outlook

    • Consoles
    • Accessories

    Gaming Hardware End User Outlook

    • Commercial
    • Residential

    Gaming Hardware Regional Outlook

    • US
    • Canada

    Report Scope

    Report Attribute/Metric Details
    Market Size 2024 USD 42.52 billion
    Market Size 2025 USD 45.29 billion
    Market Size 2035 85.03 (Value (USD Billion))
    Compound Annual Growth Rate (CAGR) 6.50% (2025 - 2035)
    Base Year 2024
    Market Forecast Period 2025 - 2035
    Historical Data 2020- 2023
    Market Forecast Units Value (USD Billion)
    Report Coverage Revenue Forecast, Market Competitive Landscape, Growth Factors, and Trends
    Segments Covered Type, End User, and Region
    Geographies Covered North America, Europe, Asia Pacific, and the Rest of the World
    Countries Covered The U.S., Canada, German, France, UK, Italy, Spain, China, Japan, India, Australia, South Korea, and Brazil
    Key Companies Profiled Microsoft Corporation, Nintendo Co Ltd., NVIDIA Corporation, Sony Corporation, Logitech International S.A, and Venom UK Ltd, Oculus VR, Playstation, Linden Research, Sega games, etc.
    Key Market Opportunities Introduction of new technologies in gaming hardware
    Key Market Dynamics Increase in disposable income levels Increasing availability of high-speed internet and mobile connectivity

    Market Highlights

    Author

    Shubham Munde
    Research Analyst Level II

    She holds an experience of about 6+ years in market research and business consulting, working under the spectrum of information communication technology, telecommunications and semiconductor domains. aarti conceptualizes and implements a scalable business strategy and provides strategic leadership to the clients. her expertise lies in market estimation, competitive intelligence, pipeline analysis, customer assessment, etc.

    Leave a Comment

    Latest Comments

    John Doe
    john@example.com

    This is a great article! Really helped me understand the topic better.

    Posted on July 23, 2025, 10:15 AM
    Jane Smith
    jane@domain.com

    Thanks for sharing this. I’ve bookmarked it for later reference.

    Posted on July 22, 2025, 7:45 PM

    FAQs

    How much is the gaming hardware market?

    The Gaming Hardware Market size was valued at USD 42.52 Billion in 2024.

    What is the growth rate of the gaming hardware market?

    The global market is projected to grow at a CAGR of 6.5% during the forecast period, 2025-2034.

    Which region held the largest market share in the gaming hardware market?

    North America had the largest share in the global market

    Who are the key players in the gaming hardware market?

    The key players in the market are Microsoft Corporation, Nintendo Co Ltd., NVIDIA Corporation, Sony Corporation, Logitech International S.A, and Venom UK Ltd, Oculus VR, Playstation, Linden Research, Sega games, etc.

    Which product type led the gaming hardware market?

    The consoles category dominated the market in 2022.

    Which end user had the largest market share in the gaming hardware market?

    The commercial segment had the largest share in the global market.

    1. Table of Contents
    2. Executive Summary
    3. Market Introduction
      1. Definition
      2. Scope of the Study
        1. Research Objective
        2. Assumptions
        3. Limitations
    4. Research Methodology
      1. Overview
      2. Data Mining
      3. Secondary Research
      4. Primary Research
        1. Primary Interviews and Information Gathering Process
        2. Breakdown of Primary Respondents
      5. Forecasting Modality
      6. Market Size Estimation
        1. Bottom-up Approach
        2. Top-Down Approach
      7. Data Triangulation
      8. Validation
    5. MARKET DYNAMICS
      1. Overview
      2. Drivers
      3. Restraints
      4. Opportunities
    6. MARKET FACTOR ANALYSIS
      1. Value Chain Analysis
      2. Porter’s Five Forces Analysis
        1. Bargaining Power of Suppliers
        2. Bargaining Power of Buyers
        3. Threat of New Entrants
        4. Threat of Substitutes
        5. Intensity of Rivalry
      3. COVID-19 Impact Analysis
        1. Market Impact Analysis
        2. Regional Impact
        3. Opportunity and Threat Analysis
    7. GLOBAL GAMING HARDWARE MARKET, BY PRODUCT TYPE
      1. Overview
      2. Consoles
      3. Accessories
    8. GLOBAL GAMING HARDWARE MARKET, BY END USER
      1. Overview
      2. Commercial
      3. Residential
    9. GLOBAL GAMING HARDWARE MARKET, BY REGION
      1. Overview
      2. North America
        1. US
        2. Canada
      3. Europe
        1. Germany
        2. France
        3. UK
        4. Italy
        5. Spain
        6. Rest of Europe
      4. Asia-Pacific
        1. China
        2. India
        3. Japan
        4. South Korea
        5. Australia
        6. Rest of Asia-Pacific
      5. Rest of the World
        1. Middle East
        2. Africa
        3. Latin America
    10. Competitive Landscape
      1. Overview
      2. Competitive Analysis
      3. Market Share Analysis
      4. Major Growth Strategy in the Global Gaming Hardware Market,
      5. Competitive Benchmarking
      6. Leading Players in Terms of Number of Developments in the Global Gaming Hardware Market,
      7. Key developments and Growth Strategies
        1. New Product Launch/Service Deployment
        2. Merger & Acquisitions
        3. Joint Ventures
      8. Major Players Financial Matrix
        1. Sales & Operating Income, 2022
        2. Major Players R&D Expenditure. 2022
    11. COMPANY PROFILES
      1. Microsoft Corporation
        1. Company Overview
        2. Financial Overview
        3. Products Offered
        4. Key Developments
        5. SWOT Analysis
        6. Key Strategies
      2. Nintendo Co Ltd.
        1. Company Overview
        2. Financial Overview
        3. Products Offered
        4. Key Developments
        5. SWOT Analysis
        6. Key Strategies
      3. NVIDIA Corporation
        1. Company Overview
        2. Financial Overview
        3. Products Offered
        4. Key Developments
        5. SWOT Analysis
      4. Sony Corporation
        1. Company Overview
        2. Financial Overview
        3. Products Offered
        4. Key Developments
        5. SWOT Analysis
      5. Logitech International S.A
        1. Company Overview
        2. Financial Overview
        3. Products Offered
        4. Key Developments
        5. SWOT Analysis
      6. Venom UK Ltd
        1. Company Overview
        2. Financial Overview
        3. Products Offered
        4. Key Developments
        5. SWOT Analysis
      7. Oculus VR
        1. Company Overview
        2. Financial Overview
        3. Products Offered
        4. Key Developments
        5. SWOT Analysis
      8. Playstation
        1. Company Overview
        2. Financial Overview
        3. Products Offered
        4. Key Developments
        5. SWOT Analysis
      9. Linden Research
        1. Company Overview
        2. Financial Overview
        3. Products Offered
        4. Key Developments
        5. SWOT Analysis
      10. Sega games
        1. Company Overview
        2. Financial Overview
        3. Products Offered
        4. Key Developments
        5. SWOT Analysis
    12. APPENDIX
      1. References
      2. Related Reports
    13. List of Tables and Figures
      1. LIST OF TABLES
      2. TABLE 1 GLOBAL GAMING HARDWARE MARKET, SYNOPSIS, 2025-2034
      3. TABLE 2 GLOBAL GAMING HARDWARE MARKET, ESTIMATES & FORECAST, 2025-2034 (USD BILLION)
      4. TABLE 3 GLOBAL GAMING HARDWARE MARKET, BY PRODUCT TYPE, 2025-2034 (USD BILLION)
      5. TABLE 4 GLOBAL GAMING HARDWARE MARKET, BY END USER, 2025-2034 (USD BILLION)
      6. TABLE 5 NORTH AMERICA: GAMING HARDWARE MARKET, BY PRODUCT TYPE, 2025-2034 (USD BILLION)
      7. TABLE 6 NORTH AMERICA: GAMING HARDWARE MARKET, BY END USER, 2025-2034 (USD BILLION)
      8. TABLE 7 US: GAMING HARDWARE MARKET, BY PRODUCT TYPE, 2025-2034 (USD BILLION)
      9. TABLE 8 US: GAMING HARDWARE MARKET, BY END USER, 2025-2034 (USD BILLION)
      10. TABLE 9 CANADA: GAMING HARDWARE MARKET, BY PRODUCT TYPE, 2025-2034 (USD BILLION)
      11. TABLE 10 CANADA: GAMING HARDWARE MARKET, BY END USER, 2025-2034 (USD BILLION)
      12. TABLE 1 EUROPE: GAMING HARDWARE MARKET, BY PRODUCT TYPE, 2025-2034 (USD BILLION)
      13. TABLE 2 EUROPE: GAMING HARDWARE MARKET, BY END USER, 2025-2034 (USD BILLION)
      14. TABLE 3 GERMANY: GAMING HARDWARE MARKET, BY PRODUCT TYPE, 2025-2034 (USD BILLION)
      15. TABLE 4 GERMANY: GAMING HARDWARE MARKET, BY END USER, 2025-2034 (USD BILLION)
      16. TABLE 5 FRANCE: GAMING HARDWARE MARKET, BY PRODUCT TYPE, 2025-2034 (USD BILLION)
      17. TABLE 6 FRANCE: GAMING HARDWARE MARKET, BY END USER, 2025-2034 (USD BILLION)
      18. TABLE 7 ITALY: GAMING HARDWARE MARKET, BY PRODUCT TYPE, 2025-2034 (USD BILLION)
      19. TABLE 8 ITALY: GAMING HARDWARE MARKET, BY END USER, 2025-2034 (USD BILLION)
      20. TABLE 9 SPAIN: GAMING HARDWARE MARKET, BY PRODUCT TYPE, 2025-2034 (USD BILLION)
      21. TABLE 10 SPAIN: GAMING HARDWARE MARKET, BY END USER, 2025-2034 (USD BILLION)
      22. TABLE 11 UK: GAMING HARDWARE MARKET, BY PRODUCT TYPE, 2025-2034 (USD BILLION)
      23. TABLE 12 UK: GAMING HARDWARE MARKET, BY END UER, 2025-2034 (USD BILLION)
      24. TABLE 13 REST OF EUROPE: GAMING HARDWARE MARKET, BY PRODUCT TYPE, 2025-2034 (USD BILLION)
      25. TABLE 14 REST OF EUROPE: GAMING HARDWARE MARKET, BY END USER, 2025-2034 (USD BILLION)
      26. TABLE 15 ASIA-PACIFIC: GAMING HARDWARE MARKET, BY PRODUCT TYPE, 2025-2034 (USD BILLION)
      27. TABLE 16 ASIA-PACIFIC: GAMING HARDWARE MARKET, BY END USER, 2025-2034 (USD BILLION)
      28. TABLE 17 JAPAN: GAMING HARDWARE MARKET, BY PRODUCT TYPE, 2025-2034 (USD BILLION)
      29. TABLE 18 JAPAN: GAMING HARDWARE MARKET, BY END USER, 2025-2034 (USD BILLION)
      30. TABLE 19 CHINA: GAMING HARDWARE MARKET, BY PRODUCT TYPE, 2025-2034 (USD BILLION)
      31. TABLE 20 CHINA: GAMING HARDWARE MARKET, BY END USER, 2025-2034 (USD BILLION)
      32. TABLE 21 INDIA: GAMING HARDWARE MARKET, BY PRODUCT TYPE, 2025-2034 (USD BILLION)
      33. TABLE 22 INDIA: GAMING HARDWARE MARKET, BY END USER, 2025-2034 (USD BILLION)
      34. TABLE 23 AUSTRALIA: GAMING HARDWARE MARKET, BY PRODUCT TYPE, 2025-2034 (USD BILLION)
      35. TABLE 24 AUSTRALIA: GAMING HARDWARE MARKET, BY END USER, 2025-2034 (USD BILLION)
      36. TABLE 25 SOUTH KOREA: GAMING HARDWARE MARKET, BY PRODUCT TYPE, 2025-2034 (USD BILLION)
      37. TABLE 26 SOUTH KOREA: GAMING HARDWARE MARKET, BY END USER, 2025-2034 (USD BILLION)
      38. TABLE 27 REST OF ASIA-PACIFIC: GAMING HARDWARE MARKET, BY PRODUCT TYPE, 2025-2034 (USD BILLION)
      39. TABLE 28 REST OF ASIA-PACIFIC: GAMING HARDWARE MARKET, BY END USER, 2025-2034 (USD BILLION)
      40. TABLE 29 REST OF THE WORLD: GAMING HARDWARE MARKET, BY PRODUCT TYPE, 2025-2034 (USD BILLION)
      41. TABLE 30 REST OF THE WORLD: GAMING HARDWARE MARKET, BY END USER, 2025-2034 (USD BILLION)
      42. TABLE 31 MIDDLE EAST: GAMING HARDWARE MARKET, BY PRODUCT TYPE, 2025-2034 (USD BILLION)
      43. TABLE 32 MIDDLE EAST: GAMING HARDWARE MARKET, BY END USER, 2025-2034 (USD BILLION)
      44. TABLE 33 AFRICA: GAMING HARDWARE MARKET, BY PRODUCT TYPE, 2025-2034 (USD BILLION)
      45. TABLE 34 AFRICA: GAMING HARDWARE MARKET, BY END USER, 2025-2034 (USD BILLION)
      46. TABLE 35 LATIN AMERICA: GAMING HARDWARE MARKET, BY PRODUCT TYPE, 2025-2034 (USD BILLION)
      47. TABLE 36 LATIN AMERICA: GAMING HARDWARE MARKET, BY END USER, 2025-2034 (USD BILLION) LIST OF FIGURES
      48. FIGURE 1 RESEARCH PROCESS
      49. FIGURE 2 MARKET STRUCTURE FOR THE GLOBAL GAMING HARDWARE MARKET
      50. FIGURE 3 MARKET DYNAMICS FOR THE GLOBAL GAMING HARDWARE MARKET
      51. FIGURE 4 GLOBAL GAMING HARDWARE MARKET, SHARE (%), BY PRODUCT TYPE, 2022
      52. FIGURE 5 GLOBAL GAMING HARDWARE MARKET, SHARE (%), BY END USER, 2022
      53. FIGURE 6 GLOBAL GAMING HARDWARE MARKET, SHARE (%), BY REGION, 2022
      54. FIGURE 7 NORTH AMERICA: GAMING HARDWARE MARKET, SHARE (%), BY REGION, 2022
      55. FIGURE 8 EUROPE: GAMING HARDWARE MARKET, SHARE (%), BY REGION, 2022
      56. FIGURE 9 ASIA-PACIFIC: GAMING HARDWARE MARKET, SHARE (%), BY REGION, 2022
      57. FIGURE 10 REST OF THE WORLD: GAMING HARDWARE MARKET, SHARE (%), BY REGION, 2022
      58. FIGURE 11 GLOBAL GAMING HARDWARE MARKET: COMPANY SHARE ANALYSIS, 2022 (%)
      59. FIGURE 12 MICROSOFT CORPORATION: FINANCIAL OVERVIEW SNAPSHOT
      60. FIGURE 13 MICROSOFT CORPORATION: SWOT ANALYSIS
      61. FIGURE 14 NINTENDO CO LTD.: FINANCIAL OVERVIEW SNAPSHOT
      62. FIGURE 15 NINTENDO CO LTD.: SWOT ANALYSIS
      63. FIGURE 16 NVIDIA CORPORATION: FINANCIAL OVERVIEW SNAPSHOT
      64. FIGURE 17 NVIDIA CORPORATION: SWOT ANALYSIS
      65. FIGURE 18 SONY CORPORATION: FINANCIAL OVERVIEW SNAPSHOT
      66. FIGURE 19 SONY CORPORATION: SWOT ANALYSIS
      67. FIGURE 20 LOGITECH INTERNATIONAL S.A.: FINANCIAL OVERVIEW SNAPSHOT
      68. FIGURE 21 LOGITECH INTERNATIONAL S.A.: SWOT ANALYSIS
      69. FIGURE 22 VENOM UK LTD: FINANCIAL OVERVIEW SNAPSHOT
      70. FIGURE 23 VENOM UK LTD: SWOT ANALYSIS
      71. FIGURE 24 OCULUS VR: FINANCIAL OVERVIEW SNAPSHOT
      72. FIGURE 25 OCULUS VR: SWOT ANALYSIS
      73. FIGURE 26 PLAYSTATION: FINANCIAL OVERVIEW SNAPSHOT
      74. FIGURE 27 PLAYSTATION: SWOT ANALYSIS
      75. FIGURE 28 LINDEN RESEARCH: FINANCIAL OVERVIEW SNAPSHOT
      76. FIGURE 29 LINDEN RESEARCH: SWOT ANALYSIS
      77. FIGURE 30 SEGA GAMES: FINANCIAL OVERVIEW SNAPSHOT
      78. FIGURE 31 SEGA GAMES: SWOT ANALYSIS

    Gaming Hardware Market Segmentation

    Gaming Hardware Product Type Outlook (USD Billion, 2020-2034)

    • Consoles
    • Accessories

    Gaming Hardware End Use Outlook (USD Billion, 2020-2034)

    • Commercial
    • Residential

    Gaming Hardware Regional Outlook (USD Billion, 2020-2034)

    • North America Outlook (USD Billion, 2020-2034)
      • North America Gaming Hardware by Product Type
        • Consoles
        • Accessories
      • North America Gaming Hardware by End User
        • Commercial
        • Residential
      • US Outlook (USD Billion, 2020-2034)
      • US Gaming Hardware by Product Type
        • Consoles
        • Accessories
      • US Gaming Hardware by End User
        • Commercial
        • Residential
      • CANADA Outlook (USD Billion, 2020-2034)
      • CANADA Gaming Hardware by Product Type
        • Consoles
        • Accessories
      • CANADA Gaming Hardware by End User
        • Commercial
        • Residential
    • Europe Outlook (USD Billion, 2020-2034)
      • Europe Gaming Hardware by Product Type
        • Consoles
        • Accessories
      • Europe Gaming Hardware by End User
        • Commercial
        • Residential
      • Germany Outlook (USD Billion, 2020-2034)
      • Germany Gaming Hardware by Product Type
        • Consoles
        • Accessories
      • Germany Gaming Hardware by End User
        • Commercial
        • Residential
      • France Outlook (USD Billion, 2020-2034)
      • France Gaming Hardware by Product Type
        • Consoles
        • Accessories
      • France Gaming Hardware by End User
        • Commercial
        • Residential
      • UK Outlook (USD Billion, 2020-2034)
      • UK Gaming Hardware by Product Type
        • Consoles
        • Accessories
      • UK Gaming Hardware by End User
        • Commercial
        • Residential
      • ITALY Outlook (USD Billion, 2020-2034)
      • ITALY Gaming Hardware by Product Type
        • Consoles
        • Accessories
      • ITALY Gaming Hardware by End User
        • Commercial
        • Residential
      • SPAIN Outlook (USD Billion, 2020-2034)
      • Spain Gaming Hardware by Product Type
        • Consoles
        • Accessories
      • Spain Gaming Hardware by End User
        • Commercial
        • Residential
      • Rest Of Europe Outlook (USD Billion, 2020-2034)
      • Rest Of Europe Gaming Hardware by Product Type
        • Consoles
        • Accessories
      • REST OF EUROPE Gaming Hardware by End User
        • Commercial
        • Residential
    • Asia-Pacific Outlook (USD Billion, 2020-2034)
      • Asia-Pacific Gaming Hardware by Product Type
        • Consoles
        • Accessories
      • Asia-Pacific Gaming Hardware by End User
        • Commercial
        • Residential
      • China Outlook (USD Billion, 2020-2034)
      • China Gaming Hardware by Product Type
        • Consoles
        • Accessories
      • China Gaming Hardware by End User
        • Commercial
        • Residential
      • Japan Outlook (USD Billion, 2020-2034)
      • Japan Gaming Hardware by Product Type
        • Consoles
        • Accessories
      • Japan Gaming Hardware by End User
        • Commercial
        • Residential
      • India Outlook (USD Billion, 2020-2034)
      • India Gaming Hardware by Product Type
        • Consoles
        • Accessories
      • India Gaming Hardware by End User
        • Commercial
        • Residential
      • Australia Outlook (USD Billion, 2020-2034)
      • Australia Gaming Hardware by Product Type
        • Consoles
        • Accessories
      • Australia Gaming Hardware by End User
        • Commercial
        • Residential
      • Rest of Asia-Pacific Outlook (USD Billion, 2020-2034)
      • Rest of Asia-Pacific Gaming Hardware by Product Type
        • Consoles
        • Accessories
      • Rest of Asia-Pacific Gaming Hardware by End User
        • Commercial
        • Residential
    • Rest of the World Outlook (USD Billion, 2020-2034)
      • Rest of the World Gaming Hardware by Product Type
        • Consoles
        • Accessories
      • Rest of the World Gaming Hardware by End User
        • Commercial
        • Residential
      • Middle East Outlook (USD Billion, 2020-2034)
      • Middle East Gaming Hardware by Product Type
        • Consoles
        • Accessories
      • Middle East Gaming Hardware by End User
        • Commercial
        • Residential
      • Africa Outlook (USD Billion, 2020-2034)
      • Africa Gaming Hardware by Product Type
        • Consoles
        • Accessories
      • Africa Gaming Hardware by End User
        • Commercial
        • Residential
      • Latin America Outlook (USD Billion, 2020-2034)
      • Latin America Gaming Hardware by Product Type
        • Consoles
        • Accessories
      • Latin America Gaming Hardware by End User
        • Commercial
        • Residential
    Infographic

    Free Sample Request

    Kindly complete the form below to receive a free sample of this Report

    Get Free Sample

    Customer Strories

    “I am very pleased with how market segments have been defined in a relevant way for my purposes (such as "Portable Freezers & refrigerators" and "last-mile"). In general the report is well structured. Thanks very much for your efforts.”

    Victoria Milne

    Founder
    Case Study
    Chemicals and Materials