Segmentation Quick Reference
| Dimension | Sub-Segments | Dominant Segment | Fastest Growing Segment |
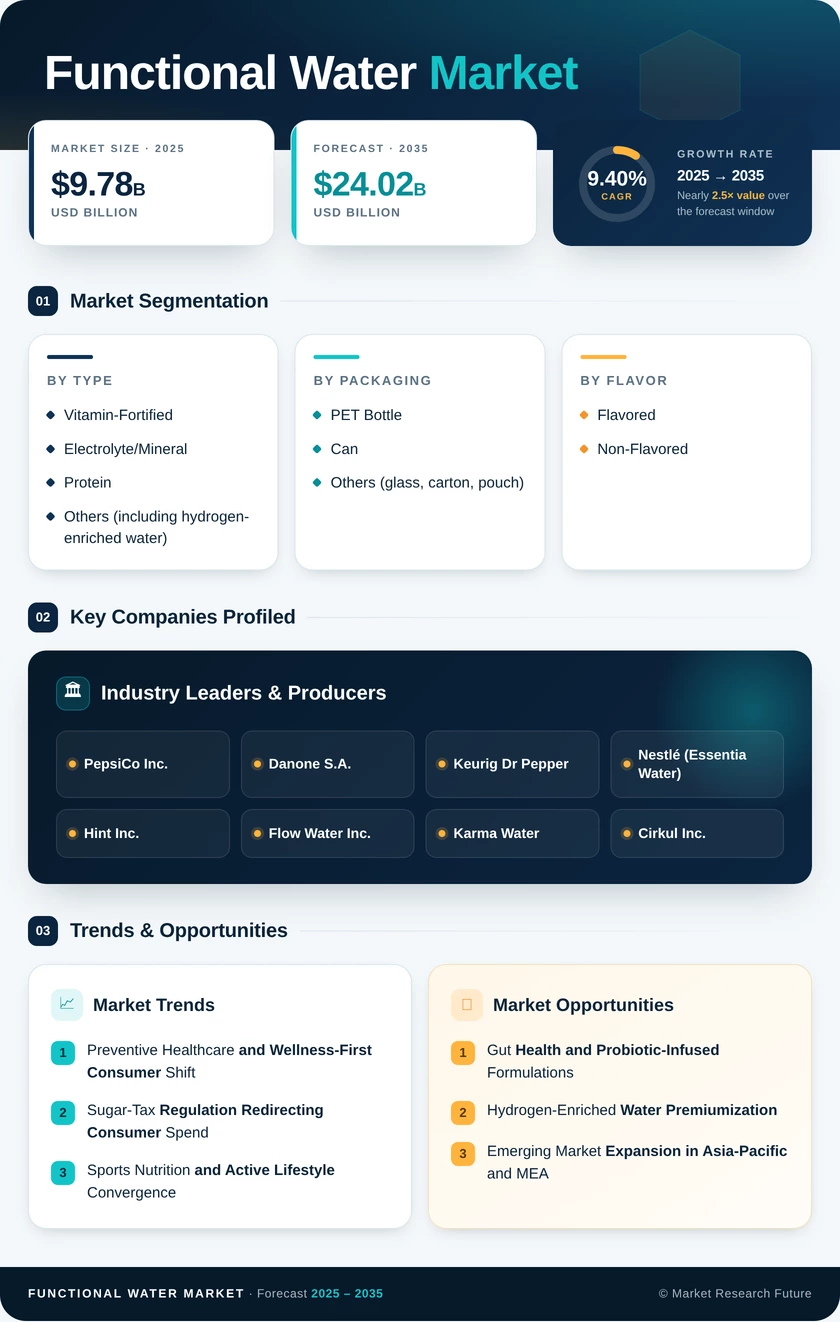
| Product Type | Vitamin-Fortified, Protein, Electrolyte/Mineral, Others | Vitamin-Fortified | Others (Hydrogen-Enriched Water) |
| Packaging | PET Bottle, Can, Others | PET Bottle | Can |
| Flavor | Flavored, Non-Flavored | Flavored | Non-Flavored |
| Distribution Channel | Supermarkets/Hypermarkets, Convenience/Grocery Stores, Online Retail Stores, Other Distribution Channels | Supermarkets/Hypermarkets | Online Retail Stores |
Market Segmentation Overview
By Product Type
| Sub-Segment | Key Trend |
| Vitamin-Fortified | Immune-support and daily-dose convenience driving mainstream adoption |
| Protein | Low-calorie recovery positioning targeting active lifestyle consumers |
| Electrolyte/Mineral | Sports nutrition crossover and post-workout hydration |
| Others (Hydrogen-Enriched Water) | Clinical research-backed antioxidant and anti-inflammatory claims |
Vitamin-fortified water continues to anchor the functional water market's product mix, benefiting from universal consumer understanding of vitamin supplementation and broad flavor variety. The "Others" category, led by hydrogen-enriched water, is growing fastest as clinical validation and premiumization trends attract health-conscious early adopters willing to pay higher price points.
By Packaging
| Sub-Segment | Key Trend |
| PET Bottle | Still dominant but facing sustainability-driven share erosion |
| Can | Premium aesthetics and infinite recyclability driving rapid adoption |
| Others (Glass, Carton, Pouch) | Niche eco-premium and refillable format experimentation |
PET bottles remain the packaging workhorse of the functional water market due to portability and low cost, but aluminum cans are rapidly gaining share as brands align with sustainability expectations and premium shelf positioning.
By Flavor
| Sub-Segment | Key Trend |
| Flavored | Citrus, berry, and tropical profiles sustain repeat purchase |
| Non-Flavored | Purity-focused consumers choosing alkaline and mineral-rich variants |
Flavored variants command the majority of functional water sales, though non-flavored products — anchored by alkaline ionized water — are growing faster as purity and simplicity messaging resonates with health-purist demographics.
By Distribution Channel
| Sub-Segment | Key Trend |
| Supermarkets/Hypermarkets | Dedicated wellness aisles and private-label programs |
| Convenience/Grocery Stores | On-the-go single-serve impulse purchases |
| Online Retail Stores | Subscription and DTC models driving the fastest growth |
| Other Distribution Channels | Fitness centers, hospitality, workplace vending |
Supermarkets and hypermarkets dominate the functional water market's distribution landscape through high-traffic placement and promotional programs. Online retail is the fastest-growing channel, with subscription models and marketplace discovery enabling emerging brands to scale without traditional retail gatekeeping.