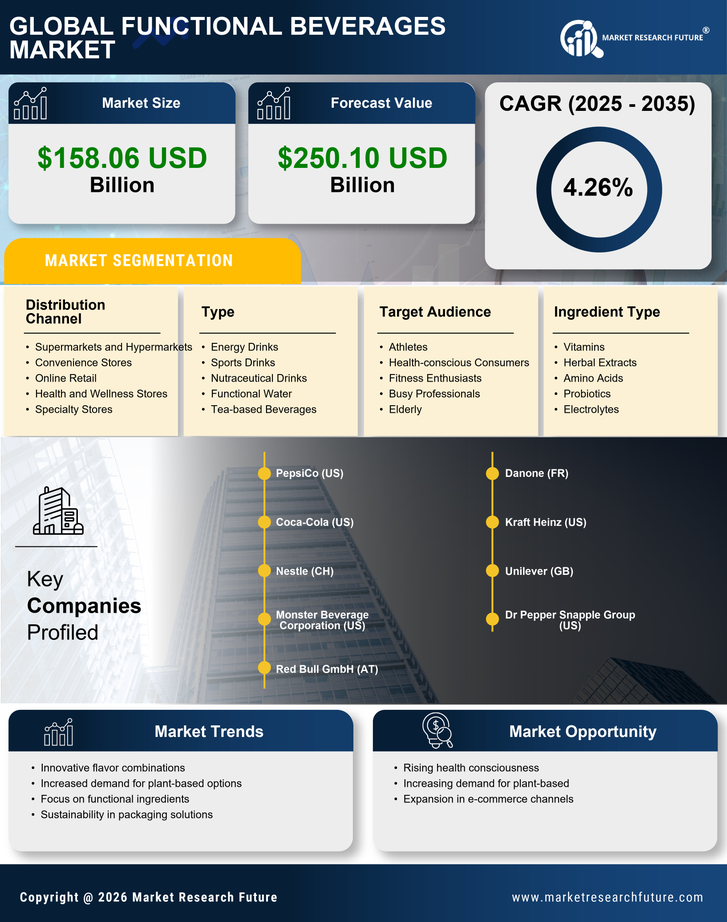
Functional Beverages Market
ID: MRFR/FnB/1331-CR
110 Pages
Sakshi Gupta
Last Updated: May 02, 2026
Global Functional Beverages Market Size, Share, Industry Trend & Analysis Research Report By Product Type (Energy Drinks, Sports Drinks, Nutraceutical Drinks, Functional Water, Tea-based Beverages), By Target Audience (Athletes, Health-conscious Consumers, Fitness Enthusiasts, Busy Professionals, Elderly), By Distribution Channel (Supermarkets and Hypermarkets, Convenience Stores, Online Retail, Health and Wellness Stores, Specialty Stores), By Ingredient Type (Vitamins, Herbal Extracts, Amino Acids, Probiotics, Electrolytes) andBy Regional (North America, Europe, South America, Asia Pacific, Middle East and Africa)- Forecast to 2035.