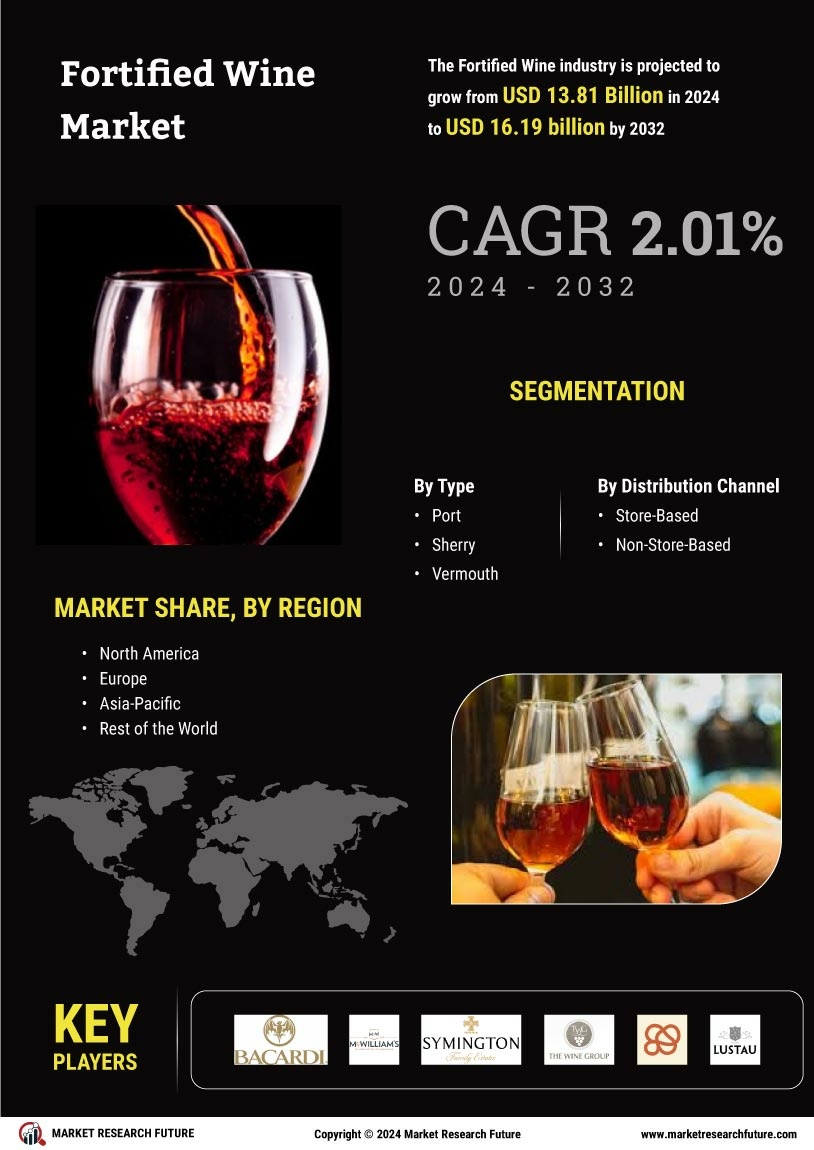
ID: MRFR/F-B & N/2640-HCR | 110 Pages | Author: Sakshi Gupta | November 2023
TABLE OF CONTENTS
1. 1 EXECUTIVE SUMMARY
1.1. Market Attractiveness Analysis
1.1.1. Global Fortified Wine Market, by Type
1.1.2. Global Fortified Wine Market, by Distribution Channel
1.1.3. Global Fortified Wine Market, by Region
2. MARKET INTRODUCTION
2.1. Definition
2.2. Scope of the Study
2.3. Market Structure
2.4. Key Buying Criteria
2.5. Macro Factor Indicator Analysis
3. RESEARCH METHODOLOGY
3.1. Research Process
3.2. Primary Research
3.3. Secondary Research
3.4. Market Size Estimation
3.5. Forecast Model
3.6. List of Assumptions
4. MARKET DYNAMICS
4.1. Introduction
4.2. Drivers
4.2.1. Driver 1
4.2.2. Driver 2
4.3. Restraints
4.3.1. Restraint 1
4.3.2. Restraint 2
4.4. Opportunities
4.4.1. Opportunity 1
4.4.2. Opportunity 2
4.5. Challenges
4.5.1. Challenge 1
4.5.2. Challenge 2
5. MARKET FACTOR ANALYSIS
5.1. Value Chain Analysis
5.2. Supply Chain Analysis
5.3. Porterβs Five Forces Model
5.3.1. Bargaining Power of Suppliers
5.3.2. Bargaining Power of Buyers
5.3.3. Threat of New Entrants
5.3.4. Threat of Substitutes
5.3.5. Intensity of Rivalry
6. GLOBAL FORTIFIED WINE MARKET, BY TYPE
6.1. Introduction
6.2. Port
6.2.1. Port: Market Estimates & Forecast, by Region/Country, 2023β2032
6.3. Sherry
6.3.1. Sherry: Market Estimates & Forecast, by Region/Country, 2023β2032
6.4. Vermouth
6.4.1. Vermouth: Market Estimates & Forecast, by Region/Country, 2023β2032
6.5. Others
6.5.1. Others: Market Estimates & Forecast, by Region/Country, 2023β2032
7. GLOBAL FORTIFIED WINE MARKET, BY DISTRIBUTION CHANNEL
7.1. Introduction
7.2. Store-Based
7.2.1. Store-Based: Market Estimates & Forecast, by Region/Country, 2023β2032
7.2.2. Supermarkets & Hypermarkets
7.2.2.1. Supermarkets & Hypermarkets: Market Estimates & Forecast, by Region/Country, 2023β2032
7.2.3. Specialty Stores
7.2.3.1. Specialty Stores: Market Estimates & Forecast, by Region/Country, 2023β2032
7.2.4. Others
7.2.4.1. Others: Market Estimates & Forecast, by Region/Country, 2023β2032
7.3. Non-Store-Based
7.3.1. Non-Store-Based: Market Estimates & Forecast, by Region/Country, 2023β2032
8. GLOBAL FORTIFIED WINE MARKET, BY REGION
8.1. Introduction
8.2. North America
8.2.1. Market Estimates & Forecast, by Type, 2023β2032
8.2.2. Market Estimates & Forecast, by Distribution Channel, 2023β2032
8.2.3. Market Estimates & Forecast, by Country, 2023β2032
8.2.4. US
8.2.4.1. Market Estimates & Forecast, by Type, 2023β2032
8.2.4.2. Market Estimates & Forecast, by Distribution Channel, 2023β2032
8.2.5. Canada
8.2.5.1. Market Estimates & Forecast, by Type, 2023β2032
8.2.5.2. Market Estimates & Forecast, by Distribution Channel, 2023β2032
8.2.6. Mexico
8.2.6.1. Market Estimates & Forecast, by Type, 2023β2032
8.2.6.2. Market Estimates & Forecast, by Distribution Channel, 2023β2032
8.3. Europe
8.3.1. Market Estimates & Forecast, by Type, 2023β2032
8.3.2. Market Estimates & Forecast, by Distribution Channel, 2023β2032
8.3.3. Market Estimates & Forecast, by Country, 2023β2032
8.3.4. Germany
8.3.4.1. Market Estimates & Forecast, by Type, 2023β2032
8.3.4.2. Market Estimates & Forecast, by Distribution Channel, 2023β2032
8.3.5. UK
8.3.5.1. Market Estimates & Forecast, by Type, 2023β2032
8.3.5.2. Market Estimates & Forecast, by Distribution Channel, 2023β2032
8.3.6. France
8.3.6.1. Market Estimates & Forecast, by Type, 2023β2032
8.3.6.2. Market Estimates & Forecast, by Distribution Channel, 2023β2032
8.3.7. Spain
8.3.7.1. Market Estimates & Forecast, by Type, 2023β2032
8.3.7.2. Market Estimates & Forecast, by Distribution Channel, 2023β2032
8.3.8. Italy
8.3.8.1. Market Estimates & Forecast, by Type, 2023β2032
8.3.8.2. Market Estimates & Forecast, by Distribution Channel, 2023β2032
8.3.9. Rest of Europe
8.3.9.1. Market Estimates & Forecast, by Type, 2023β2032
8.3.9.2. Market Estimates & Forecast, by Distribution Channel, 2023β2032
8.4. Asia-Pacific
8.4.1. Market Estimates & Forecast, by Type, 2023β2032
8.4.2. Market Estimates & Forecast, by Distribution Channel, 2023β2032
8.4.3. Market Estimates & Forecast, by Country, 2023β2032
8.4.4. China
8.4.4.1. Market Estimates & Forecast, by Type, 2023β2032
8.4.4.2. Market Estimates & Forecast, by Distribution Channel, 2023β2032
8.4.5. Japan
8.4.5.1. Market Estimates & Forecast, by Type, 2023β2032
8.4.5.2. Market Estimates & Forecast, by Distribution Channel, 2023β2032
8.4.6. India
8.4.6.1. Market Estimates & Forecast, by Type, 2023β2032
8.4.6.2. Market Estimates & Forecast, by Distribution Channel, 2023β2032
8.4.7. Australia & New Zealand
8.4.7.1. Market Estimates & Forecast, by Type, 2023β2032
8.4.7.2. Market Estimates & Forecast, by Distribution Channel, 2023β2032
8.4.8. Rest of Asia-Pacific
8.4.8.1. Market Estimates & Forecast, by Type, 2023β2032
8.4.8.2. Market Estimates & Forecast, by Distribution Channel, 2023β2032
8.5. Rest of the World
8.5.1. Market Estimates & Forecast, by Type, 2023β2032
8.5.2. Market Estimates & Forecast, by Distribution Channel, 2023β2032
8.5.3. Market Estimates & Forecast, by Region, 2023β2032
8.5.4. South America
8.5.4.1. Market Estimates & Forecast, by Type, 2023β2032
8.5.4.2. Market Estimates & Forecast, by Distribution Channel, 2023β2032
8.5.5. Middle East
8.5.5.1. Market Estimates & Forecast, by Type, 2023β2032
8.5.5.2. Market Estimates & Forecast, by Distribution Channel, 2023β2032
8.5.6. Africa
8.5.6.1. Market Estimates & Forecast, by Type, 2023β2032
8.5.6.2. Market Estimates & Forecast, by Distribution Channel, 2023β2032
9. COMPETITIVE LANDSCAPE
9.1. Introduction
9.2. Competitive Benchmarking
9.3. Development Share Analysis
9.4. Key Developments & Growth Strategies
10. COMPANY PROFILES
10.1. Bacardi Limited
10.1.1. Company Overview
10.1.2. Financial Overview
10.1.3. Products Offered
10.1.4. Key Developments
10.1.5. SWOT Analysis
10.1.6. Key Strategies
10.2. Davide Campari-Milano S.p.A
10.2.1. Company Overview
10.2.2. Financial Overview
10.2.3. Products Offered
10.2.4. Key Developments
10.2.5. SWOT Analysis
10.2.6. Key Strategies
10.3. The Wine Group
10.3.1. Company Overview
10.3.2. Financial Overview
10.3.3. Products Offered
10.3.4. Key Developments
10.3.5. SWOT Analysis
10.3.6. Key Strategies
10.4. E&J Gallo Winery
10.4.1. Company Overview
10.4.2. Financial Overview
10.4.3. Products Offered
10.4.4. Key Developments
10.4.5. SWOT Analysis
10.4.6. Key Strategies
10.5. Anchor Brewing Company
10.5.1. Company Overview
10.5.2. Financial Overview
10.5.3. Products Offered
10.5.4. Key Developments
10.5.5. SWOT Analysis
10.5.6. Key Strategies
10.6. Atsby Vermouth
10.6.1. Company Overview
10.6.2. Financial Overview
10.6.3. Products Offered
10.6.4. Key Developments
10.6.5. SWOT Analysis
10.6.6. Key Strategies
10.7. Gancia
10.7.1. Company Overview
10.7.2. Financial Overview
10.7.3. Products Offered
10.7.4. Key Developments
10.7.5. SWOT Analysis
10.7.6. Key Strategies
10.8. Imbue
10.8.1. Company Overview
10.8.2. Financial Overview
10.8.3. Products Offered
10.8.4. Key Developments
10.8.5. SWOT Analysis
10.8.6. Key Strategies
10.9. Symington Family Estates
10.9.1. Company Overview
10.9.2. Financial Overview
10.9.3. Products Offered
10.9.4. Key Developments
10.9.5. SWOT Analysis
10.9.6. Key Strategies
10.10. Sogrape Vinhos, S.A.
10.10.1. Company Overview
10.10.2. Financial Overview
10.10.3. Products Offered
10.10.4. Key Developments
10.10.5. SWOT Analysis
10.10.6. Key Strategies
10.11. McWilliamβs Wines Group Ltd
10.11.1. Company Overview
10.11.2. Financial Overview
10.11.3. Products Offered
10.11.4. Key Developments
10.11.5. SWOT Analysis
10.11.6. Key Strategies
10.12. Bodegas Lustau
10.12.1. Company Overview
10.12.2. Financial Overview
10.12.3. Products Offered
10.12.4. Key Developments
10.12.5. SWOT Analysis
10.12.6. Key Strategies
10.13. GonzΓ‘lez Byass
10.13.1. Company Overview
10.13.2. Financial Overview
10.13.3. Products Offered
10.13.4. Key Developments
10.13.5. SWOT Analysis
10.13.6. Key Strategies
11. APPENDIX
11.1. General Sources & References
11.2. List of Abbreviation
LIST OF TABLES
Table 1 Global Fortified Wine Market, by Region, 2023β2032 (USD Million)
Table 2 Global Fortified Wine Market, by Type, 2023β2032 (USD Million)
Table 3 Global Fortified Wine Market, by Distribution Channel, 2023β2032 (USD Million)
Table 4 North America: Fortified Wine Market, by Country, 2023β2032 (USD Million)
Table 5 North America: Fortified Wine Market, by Type, 2023β2032 (USD Million)
Table 6 North America: Fortified Wine Market, by Distribution Channel, 2023β2032 (USD Million)
Table 7 US: Fortified Wine Market, by Type, 2023β2032 (USD Million)
Table 8 US: Fortified Wine Market, by Distribution Channel, 2023β2032 (USD Million)
Table 9 Canada: Fortified Wine Market, by Type, 2023β2032 (USD Million)
Table 10 Canada: Fortified Wine Market, by Distribution Channel, 2023β2032 (USD Million)
Table 11 Mexico: Fortified Wine Market, by Type, 2023β2032 (USD Million)
Table 12 Mexico: Fortified Wine Market, by Distribution Channel, 2023β2032 (USD Million)
Table 13 Europe: Fortified Wine Market, by Country, 2023β2032 (USD Million)
Table 14 Europe: Fortified Wine Market, by Type, 2023β2032 (USD Million)
Table 15 Europe: Fortified Wine Market, by Distribution Channel, 2023β2032 (USD Million)
Table 16 Germany: Fortified Wine Market, by Type, 2023β2032 (USD Million)
Table 17 Germany: Fortified Wine Market, by Distribution Channel, 2023β2032 (USD Million)
Table 18 France: Fortified Wine Market, by Type, 2023β2032 (USD Million)
Table 19 France: Fortified Wine Market, by Distribution Channel, 2023β2032 (USD Million)
Table 20 Italy: Fortified Wine Market, by Type, 2023β2032 (USD Million)
Table 21 Italy: Fortified Wine Market, by Distribution Channel, 2023β2032 (USD Million)
Table 22 Spain: Fortified Wine Market, by Type, 2023β2032 (USD Million)
Table 23 Spain: Fortified Wine Market, by Distribution Channel, 2023β2032 (USD Million)
Table 24 UK: Fortified Wine Market, by Type, 2023β2032 (USD Million)
Table 25 UK: Fortified Wine Market, by Distribution Channel, 2023β2032 (USD Million)
Table 26 Rest of Europe: Fortified Wine Market, by Type, 2023β2032 (USD Million)
Table 27 Rest of Europe: Fortified Wine Market, by Distribution Channel, 2023β2032 (USD Million)
Table 28 Asia-Pacific: Fortified Wine Market, by Country, 2023β2032 (USD Million)
Table 29 Asia-Pacific: Fortified Wine Market, by Type, 2023β2032 (USD Million)
Table 30 Asia-Pacific: Fortified Wine Market, by Distribution Channel, 2023β2032 (USD Million)
Table 31 China: Fortified Wine Market, by Type, 2023β2032 (USD Million)
Table 32 China: Fortified Wine Market, by Distribution Channel, 2023β2032 (USD Million)
Table 33 India: Fortified Wine Market, by Type, 2023β2032 (USD Million)
Table 34 India: Fortified Wine Market, by Distribution Channel, 2023β2032 (USD Million)
Table 35 Japan: Fortified Wine Market, by Type, 2023β2032 (USD Million)
Table 36 Japan: Fortified Wine Market, by Distribution Channel, 2023β2032 (USD Million)
Table 37 Australia & New Zealand: Fortified Wine Market, by Type, 2023β2032 (USD Million)
Table 38 Australia & New Zealand: Fortified Wine Market, by Distribution Channel, 2023β2032 (USD Million)
Table 39 Rest of Asia-Pacific: Fortified Wine Market, by Type, 2023β2032 (USD Million)
Table 40 Rest of Asia-Pacific: Fortified Wine Market, by Distribution Channel, 2023β2032 (USD Million)
Table 41 Rest of the World (RoW): Fortified Wine Market, by Country, 2023β2032 (USD Million)
Table 42 Rest of the World (RoW): Fortified Wine Market, by Type, 2023β2032 (USD Million)
Table 43 Rest of the World (RoW): Fortified Wine Market, by Distribution Channel, 2023β2032 (USD Million)
Table 44 South America: Fortified Wine Market, by Type, 2023β2032 (USD Million)
Table 45 South America: Fortified Wine Market, by Distribution Channel, 2023β2032 (USD Million)
Table 46 Middle East: Fortified Wine Market, by Type, 2023β2032 (USD Million)
Table 47 Middle East: Fortified Wine Market, by Distribution Channel, 2023β2032 (USD Million)
Table 48 Africa: Fortified Wine Market, by Type, 2023β2032 (USD Million)
Table 49 Africa: Fortified Wine Market, by Distribution Channel, 2023β2032 (USD Million)
LIST OF FIGURES
FIGURE 1 Global Fortified Wine Market Segmentation
FIGURE 2 Forecast Research Methodology
FIGURE 3 Five Forces Analysis of the Global Fortified Wine Market
FIGURE 4 Value Chain of the Global Fortified Wine Market
FIGURE 5 Share of the Global Fortified Wine Market in 2023, by Country (%)
FIGURE 6 Global Fortified Wine Market, by Region, 2023β2032,
FIGURE 7 Global Fortified Wine Market Size, by Type, 2023
FIGURE 8 Share of the Global Fortified Wine Market, by Type, 2023β2032 (%)
FIGURE 9 Global Fortified Wine Market Size, by Distribution Channel, 2023
FIGURE 10 Share of the Global Fortified Wine Market, by Distribution Channel, 2023β2032 (%)
Fortified Wine Type Outlook (USD Billion, 2018-2032)
Port
Sherry
Vermouth
Others
Fortified Wine Distribution Channel Outlook (USD Billion, 2018-2032)
Store-Based
Non-Store-Based
Fortified Wine Regional Outlook (USD Billion, 2018-2032)
North America Outlook (USD Billion, 2018-2032)
North America Fortified Wine by Type
Port
Sherry
Vermouth
Others
North America Fortified Wine by Distribution Channel
Store-Based
Non-Store-Based
US Outlook (USD Billion, 2018-2032)
US Fortified Wine by Type
Port
Sherry
Vermouth
Others
US Fortified Wine Distribution Channel
Store-Based
Non-Store-Based
CANADA Outlook (USD Billion, 2018-2032)
CANADA Fortified Wine by Type
Port
Sherry
Vermouth
Others
CANADA Fortified Wine by Distribution Channel
Store-Based
Non-Store-Based
Europe Outlook (USD Billion, 2018-2032)
Europe Fortified Wine by Type
Port
Sherry
Vermouth
Others
Europe Fortified Wine Distribution Channel
Store-Based
Non-Store-Based
Germany Outlook (USD Billion, 2018-2032)
Germany Fortified Wine by Type
Port
Sherry
Vermouth
Others
Germany Fortified Wine Distribution Channel
Store-Based
Non-Store-Based
France Outlook (USD Billion, 2018-2032)
France Fortified Wine by Type
Port
Sherry
Vermouth
Others
France Fortified Wine Distribution Channel
Store-Based
Non-Store-Based
UK Outlook (USD Billion, 2018-2032)
UK Fortified Wine by Type
Port
Sherry
Vermouth
Others
UK Fortified Wine Distribution Channel
Store-Based
Non-Store-Based
ITALY Outlook (USD Billion, 2018-2032)
ITALY Fortified Wine by Type
Port
Sherry
Vermouth
Others
ITALY Fortified Wine Distribution Channel
Store-Based
Non-Store-Based
SPAIN Outlook (USD Billion, 2018-2032)
Spain Fortified Wine by Type
Port
Sherry
Vermouth
Others
Spain Fortified Wine Distribution Channel
Store-Based
Non-Store-Based
Rest Of Europe Outlook (USD Billion, 2018-2032)
Rest Of Europe Fortified Wine by Type
Port
Sherry
Vermouth
Others
REST OF EUROPE Fortified Wine Distribution Channel
Store-Based
Non-Store-Based
Asia-Pacific Outlook (USD Billion, 2018-2032)
Asia-Pacific Fortified Wine by Type
Port
Sherry
Vermouth
Others
Asia-Pacific Fortified Wine Distribution Channel
Store-Based
Non-Store-Based
China Outlook (USD Billion, 2018-2032)
China Fortified Wine by Type
Port
Sherry
Vermouth
Others
China Fortified Wine Distribution Channel
Store-Based
Non-Store-Based
Japan Outlook (USD Billion, 2018-2032)
Japan Fortified Wine by Type
Port
Sherry
Vermouth
Others
Japan Fortified Wine Distribution Channel
Store-Based
Non-Store-Based
India Outlook (USD Billion, 2018-2032)
India Fortified Wine by Type
Port
Sherry
Vermouth
Others
India Fortified Wine Distribution Channel
Store-Based
Non-Store-Based
Australia Outlook (USD Billion, 2018-2032)
Australia Fortified Wine by Type
Port
Sherry
Vermouth
Others
Australia Fortified Wine Distribution Channel
Store-Based
Non-Store-Based
Rest of Asia-Pacific Outlook (USD Billion, 2018-2032)
Rest of Asia-Pacific Fortified Wine by Type
Port
Sherry
Vermouth
Others
Rest of Asia-Pacific Fortified Wine Distribution Channel
Store-Based
Non-Store-Based
Rest of the World Outlook (USD Billion, 2018-2032)
Rest of the World Fortified Wine by Type
Port
Sherry
Vermouth
Others
Rest of the World Fortified Wine Distribution Channel
Store-Based
Non-Store-Based
Middle East Outlook (USD Billion, 2018-2032)
Middle East Fortified Wine by Type
Port
Sherry
Vermouth
Others
Middle East Fortified Wine Distribution Channel
Store-Based
Non-Store-Based
Africa Outlook (USD Billion, 2018-2032)
Africa Fortified Wine by Type
Port
Sherry
Vermouth
Others
Africa Fortified Wine Distribution Channel
Store-Based
Non-Store-Based
Latin America Outlook (USD Billion, 2018-2032)
Latin America Fortified Wine by Type
Port
Sherry
Vermouth
Others
Latin America Fortified Wine Distribution Channel
Store-Based
Non-Store-Based
Research Methodology on Fortified Wine Market
INTRODUCTION
Fortified wine is an alcoholic beverage derived from wine. Concentrated grape must, distilled alcohol, sugar, and other ingredients are added to the wine to make fortified wine. Compared to traditional wines, fortified wines are more potent in terms of alcoholic content. There are several types of fortified wines available across the globe such as red fortified wines, sweet fortified wines, and dry fortified wines. Fortified wines are used by manufacturers in the preparation of non-alcoholic beverages. The shifting trend towards the consumption of non-alcoholic beverages and also the increasing health consciousness among consumers are expected to drive the fortified wine market from 2023 to 2030.
The market research report by Market Research Future (MRFR) is mentioned in this report is titled βFortified Wine Market β Global Industry Analysis, Size, Share, Growth, Trends and Forecast, 2023β2030β.
RESEARCH METHODOLOGY
2.1 Research Methodology
The research methodology of this report is based on a systematic and data-centric approach with the use of primary and secondary research sources. To establish the market size and market forecast, a bottom-up as well as a top-down approach was used. The key players in the market, their strategies and overall competitive dynamics were studied to assess their influence on the market. The research report also includes Porterβs Five Forces analysis to analyse the level of competition in the market.
2.2 Primary Research
The primary research for this report was conducted by market experts and industry professionals through qualitative sources like interviews, surveys and focus group discussions. For this research, four companies were selected based on the geographical regions of North America, Europe, Asia-Pacific and RoW which includes the USA, UK, Germany, China, Japan, India and the Middle East & Africa. The entire industry was segmented into seven key regions based on their geographical importance. The primary data was collected from key stakeholders and decision-makers including manufacturers, suppliers, distributors, and buyers among others in the industry.
2.3 Secondary Research
The secondary research for this report included industry association journals, company websites, SEC filings, press releases, public databases and other proprietary databases. The secondary research also included several online and offline sources such as industry magazines, journals, databases and directories, among others. The secondary data were used to supplement the primary data and to verify the accuracy and reliability of the data.
2.4 Scope of the Report
This report provides an in-depth analysis of the fortified wine market, covering its market dynamics, segmentation, market growth, competitive landscape and global regional analysis. It is segmented into categories based on geography, type and distribution channel. The geographical segmentation includes North America, Europe, Asia-Pacific and the Rest of the World (RoW). The types of fortified wine covered in this report include red fortified wines, sweet fortified wines and dry fortified wines. For each type, the report further provides a detailed analysis of the market size and market forecast. The distribution channel segmentation includes supermarkets/hypermarkets, convenience stores, speciality stores, online stores, and others.
2.5 Market Estimation
The market data and figures were based on the market research and analysis guidelines of the Market Research Future (MRFR). Top-down and bottom-up approaches were used to estimate the market size and valuation. Market dynamics like drivers, constraints, trends and growth opportunities were analyzed in detail to provide an accurate market forecast for the years 2023 to 2030.
2.6 Data Triangulation
Data triangulation was used to verify the accuracy and reliability of the data collected from the different sources. The data was verified and validated by multiple sources such as market experts, industry professionals and key stakeholders. The triangulation methodology used included segmentation analysis, analysis of information from different countries, and statistical validation of quantitative data.
2.7 Forecasting Model
The market forecast was based on historical data and statistical modelling techniques. The year-on-year (Y-o-Y) growth rate was used to derive the market forecast for the years 2023 to 2030. The statistical model used was based on the Time Series analysis showing the historical market performance and trends.
2.8 Research Assumptions
The following assumptions were taken into consideration while conducting the research for this report.
CONCLUSION
The market report by MRFR provides an in-depth analysis of the fortified wine market. The report provides a comprehensive analysis of the market size, market dynamics, Porterβs Five Forces analysis, Y-o-Y Growth rate, market segmentation, market forecast and competitive landscape. The research methodology adopted for this report included primary and secondary research sources to ensure the accuracy and reliability of the data collected. The research report provides valuable insights on the fortified wine market which can be used by manufacturers, suppliers and buyers to gain a better understanding of the market and to make informed decisions.