Certified Global Research Member
Isomar fd.webp Wcrc 57.webp
Key Questions Answered
  • Global Market Outlook
  • In-depth analysis of global and regional trends
  • Analyze and identify the major players in the market, their market share, key developments, etc.
  • To understand the capability of the major players based on products offered, financials, and strategies.
  • Identify disrupting products, companies, and trends.
  • To identify opportunities in the market.
  • Analyze the key challenges in the market.
  • Analyze the regional penetration of players, products, and services in the market.
  • Comparison of major playersโ€™ financial performance.
  • Evaluate strategies adopted by major players.
  • Recommendations
Why Choose Market Research Future?
  • Vigorous research methodologies for specific market.
  • Knowledge partners across the globe
  • Large network of partner consultants.
  • Ever-increasing/ Escalating data base with quarterly monitoring of various markets
  • Trusted by fortune 500 companies/startups/ universities/organizations
  • Large database of 5000+ markets reports.
  • Effective and prompt pre- and post-sales support.

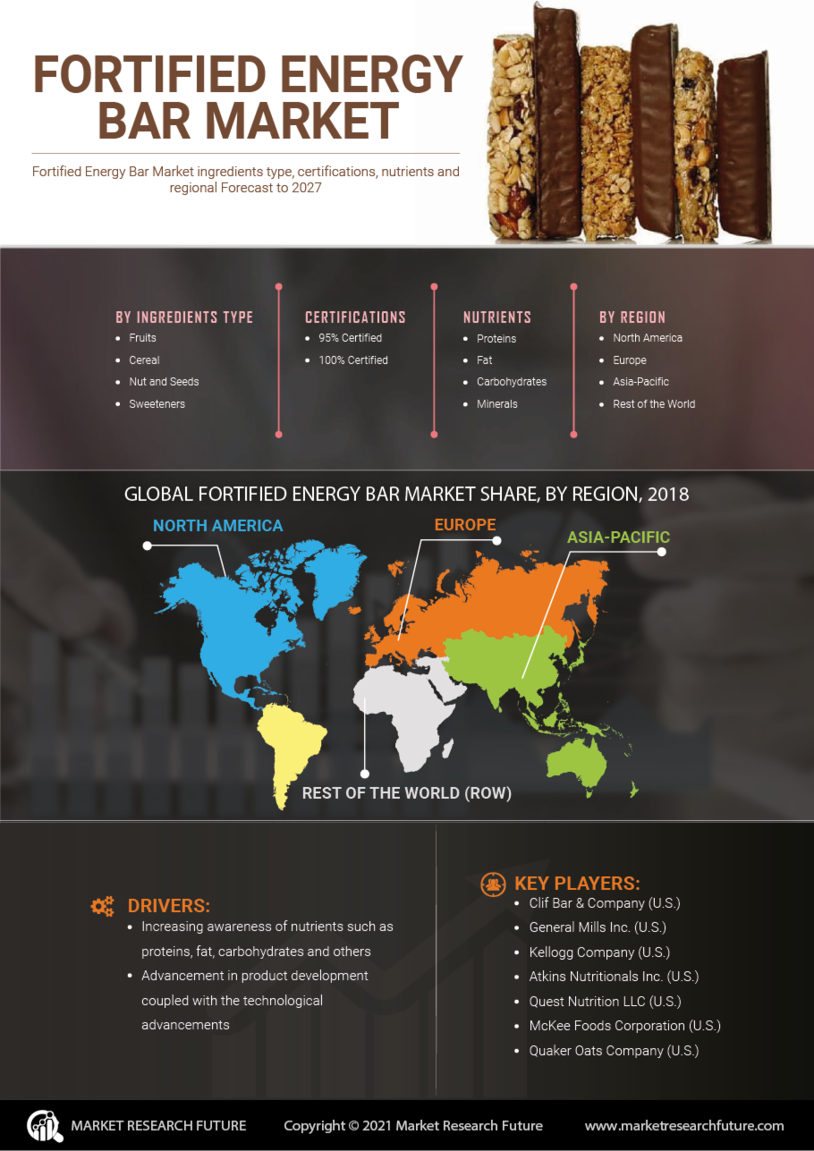
Fortified Energy Bar Market Global Information by Ingredients Type (Fruits, Cereal, Nut and Seeds, Sweeteners and others), Certifications (95% Certified, 100% Certified), Nutrients (Proteins, Fat, Carbohydrates, Minerals and others) and Region - Forecast till 2030


ID: MRFR/F-B & N/2603-HCR | 110 Pages | Author: Varsha More| May 2024
Leading companies partner with us for data-driven Insights
client_1 client_2 client_3 client_4 client_5 client_6 client_7 client_8 client_9 client_10
Please fill in Business Email for Quick Response

Table of Content

1 Executive Summary

2 Market Introduction

2.1 Definition

2.2 Scope of the study

2.2.1 Research Objectives

2.2.2 Assumptions

2.2.3 Limitations

2.3 Markets Structure

2.4 Stakeholders

3 Research Methodology

3.1 Research application

3.2 Secondary research

3.3 Primary research

3.4 Forecast model

3.5 Market Size estimation

4 Market Dynamics

4.1 Drivers

4.2 Restraints

4.3 Opportunities

4.4 Challenges

5 Market Trends

5.1 Trends in Supply/Certificationsion

5.2 Trends in Demand/Consumption

5.3 Emerging Markets (Supply & Demand)

5.4 Emerging Brands

5.5 Trade (Import-export) Analysis

5.6 Innovations in Certificationss/application

5.7 Macroeconomic indicators Analysis for top 5 Producing countries

6 Market Factor Analysis

6.1 Introduction

6.2 Value chain analysis

6.3 Porterโ€™s five forces

6.4 Supply Chain Analysis

7. Market-By Ingredients Type

7.1 Introduction

7.2 Market size (sub segments)

7.2.1 Fruits

7.2.2 Cereal

7.2.3 Nut & seeds

7.2.4. Sweeteners

7.2.5 Others

8. Market-By Certification Type

8.1 Introduction

8.2 Market size (sub segments)

8.2.1 95% Certified

8.2.2. 100% Certified

9. Market-By Nutrients

9.1 Introduction

9.2 Market size (sub segments)

9.2.1 Proteins

9.2.2 Fat

9.2.3 Carbohydrates

9.2.4 Minerals

9.2.5 Others

10. Market-By distribution channel

10.1 Introduction

10.2 Market size (sub segments)

10.2.1 Store Based

10.2.1.1 Hyper & super markets

10.2.1.2 Specialist Retailers

10.2.1.3 Convenience Stores

10.2.1.4 Others

10.2.2 Non Store Based

11. Market -By Region

11.1 Introduction

11.1.1 North America

11.1.1.1 U.S.

11.1.1.2 Canada

11.1.1.3 Mexico

11.2 Europe

11.2.1 Introduction

11.2.1.1 Germany

11.2.1.2 France

11.2.1.3 Italy

11.2.1.4 U.K

11.2.1.5 Rest of Europe

11.3 Asia Pacific

11.3.1 Introduction

11.3.1.1 China

11.3.1.2 India

11.3.1.3 Japan

11.3.1.4 Rest of Asia-Pacific

11.4 RoW

11.4.1 Introduction

11.4.1.1 Brazil

11.4.1.2 Argentina

11.4.1.3 Egypt

11.4.1.4 South Africa

11.4.1.5 Others

12. Competitive landscape

12.1 Introduction

12.2 Certifications Launch/Development

12.3 Partnerships and collaborations

12.4 Acquisitions

12.5 Business Expansion

13. Company Profiles

13.1 Clif Bar & Company (U.S.)

13.2 General Mills, Inc. (U.S.)

13.3 Kellogg Company (U.S.)

13.4 Atkins Nutritionals, Inc. (U.S.)

13.5 Quest Nutrition, LLC (U.S.)

13.6 McKee Foods Corporation (U.S.)

13.7 Quaker Oats Company (U.S.)

LIST OF TABLES

TABLE 1 PESTLE ANALYSIS - U.S.

TABLE 2 PESTLE ANALYSIS- IRELAND

TABLE 3 PESTLE ANALYSIS- CHINA

TABLE 4 PESTLE ANALYSIS- JAPAN

TABLE 5 PESTLE ANALYSIS- GERMANY

TABLE 6 KEY SUPPLIERS OF RAW MATERIALS FOR FORTIFIED ENERGY BAR

TABLE 7 GLOBAL FORTIFIED ENERGY BAR MARKET, BY Ingredients Type, (2020โ€“2027), USD MILLION

TABLE 8 GLOBAL FORTIFIED ENERGY BAR MARKET, BY Certifications Type, (2020โ€“2027), USD MILLION

TABLE 9 GLOBAL FORTIFIED ENERGY BAR MARKET, BY Distribution channel, (2020โ€“2027), USD MILLION

TABLE 10 GLOBAL FORTIFIED ENERGY BAR SALES AND GROWTH RATE (2020โ€“2027) USD MILLION

TABLE 11 GLOBAL FORTIFIED ENERGY BAR MARKET TOP 5 COUNTRIES

TABLE 12 GLOBAL FORTIFIED ENERGY BAR MARKET TOP COMPANIES-USD MILLION

TABLE 13 NORTH AMERICAN FORTIFIED ENERGY BAR MARKET, BY Ingredients Type, 2020โ€“2027 (USD MILLION)

TABLE 14 NORTH AMERICAN FORTIFIED ENERGY BAR MARKET, BY Certifications Type, 2020โ€“2027 (USD MILLION)

TABLE 15 NORTH AMERICAN FORTIFIED ENERGY BAR MARKET, BY Distribution channel, 2020โ€“2027 (USD MILLION)

TABLE 16 EUROPEAN FORTIFIED ENERGY BAR MARKET, BY Ingredients Type, 2020โ€“2027 (USD MILLION)

TABLE 17 EUROPEAN FORTIFIED ENERGY BAR MARKET, BY Certifications 2020โ€“2027 (USD MILLION)

TABLE 18 EUROPEAN FORTIFIED ENERGY BAR MARKET, BY Distribution channel, 2020โ€“2027 (USD MILLION)

TABLE 19 APAC FORTIFIED ENERGY BAR MARKET, BY Ingredients Type, 2020โ€“2027 (USD MILLION)

TABLE 20 APAC FORTIFIED ENERGY BAR MARKET, BY Certifications, 2020โ€“2027 (USD MILLION)

TABLE 21 APAC FORTIFIED ENERGY BAR MARKET, BY Distribution channel, 2020โ€“2027 (USD MILLION)

TABLE 22 REST OF THE WORLD FORTIFIED ENERGY BAR MARKET, BY Ingredients Type, 2020โ€“2027 (USD MILLION)

TABLE 23 REST OF THE WORLD FORTIFIED ENERGY BAR MARKET, BY Certifications 2020โ€“2027 (USD MILLION)

TABLE 24 REST OF THE WORLD FORTIFIED ENERGY BAR MARKET, BY Distribution Channel, 2020โ€“2027 (USD MILLION)

TABLE 25 COMPETITIVE LANDSCAPING BASED ON FINACIALS DURING THE YEAR 2020

LIST OF FIGURES

FIGURE 1 RESEARCH METHODOLOGY

FIGURE 2 PRIMARY DATA ANALYSIS APPROACH

FIGURE 3 SECONDARY DATA ANALYSIS APPROACH

FIGURE 4 TREND IN FORTIFIED ENERGY BAR IMPORTS 2020-27

FIGURE 5 GROWTH RATE IN FORTIFIED ENERGY BAR IMPORTS 2020-27

FIGURE 6 FORTIFIED ENERGY BAR IMPORTS MARKET SHARE BY TOP 5 IMPORTERS (2020 VS 2027)

FIGURE 7 TREND IN FORTIFIED ENERGY BAR EXPORTS 2020-27

FIGURE 8 GROWTH RATE FORTIFIED ENERGY BAR EXPORTS 2020-27

FIGURE 9 FORTIFIED ENERGY BAR EXPORTS MARKET SHARE BY TOP 5 EXPORTERS (2020 VS 2027)

FIGURE 10 VALUE CHAIN ANALYSIS

FIGURE 11 COST ANALYSIS: FORTIFIED ENERGY BAR

FIGURE 12 PORTERโ€™S FIVE FORCES ANALYSIS

FIGURE 13 FORTIFIED ENERGY BAR MARKET TRENDS BY Ingredients Type

FIGURE 14 FORTIFIED ENERGY BAR MARKET TRENDS BY Certifications Type

FIGURE 15 FORTIFIED ENERGY BAR MARKET TRENDS BY Distribution channel

FIGURE 16 FINANCIALS

Purchase Option
Single User $ 4,950
Multiuser License $ 5,950
Enterprise User $ 7,250
Compare Licenses
Tailored for You
  • Dedicated Research on any specifics segment or region.
  • Focused Research on specific players in the market.
  • Custom Report based only on your requirements.
  • Flexibility to add or subtract any chapter in the study.
  • Historic data from 2014 and forecasts outlook till 2040.
  • Flexibility of providing data/insights in formats (PDF, PPT, Excel).
  • Provide cross segmentation in applicable scenario/markets.