Food Antifoaming Agents Market Segmentation
Food Antifoaming Agents Market By Application (USD Million, 2025-2035)
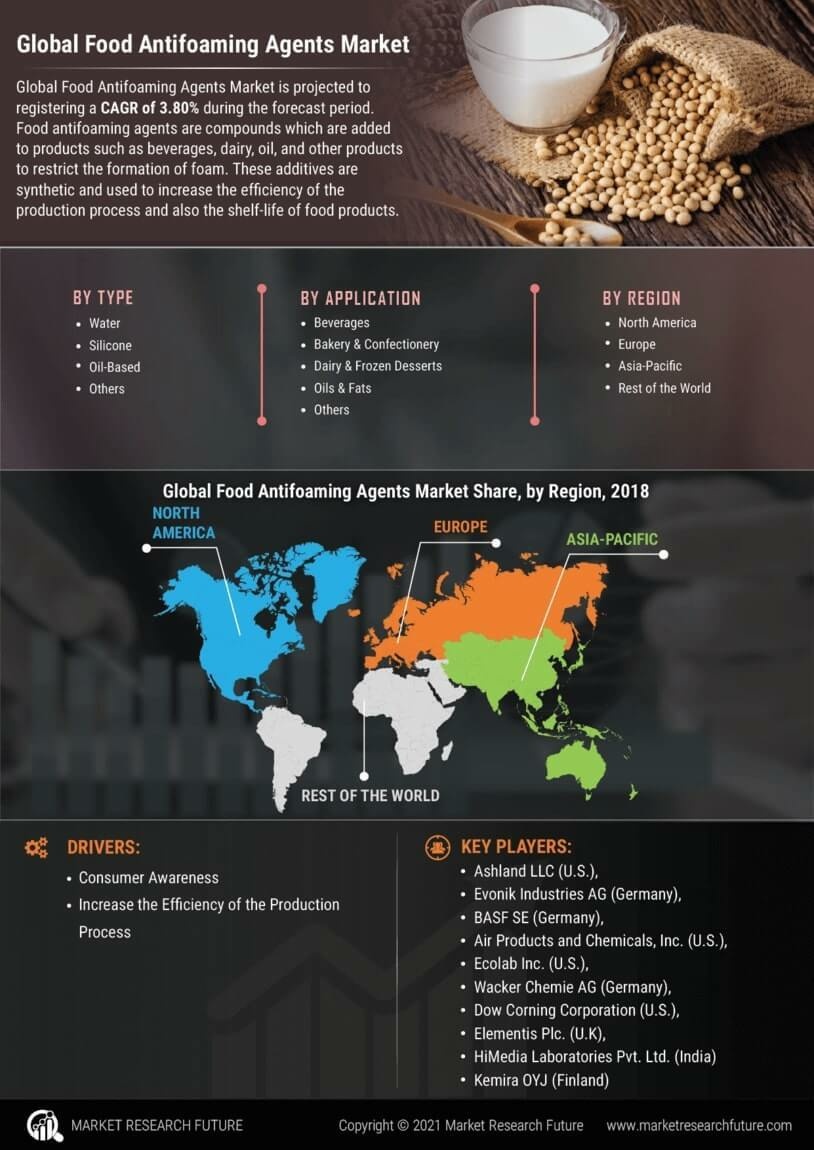
- Beverages
- Dairy Products
- Bakery
- Confectionery
- Fats and Oils
Food Antifoaming Agents Market By Formulation Type (USD Million, 2025-2035)
- Emulsifiers
- Surfactants
- Polymers
- Silicones
Food Antifoaming Agents Market By End Use (USD Million, 2025-2035)
- Food Processing
- Food Packaging
- Food Antifoaming Agents Market
Food Antifoaming Agents Market By Source (USD Million, 2025-2035)
- Plant-Based
- Synthetic
- Animal-Based
Food Antifoaming Agents Market By Functionality (USD Million, 2025-2035)
- Foam Control
- Stabilization
- Texture Improvement