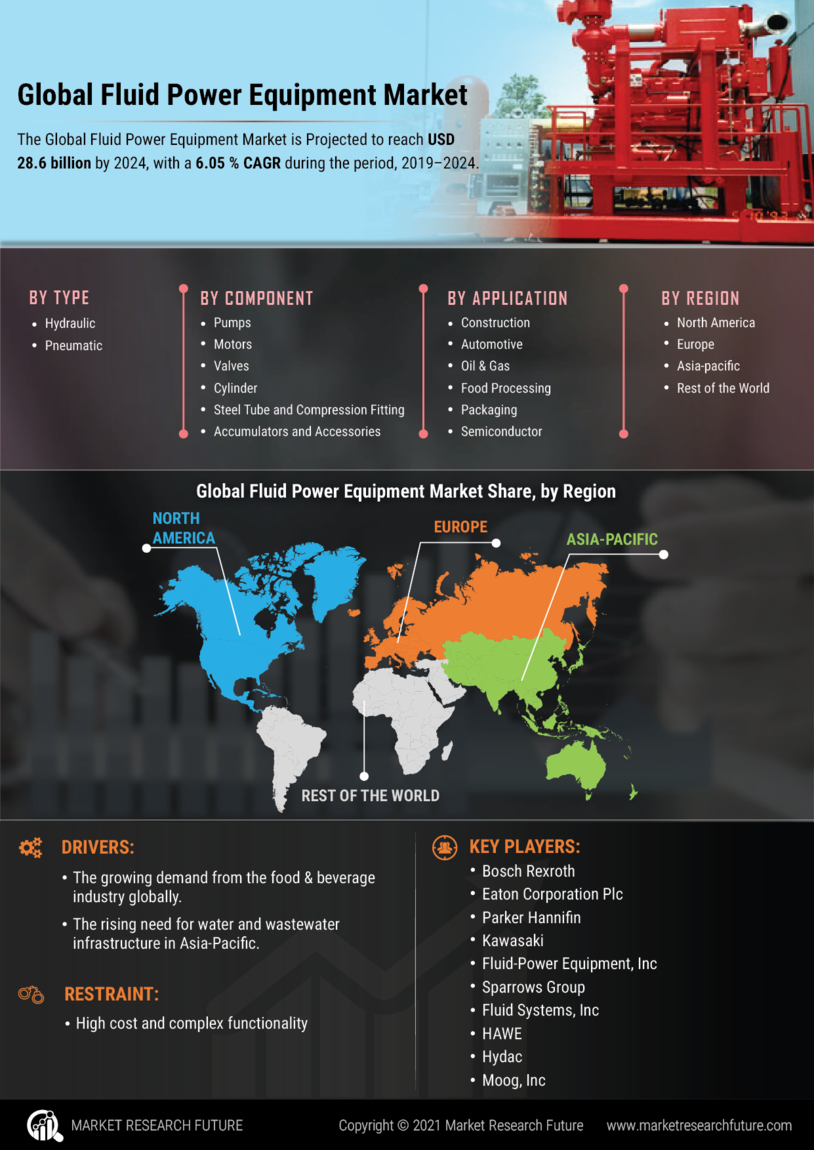
Certified Global Research Member
Isomar fd.webp Wcrc 57.webp
Key Questions Answered
  • Global Market Outlook
  • In-depth analysis of global and regional trends
  • Analyze and identify the major players in the market, their market share, key developments, etc.
  • To understand the capability of the major players based on products offered, financials, and strategies.
  • Identify disrupting products, companies, and trends.
  • To identify opportunities in the market.
  • Analyze the key challenges in the market.
  • Analyze the regional penetration of players, products, and services in the market.
  • Comparison of major playersโ€™ financial performance.
  • Evaluate strategies adopted by major players.
  • Recommendations
Why Choose Market Research Future?
  • Vigorous research methodologies for specific market.
  • Knowledge partners across the globe
  • Large network of partner consultants.
  • Ever-increasing/ Escalating data base with quarterly monitoring of various markets
  • Trusted by fortune 500 companies/startups/ universities/organizations
  • Large database of 5000+ markets reports.
  • Effective and prompt pre- and post-sales support.

Fluid Power Equipment Market Research Report Information By Type (Hydraulic and Pneumatic), By Component (Pumps, Motors, Valves, Cylinder, Steel Tube and Compression Fitting, Accumulators, and Accessories), By Application (Construction, Automotive, Oil & Gas, Food Processing, Packaging, Semiconductor, and Others) And By Region (North America, Europe, Asia-Pacific, And Rest Of The World) โ€“ Global Industry Size, Share, Growth, Trends and Forecast To 2030


ID: MRFR/E&P/6463-HCR | 111 Pages | Author: Anshula Mandaokar| April 2024

Market Segmentation


Fluid Power Equipment Type Outlook (USD Million, 2018-2030)


  • Hydraulic


  • Pneumatic


Fluid Power Equipment Component Outlook (USD Million, 2018-2030)


  • Pumps


  • Motors


  • Valves


  • Cylinder


  • Steel Tube and Compression Fitting


  • Accumulators and Accessories


Fluid Power Equipment Application Outlook (USD Million, 2018-2030)


  • Construction


  • Automotive


  • Oil & Gas


  • Food Processing


  • Packaging


  • Semiconductor


  • Others


Fluid Power Equipment Regional Outlook (USD Million, 2018-2030)


  • North America Outlook (USD Million, 2018-2030)


    • North America Fluid Power Equipment by Type


      • Hydraulic


      • Pneumatic


    • North America Fluid Power Equipment by Component


      • Pumps


      • Motors


      • Valves


      • Cylinder


      • Steel Tube and Compression Fitting


      • Accumulators and Accessories


    • North America Fluid Power Equipment by Application


      • Construction


      • Automotive


      • Oil & Gas


      • Food Processing


      • Packaging


      • Semiconductor


      • Others


    • US Outlook (USD Million, 2018-2030)


    • US Fluid Power Equipment by Type


      • Hydraulic


      • Pneumatic


    • US Fluid Power Equipment by Component


      • Pumps


      • Motors


      • Valves


      • Cylinder


      • Steel Tube and Compression Fitting


      • Accumulators and Accessories


    • US Fluid Power Equipment by Application


      • Construction


      • Automotive


      • Oil & Gas


      • Food Processing


      • Packaging


      • Semiconductor


      • Others


    • CANADA Outlook (USD Million, 2018-2030)


    • CANADA Fluid Power Equipment by Type


      • Hydraulic


      • Pneumatic


    • CANADA Fluid Power Equipment by Component


      • Pumps


      • Motors


      • Valves


      • Cylinder


      • Steel Tube and Compression Fitting


      • Accumulators and Accessories


    • CANADA Fluid Power Equipment by Application


      • Construction


      • Automotive


      • Oil & Gas


      • Food Processing


      • Packaging


      • Semiconductor


      • Others


  • Europe Outlook (USD Million, 2018-2030)


    • Europe Fluid Power Equipment by Type


      • Hydraulic


      • Pneumatic


    • Europe Fluid Power Equipment by Component


      • Pumps


      • Motors


      • Valves


      • Cylinder


      • Steel Tube and Compression Fitting


      • Accumulators and Accessories


    • Europe Fluid Power Equipment by Application


      • Construction


      • Automotive


      • Oil & Gas


      • Food Processing


      • Packaging


      • Semiconductor


      • Others


    • Germany Outlook (USD Million, 2018-2030)


    • Germany Fluid Power Equipment by Type


      • Hydraulic


      • Pneumatic


    • Germany Fluid Power Equipment by Component


      • Pumps


      • Motors


      • Valves


      • Cylinder


      • Steel Tube and Compression Fitting


      • Accumulators and Accessories


    • Germany Fluid Power Equipment by Application


      • Construction


      • Automotive


      • Oil & Gas


      • Food Processing


      • Packaging


      • Semiconductor


      • Others


    • France Outlook (USD Million, 2018-2030)


    • France Fluid Power Equipment by Type


      • Hydraulic


      • Pneumatic


    • France Fluid Power Equipment by Component


      • Pumps


      • Motors


      • Valves


      • Cylinder


      • Steel Tube and Compression Fitting


      • Accumulators and Accessories


    • France Fluid Power Equipment by Application


      • Construction


      • Automotive


      • Oil & Gas


      • Food Processing


      • Packaging


      • Semiconductor


      • Others


    • UK Outlook (USD Million, 2018-2030)


    • UK Fluid Power Equipment by Type


      • Hydraulic


      • Pneumatic


    • UK Fluid Power Equipment by Component


      • Pumps


      • Motors


      • Valves


      • Cylinder


      • Steel Tube and Compression Fitting


      • Accumulators and Accessories


    • UK Fluid Power Equipment by Application


      • Construction


      • Automotive


      • Oil & Gas


      • Food Processing


      • Packaging


      • Semiconductor


      • Others


    • ITALY Outlook (USD Million, 2018-2030)


    • ITALY Fluid Power Equipment by Type


      • Hydraulic


      • Pneumatic


    • ITALY Fluid Power Equipment by Component


      • Pumps


      • Motors


      • Valves


      • Cylinder


      • Steel Tube and Compression Fitting


      • Accumulators and Accessories


    • ITALY Fluid Power Equipment by Application


      • Construction


      • Automotive


      • Oil & Gas


      • Food Processing


      • Packaging


      • Semiconductor


      • Others


    • SPAIN Outlook (USD Million, 2018-2030)


    • Spain Fluid Power Equipment by Type


      • Hydraulic


      • Pneumatic


    • Spain Fluid Power Equipment by Component


      • Pumps


      • Motors


      • Valves


      • Cylinder


      • Steel Tube and Compression Fitting


      • Accumulators and Accessories


    • Spain Fluid Power Equipment by Application


      • Construction


      • Automotive


      • Oil & Gas


      • Food Processing


      • Packaging


      • Semiconductor


      • Others


    • Rest Of Europe Outlook (USD Million, 2018-2030)


    • Rest Of Europe Fluid Power Equipment by Type


      • Hydraulic


      • Pneumatic


    • REST OF EUROPE Fluid Power Equipment by Component


      • Pumps


      • Motors


      • Valves


      • Cylinder


      • Steel Tube and Compression Fitting


      • Accumulators and Accessories


    • REST OF EUROPE Fluid Power Equipment by Application


      • Construction


      • Automotive


      • Oil & Gas


      • Food Processing


      • Packaging


      • Semiconductor


      • Others


  • Asia-Pacific Outlook (USD Million, 2018-2030)


    • Asia-Pacific Fluid Power Equipment by Type


      • Hydraulic


      • Pneumatic


    • Asia-Pacific Fluid Power Equipment by Component


      • Pumps


      • Motors


      • Valves


      • Cylinder


      • Steel Tube and Compression Fitting


      • Accumulators and Accessories


    • Asia-Pacific Fluid Power Equipment by Application


      • Construction


      • Automotive


      • Oil & Gas


      • Food Processing


      • Packaging


      • Semiconductor


      • Others


    • China Outlook (USD Million, 2018-2030)


    • China Fluid Power Equipment by Type


      • Hydraulic


      • Pneumatic


    • China Fluid Power Equipment by Component


      • Pumps


      • Motors


      • Valves


      • Cylinder


      • Steel Tube and Compression Fitting


      • Accumulators and Accessories


    • China Fluid Power Equipment by Application


      • Construction


      • Automotive


      • Oil & Gas


      • Food Processing


      • Packaging


      • Semiconductor


      • Others


    • Japan Outlook (USD Million, 2018-2030)


    • Japan Fluid Power Equipment by Type


      • Hydraulic


      • Pneumatic


    • Japan Fluid Power Equipment by Component


      • Pumps


      • Motors


      • Valves


      • Cylinder


      • Steel Tube and Compression Fitting


      • Accumulators and Accessories


    • Japan Fluid Power Equipment by Application


      • Construction


      • Automotive


      • Oil & Gas


      • Food Processing


      • Packaging


      • Semiconductor


      • Others


    • India Outlook (USD Million, 2018-2030)


    • India Fluid Power Equipment by Type


      • Hydraulic


      • Pneumatic


    • India Fluid Power Equipment by Component


      • Pumps


      • Motors


      • Valves


      • Cylinder


      • Steel Tube and Compression Fitting


      • Accumulators and Accessories


    • India Fluid Power Equipment by Application


      • Construction


      • Automotive


      • Oil & Gas


      • Food Processing


      • Packaging


      • Semiconductor


      • Others


    • Australia Outlook (USD Million, 2018-2030)


    • Australia Fluid Power Equipment by Type


      • Hydraulic


      • Pneumatic


    • Australia Fluid Power Equipment by Component


      • Pumps


      • Motors


      • Valves


      • Cylinder


      • Steel Tube and Compression Fitting


      • Accumulators and Accessories


    • Australia Fluid Power Equipment by Application


      • Construction


      • Automotive


      • Oil & Gas


      • Food Processing


      • Packaging


      • Semiconductor


      • Others


    • Rest of Asia-Pacific Outlook (USD Million, 2018-2030)


    • Rest of Asia-Pacific Fluid Power Equipment by Type


      • Hydraulic


      • Pneumatic


    • Rest of Asia-Pacific Fluid Power Equipment by Component


      • Pumps


      • Motors


      • Valves


      • Cylinder


      • Steel Tube and Compression Fitting


      • Accumulators and Accessories


    • Rest of Asia-Pacific Fluid Power Equipment by Application


      • Construction


      • Automotive


      • Oil & Gas


      • Food Processing


      • Packaging


      • Semiconductor


      • Others


  • Rest of the World Outlook (USD Million, 2018-2030)


    • Rest of the World Fluid Power Equipment by Type


      • Hydraulic


      • Pneumatic


    • Rest of the World Fluid Power Equipment by Component


      • Pumps


      • Motors


      • Valves


      • Cylinder


      • Steel Tube and Compression Fitting


      • Accumulators and Accessories


    • Rest of the World Fluid Power Equipment by Application


      • Construction


      • Automotive


      • Oil & Gas


      • Food Processing


      • Packaging


      • Semiconductor


      • Others


    • Middle East Outlook (USD Million, 2018-2030)


    • Middle East Fluid Power Equipment by Type


      • Hydraulic


      • Pneumatic


    • Middle East Fluid Power Equipment by Component


      • Pumps


      • Motors


      • Valves


      • Cylinder


      • Steel Tube and Compression Fitting


      • Accumulators and Accessories


    • Middle East Fluid Power Equipment by Application


      • Construction


      • Automotive


      • Oil & Gas


      • Food Processing


      • Packaging


      • Semiconductor


      • Others


    • Africa Outlook (USD Million, 2018-2030)


    • Africa Fluid Power Equipment by Type


      • Hydraulic


      • Pneumatic


    • Africa Fluid Power Equipment by Component


      • Pumps


      • Motors


      • Valves


      • Cylinder


      • Steel Tube and Compression Fitting


      • Accumulators and Accessories


    • Africa Fluid Power Equipment by Application


      • Construction


      • Automotive


      • Oil & Gas


      • Food Processing


      • Packaging


      • Semiconductor


      • Others


    • Latin America Outlook (USD Million, 2018-2030)


    • Latin America Fluid Power Equipment by Type


      • Hydraulic


      • Pneumatic


    • Latin America Fluid Power Equipment by Component


      • Pumps


      • Motors


      • Valves


      • Cylinder


      • Steel Tube and Compression Fitting


      • Accumulators and Accessories


    • Latin America Fluid Power Equipment by Application


      • Construction


      • Automotive


      • Oil & Gas


      • Food Processing


      • Packaging


      • Semiconductor


      • Others


Research Methodology on Fluid Power Equipment Market


The research methodology used to conduct the research study of the global Fluid Power Equipment Market, published by Market Research Future (MRFR), includes a combination of primary and secondary research structures. The insights into the market are based on both primary and secondary data sources. Primary data sources comprise experts in the industry from both supply and demand sides, and secondary data sources include company websites, databases, directories, white papers, magazines, books, and industry-specific journals. The secondary data sources help researchers and analysts to gain an overall view of the industry and its underlying dynamics. This industry-specific data is also further scrutinized and validated through qualitative and quantitative analysis to accomplish better insights.


Market sizing and structure


To assess the size of the current market and the growth in the future, different surveys are conducted of the key players in the fluid power equipment industry. The data is collected through primary interviews, secondary sources, and published reports and guides. The surveys are executed in a structured manner to gain accurate information on different factors driving the market. Both quantitative and qualitative information is collected to estimate the market size. The study includes the analysis of all important market segments, along with a macro and microeconomic outlook.


Geographical analysis


The geographical analysis covers the analysis of key geographic markets, such as North America, Europe, Asia Pacific, the Middle East and Africa and South America. The analysis examined different aspects of the market, such as historical trends, present conditions, and future prospects. The analysis also covered market segmentation as per the end-use industries and the major end-users.


Competitive landscape


The competitive landscape is studied in detail in the report to understand the strategies adopted by leading players in the global fluid power equipment market. The analytical assessment of the market included key players such as Eaton, Parker Hannifin Corp., and Tectra Automation, among others.


Research objectives


The research objectives are developed to understand the key areas to be studied in terms of market sizing, geography, and market structure. The objectives include studying historical trends, present growth opportunities, and future prospects. Moreover, the analysis also looked at the regional market and segmentation.


Data triangulation


To verify the data collected and to extract the true potential of the market, data triangulation is carried out. This process includes collecting data from both primary and secondary sources and analyzing it from a different angle to gain an in-depth understanding of the market.


Research validity


The research published by MRFR is rigorously validated by industry experts and market analysts for validity and reliability. The research is validated through various methods, such as stakeholder analysis, primary interviews with industry veterans, and surveys among various industry experts. The market estimations are further cross-checked with several industry veterans to ensure accuracy. All data and information are further tested to ensure accuracy.

Leading companies partner with us for data-driven Insights
client_1 client_2 client_3 client_4 client_5 client_6 client_7 client_8 client_9 client_10
Please fill in Business Email for Quick Response

Table of Contents

1. Executive Summary

2. Market Introduction

2.1. Market Definition

2.2. Scope of the Study

2.3. Market Structure

3. Research Methodology

3.1. Primary Research

3.2. Secondary Research

3.3. Market Size Estimation

3.4. Forecast Model

3.5. List of Assumptions

3.6. Limitations of the Study

4. Market Insights

5. Market Dynamics

5.1. Introduction

5.2. Market Drivers

5.3. Market Restraints

5.4. Market Opportunities

5.5. Value Chain/Supply Chain Analysis

5.6. Porterโ€™s Five Forces Analysis

5.6.1. Threat of New Entrants

5.6.2. Bargaining Power of Buyers

5.6.3. Bargaining Power of Suppliers

5.6.4. Threat of Substitutes

5.6.5. Competitive Rivalry

6. Global Fluid Power Equipment Market, by Type

6.1. Introduction

6.2. Hydraulic

6.2.1. Market Estimates & Forecast, 2022-2030

6.2.2. Market Estimates & Forecast, by Region/Country, 2022-2030

6.2.3. by Application

6.2.3.1. Industrial

6.2.3.1.1. Market Estimates & Forecast, 2022-2030

6.2.3.1.2. Market Estimates & Forecast, by Region/Country, 2022-2030

6.2.3.2. Mobile

6.2.3.2.1. Market Estimates & Forecast, 2022-2030

6.2.3.2.2. Market Estimates & Forecast, by Region/Country, 2022-2030

6.3. Pneumatic

6.3.1. Market Estimates & Forecast, 2022-2030

6.3.2. Market Estimates & Forecast, by Region/Country, 2022-2030

7. Global Fluid Power Equipment Market, by Component

7.1. Introduction

7.2. Pumps

7.2.1. Market Estimates & Forecast, 2022-2030

7.2.2. Market Estimates & Forecast, by Region/Country, 2022-2030

7.3. Motors

7.3.1. Market Estimates & Forecast, 2022-2030

7.3.2. Market Estimates & Forecast, by Region/Country, 2022-2030

7.4. Valves

7.4.1. Market Estimates & Forecast, 2022-2030

7.4.2. Market Estimates & Forecast, by Region/Country, 2022-2030

7.5. Cylinder

7.5.1. Market Estimates & Forecast, 2022-2030

7.5.2. Market Estimates & Forecast, by Region/Country, 2022-2030

7.6. Steel Tube and Compression Fitting

7.6.1. Market Estimates & Forecast, 2022-2030

7.6.2. Market Estimates & Forecast, by Region/Country, 2022-2030

7.7. Accumulators

7.7.1. Market Estimates & Forecast, 2022-2030

7.7.2. Market Estimates & Forecast, by Region/Country, 2022-2030

7.8. Accessories

7.8.1. Market Estimates & Forecast, 2022-2030

7.8.2. Market Estimates & Forecast, by Region/Country, 2022-2030

8. Global Fluid Power Equipment Market, by Application

8.1. Introduction

8.2. Construction

8.2.1. Market Estimates & Forecast, 2022-2030

8.2.2. Market Estimates & Forecast, by Region/Country, 2022-2030

8.3. Automotive

8.3.1. Market Estimates & Forecast, 2022-2030

8.3.2. Market Estimates & Forecast, by Region/Country, 2022-2030

8.4. Oil & Gas

8.4.1. Market Estimates & Forecast, 2022-2030

8.4.2. Market Estimates & Forecast, by Region/Country, 2022-2030

8.5. Food Processing

8.5.1. Market Estimates & Forecast, 2022-2030

8.5.2. Market Estimates & Forecast, by Region/Country, 2022-2030

8.6. Packaging

8.6.1. Market Estimates & Forecast, 2022-2030

8.6.2. Market Estimates & Forecast, by Region/Country, 2022-2030

8.7. Semiconductor

8.7.1. Market Estimates & Forecast, 2022-2030

8.7.2. Market Estimates & Forecast, by Region/Country, 2022-2030

8.8. Others

8.8.1. Market Estimates & Forecast, 2022-2030

8.8.2. Market Estimates & Forecast, by Region/Country, 2022-2030

9. Global Fluid Power Equipment Market, by Region

9.1. Introduction

9.2. North America

9.2.1. Market Estimates & Forecast, by Country, 2022-2030

9.2.2. Market Estimates & Forecast, by Type, 2022-2030

9.2.3. Market Estimates & Forecast, by Component, 2022-2030

9.2.4. Market Estimates & Forecast, by Application, 2022-2030

9.2.5. US

9.2.5.1. Market Estimates & Forecast, by Type, 2022-2030

9.2.5.2. Market Estimates & Forecast, by Component, 2022-2030

9.2.5.3. Market Estimates & Forecast, by Application, 2022-2030

9.2.6. Canada

9.2.6.1. Market Estimates & Forecast, by Type, 2022-2030

9.2.6.2. Market Estimates & Forecast, by Component, 2022-2030

9.2.6.3. Market Estimates & Forecast, by Application, 2022-2030

9.2.7. Mexico

9.2.7.1. Market Estimates & Forecast, by Type, 2022-2030

9.2.7.2. Market Estimates & Forecast, by Component, 2022-2030

9.2.7.3. Market Estimates & Forecast, by Application, 2022-2030

9.3. Europe

9.3.1. Market Estimates & Forecast, by Region, 2022-2030

9.3.2. Market Estimates & Forecast, by Type, 2022-2030

9.3.3. Market Estimates & Forecast, by Component, 2022-2030

9.3.4. Market Estimates & Forecast, by Application, 2022-2030

9.3.5. UK

9.3.5.1. Market Estimates & Forecast, by Type, 2022-2030

9.3.5.2. Market Estimates & Forecast, by Component, 2022-2030

9.3.5.3. Market Estimates & Forecast, by Application, 2022-2030

9.3.6. France

9.3.6.1. Market Estimates & Forecast, by Type, 2022-2030

9.3.6.2. Market Estimates & Forecast, by Component, 2022-2030

9.3.6.3. Market Estimates & Forecast, by Application, 2022-2030

9.3.7. Germany

9.3.7.1. Market Estimates & Forecast, by Type, 2022-2030

9.3.7.2. Market Estimates & Forecast, by Component, 2022-2030

9.3.7.3. Market Estimates & Forecast, by Application, 2022-2030

9.3.8. Italy

9.3.8.1. Market Estimates & Forecast, by Type, 2022-2030

9.3.8.2. Market Estimates & Forecast, by Component, 2022-2030

9.3.8.3. Market Estimates & Forecast, by Application, 2022-2030

9.3.9. Rest of Europe

9.3.9.1. Market Estimates & Forecast, by Type, 2022-2030

9.3.9.2. Market Estimates & Forecast, by Component, 2022-2030

9.3.9.3. Market Estimates & Forecast, by Application, 2022-2030

9.4. Asia-Pacific

9.4.1. Market Estimates & Forecast, by Country, 2022-2030

9.4.2. Market Estimates & Forecast, by Type, 2022-2030

9.4.3. Market Estimates & Forecast, by Component, 2022-2030

9.4.4. Market Estimates & Forecast, by Application, 2022-2030

9.4.5. China

9.4.5.1. Market Estimates & Forecast, by Type, 2022-2030

9.4.5.2. Market Estimates & Forecast, by Component, 2022-2030

9.4.5.3. Market Estimates & Forecast, by Application, 2022-2030

9.4.6. Japan

9.4.6.1. Market Estimates & Forecast, by Type, 2022-2030

9.4.6.2. Market Estimates & Forecast, by Component, 2022-2030

9.4.6.3. Market Estimates & Forecast, by Application, 2022-2030

9.4.7. India

9.4.7.1. Market Estimates & Forecast, by Type, 2022-2030

9.4.7.2. Market Estimates & Forecast, by Component, 2022-2030

9.4.7.3. Market Estimates & Forecast, by Application, 2022-2030

9.4.8. South Korea

9.4.8.1. Market Estimates & Forecast, by Type, 2022-2030

9.4.8.2. Market Estimates & Forecast, by Component, 2022-2030

9.4.8.3. Market Estimates & Forecast, by Application, 2022-2030

9.4.9. Rest of Asia-Pacific

9.4.9.1. Market Estimates & Forecast, by Type, 2022-2030

9.4.9.2. Market Estimates & Forecast, by Component, 2022-2030

9.4.9.3. Market Estimates & Forecast, by Application, 2022-2030

9.5. Middle East & Africa

9.5.1. Market Estimates & Forecast, by Country, 2022-2030

9.5.2. Market Estimates & Forecast, by Type, 2022-2030

9.5.3. Market Estimates & Forecast, by Component, 2022-2030

9.5.4. Market Estimates & Forecast, by Application, 2022-2030

9.5.5. Saudi Arabia

9.5.5.1. Market Estimates & Forecast, by Type, 2022-2030

9.5.5.2. Market Estimates & Forecast, by Component, 2022-2030

9.5.5.3. Market Estimates & Forecast, by Application, 2022-2030

9.5.6. UAE

9.5.6.1. Market Estimates & Forecast, by Type, 2022-2030

9.5.6.2. Market Estimates & Forecast, by Component, 2022-2030

9.5.6.3. Market Estimates & Forecast, by Application, 2022-2030

9.5.7. South Africa

9.5.7.1. Market Estimates & Forecast, by Type, 2022-2030

9.5.7.2. Market Estimates & Forecast, by Application, 2022-2030

9.5.8. Rest of Middle East & Africa

9.5.8.1. Market Estimates & Forecast, by Type, 2022-2030

9.5.8.2. Market Estimates & Forecast, by Component, 2022-2030

9.5.8.3. Market Estimates & Forecast, by Application, 2022-2030

9.6. South America

9.6.1. Market Estimates & Forecast, by Region, 2022-2030

9.6.2. Market Estimates & Forecast, by Type, 2022-2030

9.6.3. Market Estimates & Forecast, by Component, 2022-2030

9.6.4. Market Estimates & Forecast, by Application, 2022-2030

9.6.5. Brazil

9.6.5.1. Market Estimates & Forecast, by Type, 2022-2030

9.6.5.2. Market Estimates & Forecast, by Component, 2022-2030

9.6.5.3. Market Estimates & Forecast, by Application, 2022-2030

9.6.6. Argentina

9.6.6.1. Market Estimates & Forecast, by Type, 2022-2030

9.6.6.2. Market Estimates & Forecast, by Component, 2022-2030

9.6.6.3. Market Estimates & Forecast, by Application, 2022-2030

9.6.7. Rest of South America

9.6.7.1. Market Estimates & Forecast, by Type, 2022-2030

9.6.7.2. Market Estimates & Forecast, by Component, 2022-2030

9.6.7.3. Market Estimates & Forecast, by Application, 2022-2030

10. Competitive Landscape

10.1. Competitive Scenario

10.2. Competitive Benchmarking of the Global Fluid Power Equipment Market

10.3. Major Growth Key Strategies in the Global Fluid Power Equipment Market

10.4. Market Share Analysis, 2020

10.5. Bosch Rexroth: The Leading Player in Terms of Number of Developments in Global Fluid Power Equipment Market

10.6. Product Development

10.7. Mergers and Acquisitions

10.8. Contracts and Agreements

10.9. Expansions and Investments

11. Company Profile

11.1. Bosch Rexroth (Germany)

11.1.1. Company Overview

11.1.2. Products/Services Offered

11.1.3. Financial Overview

11.1.4. Key Developments

11.1.5. Key Strategies

11.1.6. SWOT Analysis

11.2. Eaton (Ireland)

11.2.1. Company Overview

11.2.2. Products/Services Offered

11.2.3. Financial Overview

11.2.4. Key Developments

11.2.5. Key Strategies

11.2.6. SWOT Analysis

11.3. Parker Hannifin (US)

11.3.1. Company Overview

11.3.2. Products/Services Offered

11.3.3. Financial Overview

11.3.4. Key Developments

11.3.5. Key Strategies

11.3.6. SWOT Analysis

11.4. Kawasaki (Japan)

11.4.1. Company Overview

11.4.2. Products/Services Offered

11.4.3. Financial Overview

11.4.4. Key Developments

11.4.5. Key Strategies

11.4.6. SWOT Analysis

11.5. Fluid-Power Equipment, Inc. (US)

11.5.1. Company Overview

11.5.2. Products/Services Offered

11.5.3. Financial Overview

11.5.4. Key Developments

11.5.5. Key Strategies

11.5.6. SWOT Analysis

11.6. Sparrows Group (UK)

11.6.1. Company Overview

11.6.2. Products/Services Offered

11.6.3. Financial Overview

11.6.4. Key Developments

11.6.5. Key Strategies

11.6.6. SWOT Analysis

11.7. Fluid Systems, Inc. (US)

11.7.1. Company Overview

11.7.2. Products/Services Offered

11.7.3. Financial Overview

11.7.4. Key Developments

11.7.5. Key Strategies

11.7.6. SWOT Analysis

11.8. Hawe (Germany)

11.8.1. Company Overview

11.8.2. Products/Services Offered

11.8.3. Financial Overview

11.8.4. Key Developments

11.8.5. Key Strategies

11.8.6. SWOT Analysis

11.9. Hydac (Germany)

11.9.1. Company Overview

11.9.2. Products/Services Offered

11.9.3. Financial Overview

11.9.4. Key Developments

11.9.5. Key Strategies

11.9.6. SWOT Analysis

11.10. Moog (US)

11.10.1. Company Overview

11.10.2. Products/Services Offered

11.10.3. Financial Overview

11.10.4. Key Developments

11.10.5. Key Strategies

11.10.6. SWOT Analysis

11.11. Bucher Hydraulics (Germany)

11.11.1. Company Overview

11.11.2. Products/Services Offered

11.11.3. Financial Overview

11.11.4. Key Developments

11.11.5. Key Strategies

11.11.6. SWOT Analysis

11.12. Daikin (Japan)

11.12.1. Company Overview

11.12.2. Products/Services Offered

11.12.3. Financial Overview

11.12.4. Key Developments

11.12.5. Key Strategies

11.12.6. SWOT Analysis

11.13. Concentric (Sweden)

11.13.1. Company Overview

11.13.2. Products/Services Offered

11.13.3. Financial Overview

11.13.4. Key Developments

11.13.5. Key Strategies

11.13.6. SWOT Analysis

11.14. Casappa (Italy)

11.14.1. Company Overview

11.14.2. Products/Services Offered

11.14.3. Financial Overview

11.14.4. Key Developments

11.14.5. Key Strategies

11.14.6. SWOT Analysis

11.14.7. Related Fluid Power Ltd (UK)

11.14.8. Company Overview

11.14.9. Products/Services Offered

11.14.10. Financial Overview

11.14.11. Key Developments

11.14.12. Key Strategies

11.14.13. SWOT Analysis

11.15. Kent Fluid Power Ltd (US)

11.15.1. Company Overview

11.15.2. Products/Services Offered

11.15.3. Financial Overview

11.15.4. Key Developments

11.15.5. Key Strategies

11.15.6. SWOT Analysis

12. Appendix

12.1. References

12.2. Related Reports

12.3. List of Abbreviations

List of Tables

Table 1 List of Assumptions

Table 2 Global Fluid Power Equipment Market, by Type, 2022-2030, (USD Million)

Table 3 Global Fluid Power Equipment Market, by Component, 2022-2030, (USD Million)

Table 4 Global Fluid Power Equipment Market, by Application, 2022-2030, (USD Million)

Table 5 Global Fluid Power Equipment Market, by Region, 2022-2030, (USD Million)

Table 6 North America: Fluid Power Equipment Market, by Country, 2022-2030, (USD Million)

Table 7 North America: Fluid Power Equipment Market, by Type, 2022-2030, (USD Million)

Table 8 North America: Fluid Power Equipment Market, by Component, 2022-2030, (USD Million)

Table 9 North America: Fluid Power Equipment Market, by Application, 2022-2030, (USD Million)

Table 10 US: Fluid Power Equipment Market, by Type, 2022-2030, (USD Million)

Table 11 US: Fluid Power Equipment Market, by Component, 2022-2030, (USD Million)

Table 12 US: Fluid Power Equipment Market, by Application, 2022-2030, (USD Million)

Table 13 Canada: Fluid Power Equipment Market, by Type, 2022-2030, (USD Million)

Table 14 Canada: Fluid Power Equipment Market, by Component, 2022-2030, (USD Million)

Table 15 Canada: Fluid Power Equipment Market, by Application, 2022-2030, (USD Million)

Table 16 Mexico: Fluid Power Equipment Market, by Type, 2022-2030, (USD Million)

Table 17 Mexico: Fluid Power Equipment Market, by Component, 2022-2030, (USD Million)

Table 18 Mexico: Fluid Power Equipment Market, by Application, 2022-2030, (USD Million)

Table 19 Europe: Fluid Power Equipment Market, by Country, 2022-2030, (USD Million)

Table 20 Europe: Fluid Power Equipment Market, by Type, 2022-2030, (USD Million)

Table 21 Europe: Fluid Power Equipment Market, by Component, 2022-2030, (USD Million)

Table 22 Europe: Fluid Power Equipment Market, by Application, 2022-2030, (USD Million)

Table 23 UK: Fluid Power Equipment Market, by Type, 2022-2030, (USD Million)

Table 24 UK: Fluid Power Equipment Market, by Component, 2022-2030, (USD Million)

Table 25 UK: Fluid Power Equipment Market, by Application, 2022-2030, (USD Million)

Table 26 France: Fluid Power Equipment Market, by Type, 2022-2030, (USD Million)

Table 27 France: Fluid Power Equipment Market, by Component, 2022-2030, (USD Million)

Table 28 France: Fluid Power Equipment Market, by Application, 2022-2030, (USD Million)

Table 29 Italy: Fluid Power Equipment Market, by Type, 2022-2030, (USD Million)

Table 30 Italy: Fluid Power Equipment Market, by Component, 2022-2030, (USD Million)

Table 31 Italy: Fluid Power Equipment Market, by Application, 2022-2030, (USD Million)

Table 32 Germany: Fluid Power Equipment Market, by Type, 2022-2030, (USD Million)

Table 33 Germany: Fluid Power Equipment Market, by Component, 2022-2030, (USD Million)

Table 34 Germany: Fluid Power Equipment Market, by Application, 2022-2030, (USD Million)

Table 35 Rest of Europe: Fluid Power Equipment Market, by Type, 2022-2030, (USD Million)

Table 36 Rest of Europe: Fluid Power Equipment Market, by Component, 2022-2030, (USD Million)

Table 37 Rest of Europe: Fluid Power Equipment Market, by Application, 2022-2030, (USD Million)

Table 38 Asia-Pacific: Fluid Power Equipment Market, by Country, 2022-2030, (USD Million)

Table 39 Asia-Pacific: Fluid Power Equipment Market, by Type, 2022-2030, (USD Million)

Table 40 Asia-Pacific: Fluid Power Equipment Market, by Application, 2022-2030, (USD Million)

Table 41 China: Fluid Power Equipment Market, by Type, 2022-2030, (USD Million)

Table 42 China: Fluid Power Equipment Market, by Component, 2022-2030, (USD Million)

Table 43 China: Fluid Power Equipment Market, by Application, 2022-2030, (USD Million)

Table 44 India: Fluid Power Equipment Market, by Type, 2022-2030, (USD Million)

Table 45 India: Fluid Power Equipment Market, by Component, 2022-2030, (USD Million)

Table 46 India: Fluid Power Equipment Market, by Application, 2022-2030, (USD Million)

Table 47 Japan: Fluid Power Equipment Market, by Type, 2022-2030, (USD Million)

Table 48 Japan: Fluid Power Equipment Market, by Component, 2022-2030, (USD Million)

Table 49 Japan: Fluid Power Equipment Market, by Application, 2022-2030, (USD Million)

Table 50 South Korea: Fluid Power Equipment Market, by Type, 2022-2030, (USD Million)

Table 51 South Korea: Fluid Power Equipment Market, by Component, 2022-2030, (USD Million)

Table 52 South Korea: Fluid Power Equipment Market, by Application, 2022-2030, (USD Million)

Table 53 Rest of Asia-Pacific: Fluid Power Equipment Market, by Type, 2022-2030, (USD Million)

Table 54 Rest of Asia-Pacific: Fluid Power Equipment Market, by Component, 2022-2030, (USD Million)

Table 55 Rest of Asia-Pacific: Fluid Power Equipment Market, by Application, 2022-2030, (USD Million)

Table 56 Middle East & Africa: Fluid Power Equipment Market, by Country, 2022-2030, (USD Million)

Table 57 Middle East & Africa: Fluid Power Equipment Market, by Type, 2022-2030, (USD Million)

Table 58 Middle East & Africa: Fluid Power Equipment Market, by Application, 2022-2030, (USD Million)

Table 59 Saudi Arabia: Fluid Power Equipment Market, by Type, 2022-2030, (USD Million)

Table 60 Saudi Arabia: Fluid Power Equipment Market, by Component, 2022-2030, (USD Million)

Table 61 Saudi Arabia: Fluid Power Equipment Market, by Application, 2022-2030, (USD Million)

Table 62 UAE: Fluid Power Equipment Market, by Type, 2022-2030, (USD Million)

Table 63 UAE: Fluid Power Equipment Market, by Component, 2022-2030, (USD Million)

Table 64 UAE: Fluid Power Equipment Market, by Application, 2022-2030, (USD Million)

Table 65 South Africa: Fluid Power Equipment Market, by Type, 2022-2030, (USD Million)

Table 66 South Africa: Fluid Power Equipment Market, by Component, 2022-2030, (USD Million)

Table 67 South Africa: Fluid Power Equipment Market, by Application, 2022-2030, (USD Million)

Table 68 Rest of the Middle East & Africa: Fluid Power Equipment Market, by Type, 2022-2030, (USD Million)

Table 69 Rest of the Middle East & Africa: Fluid Power Equipment Market, by Component, 2022-2030, (USD Million)

Table 70 Rest of the Middle East & Africa: Fluid Power Equipment Market, by Application, 2022-2030, (USD Million)

Table 71 South America: Fluid Power Equipment Market, by Country, 2022-2030, (USD Million)

Table 72 South America: Fluid Power Equipment Market, by Type, 2022-2030, (USD Million)

Table 73 South America: Fluid Power Equipment Market, by Application, 2022-2030, (USD Million)

Table 74 Brazil: Fluid Power Equipment Market, by Type, 2022-2030, (USD Million)

Table 75 Brazil: Fluid Power Equipment Market, by Component, 2022-2030, (USD Million)

Table 76 Brazil: Fluid Power Equipment Market, by Application, 2022-2030, (USD Million)

Table 77 Argentina: Fluid Power Equipment Market, by Type, 2022-2030, (USD Million)

Table 78 Argentina: Fluid Power Equipment Market, by Component, 2022-2030, (USD Million)

Table 79 Argentina: Fluid Power Equipment Market, by Application, 2022-2030, (USD Million)

Table 80 Rest of South America: Fluid Power Equipment Market, by Type, 2022-2030, (USD Million)

Table 81 Rest of South America: Fluid Power Equipment Market, by Component, 2022-2030, (USD Million)

Table 82 Rest of South America: Fluid Power Equipment Market, by Application, 2022-2030, (USD Million)

Table 83 Player 1: The Most Active Player in the Fluid Power Equipment Market

Table 84 Company 1: Product Offered

Table 85 Company 1: Key Developments

List of Figures

Figure 1 Research Process of MRFR

Figure 2 Top-Down and Bottom-Up Approach

Figure 3 Market Dynamics

Figure 4 Impact Analysis: Market Drivers

Figure 5 Impact Analysis: Market Restraints

Figure 6 Porter's Five Forces Analysis

Figure 7 Value Chain Analysis

Figure 8 Global Fluid Power Equipment Market Share, by Type, 2020 (%)

Figure 9 Global Fluid Power Equipment Market, by Type, 2022-2030 (USD Million)

Figure 8 Global Fluid Power Equipment Market Share, by Component, 2020 (%)

Figure 9 Global Fluid Power Equipment Market, by Component, 2022-2030 (USD Million)

Figure 10 Global Fluid Power Equipment Market Share, by Application, 2020 (%)

Figure 11 Global Fluid Power Equipment Market, by Application, 2022-2030 (USD Million)

Figure 12 Global Fluid Power Equipment Market Share (%), by Region, 2020

Figure 13 Global Fluid Power Equipment Market, by Region, 2022-2030 (USD Million)

Figure 14 North America: Fluid Power Equipment Market Share (%), 2020

Figure 15 North America: Fluid Power Equipment Market, by Country, 2022-2030 (USD Million)

Figure 16 Europe Fluid Power Equipment Market Share (%), 2020

Figure 17 Europe Fluid Power Equipment Market, by Country, 2022-2030 (USD Million)

Figure 18 Asia-Pacific Fluid Power Equipment Market Share (%), 2020

Figure 19 Asia-Pacific Fluid Power Equipment Market, by Country, 2022-2030 (USD Million)

Figure 20 Middle East & Africa Fluid Power Equipment Market Share (%), 2020

Figure 21 Middle East & Africa Fluid Power Equipment Market, by Country, 2022-2030 (USD Million)

Figure 22 South America Fluid Power Equipment Market Share (%), 2020

Figure 23 South America Fluid Power Equipment Market, by Country, 2022-2030 (USD Million)

Figure 24 Market Share Analysis, 2020

Figure 25 Company 1: Total Revenue (2020-2022)

Figure 26 Company 1: SWOT Analysis

Purchase Option
Single User $ 4,950
Multiuser License $ 5,950
Enterprise User $ 7,250
Compare Licenses
Tailored for You
  • Dedicated Research on any specifics segment or region.
  • Focused Research on specific players in the market.
  • Custom Report based only on your requirements.
  • Flexibility to add or subtract any chapter in the study.
  • Historic data from 2014 and forecasts outlook till 2040.
  • Flexibility of providing data/insights in formats (PDF, PPT, Excel).
  • Provide cross segmentation in applicable scenario/markets.