• Cat-intel
  • MedIntelliX
  • Resources
  • About Us
  • Hero Background
    English
    Chinese
    French
    Japanese
    Korean
    German
    Spanish

    Flavoured Butter Market Trends

    ID: MRFR/F-B & N/12489-HCR
    128 Pages
    Snehal Singh
    October 2025

    Flavoured Butter Market Research Report Information By Nature (Organic and Conventional), Product Type (Salted and Unsalted), Format (Spreadable and Non-Spreadable), Form (Powder, Liquid and Paste), Applications (Milk & Dairy Products, Bakery Products, Value Added Food and Beverages, Dips & Sauces and Blends & Seasonings), Distribution Channel (Store-Based Retailing and Online Retai...

    Share:
    Download PDF ×

    We do not share your information with anyone. However, we may send you emails based on your report interest from time to time. You may contact us at any time to opt-out.

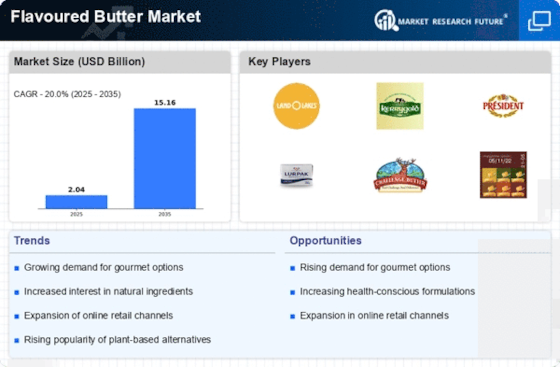
    Flavoured Butter Market Infographic
    $ 4,950.0
    $ 5,950.0
    $ 7,250.0

    Market Trends

    Key Emerging Trends in the Flavoured Butter Market

    The flavored butter market has been experiencing a surge in popularity in recent years, driven by shifting consumer preferences towards gourmet and artisanal food products. Flavored butter, also known as compound butter, is made by combining butter with various herbs, spices, and other ingredients to create unique and flavorful spreads. This market trend is fueled by consumers' desire for convenient yet high-quality ingredients to elevate their cooking and dining experiences. One notable trend in the flavored butter market is the diversification of flavor profiles and ingredients. While traditional options like garlic herb and honey butter remain popular, manufacturers are introducing innovative flavors such as truffle, sriracha, maple bacon, and herb-infused varieties like rosemary thyme and basil pesto. These creative flavor combinations appeal to consumers seeking new and exciting culinary experiences, whether used as spreads, toppings, or ingredients in cooking and baking. Moreover, the flavored butter market has seen a rise in demand for premium and artisanal products, driven by consumer preferences for quality ingredients and authentic flavors. Artisanal butter producers often prioritize small-batch production, high-quality ingredients, and traditional techniques, resulting in products with superior taste and texture. This trend aligns with the broader movement towards artisanal and handcrafted foods, as consumers seek to support local producers and artisans while indulging in gourmet experiences. Additionally, premium flavored butter products are often positioned as indulgent treats or special occasion items, appealing to consumers willing to pay a premium for superior quality and taste. Another significant trend shaping the flavored butter market is the growing interest in health-conscious and plant-based options. As consumers become more mindful of their dietary choices, there is a demand for flavored butter products made with natural, organic, and non-GMO ingredients. Additionally, there is a rising interest in plant-based butter alternatives made from oils such as coconut, avocado, and olive, catering to vegan, dairy-free, and lactose-intolerant consumers. These plant-based options offer a healthier alternative to traditional dairy butter while still providing rich flavor and versatility in cooking and baking applications. Furthermore, the flavored butter market has witnessed increased innovation and product development, driven by consumer demand for convenience and versatility. Manufacturers are introducing flavored butter in various formats, including spreadable tubs, individually portioned sticks, and flavored butter blends in squeeze bottles or jars. These convenient packaging options cater to different usage occasions and cooking preferences, allowing consumers to easily incorporate flavored butter into their meals with minimal preparation or mess. Additionally, flavored butter blends are marketed as versatile ingredients that can be used for cooking, grilling, sautéing, or simply spreading on bread or toast, enhancing the flavor of a wide range of dishes.

    Market Summary

    As per Market Research Future Analysis, the Global Flavoured Butter Market was valued at USD 2.04 Billion in 2024 and is projected to reach USD 15.16 Billion by 2035, growing at a CAGR of 20.00% from 2025 to 2035. The market is driven by rising health consciousness, culinary trends, and effective marketing strategies. The organic segment leads in revenue, while the conventional segment is expected to grow at the highest CAGR. Salted flavored butter dominates the product type, with unsalted expected to grow rapidly. The spreadable format holds the largest market share, while non-spreadable is anticipated to grow fastest. North America is the leading region, followed by Europe, with Asia-Pacific expected to grow at the fastest rate.

    Key Market Trends & Highlights

    The Flavoured Butter Market is witnessing significant growth driven by health trends and product innovation.

    • Market Size in 2024: USD 2.04 Billion
    • Projected Market Size by 2035: USD 15.16 Billion
    • CAGR from 2025 to 2035: 20.00%
    • Organic segment accounts for over half of market revenue

    Market Size & Forecast

    2024 Market Size USD 2.04 Billion
    2035 Market Size USD 15.16 Billion
    CAGR (2025-2035) 20.00%
    Largest Regional Market Share in 2024 North America

    Major Players

    Key players include Nestlé, The J.M. Smucker Company, Unilever, Butter Buds Inc., Arla Foods amba, and Dairy Farmers of America, Inc.

    Market Trends

    Rising Health and Wellness Consciousness is driving market growth

    The Flavored Butter market is experiencing a surge in demand, buoyed by the prevailing wave of health and wellness consciousness among consumers. As individuals increasingly prioritize wholesome and natural food choices, flavored butter has emerged as a sought-after option that aligns with these evolving dietary preferences. Health-conscious consumers are drawn to flavored butter products that offer not only a burst of enticing flavors but also the promise of high-quality and nutritious ingredients.

    In response to the demand for healthier alternatives, manufacturers are incorporating premium ingredients, such as organic herbs and spices, into flavored butter formulations. The perception of flavored butter as a more natural option compared to some processed spreads has fueled its popularity among those seeking a balance between indulgence and nutritional mindfulness. Furthermore, the market has witnessed the introduction of specialty and functional variants, such as probiotic-infused or omega-3 enriched flavored butters, appealing to consumers looking to integrate health benefits into their daily culinary choices.

    The rising awareness of the impact of diet on overall well-being has positioned flavored butter as a versatile and flavorful companion for health-conscious consumers, contributing significantly to the market's continued growth. As consumers increasingly view food as a key component of their wellness regimen, flavored butter stands out as a flavorful yet health-conscious choice in the evolving landscape of dietary preferences.

    The Global Flavoured Butter Market appears to be experiencing a notable shift towards premium and artisanal products, reflecting consumers' increasing preference for unique and high-quality culinary experiences.

    U.S. Department of Agriculture

    Flavoured Butter Market Market Drivers

    Market Growth Projections

    The Global Flavoured Butter Market Industry is poised for substantial growth, with projections indicating a market value of 2500 USD Million in 2024 and a potential increase to 5000 USD Million by 2035. This growth trajectory suggests a compound annual growth rate of 6.5% from 2025 to 2035. Such figures reflect the increasing consumer interest in diverse flavours and high-quality butter products, as well as the industry's ability to adapt to changing market dynamics. The anticipated growth underscores the potential for new entrants and established brands to capitalize on emerging trends and consumer preferences.

    Expansion of Retail Channels

    The Global Flavoured Butter Market Industry benefits from the expansion of retail channels, including supermarkets, specialty stores, and online platforms. The increasing availability of flavoured butter products in various retail formats enhances consumer access and convenience. Supermarkets are increasingly dedicating shelf space to gourmet and flavoured options, catering to the evolving preferences of shoppers. Additionally, the rise of e-commerce allows consumers to explore a wider range of products from the comfort of their homes. This accessibility is expected to contribute to market growth, with projections indicating that the industry could reach 5000 USD Million by 2035, reflecting the positive impact of retail expansion.

    Innovative Product Development

    Innovation in product development is a key driver for the Global Flavoured Butter Market Industry. Manufacturers are continuously exploring new flavour profiles and formulations to attract consumers. This includes the introduction of seasonal and limited-edition flavours that create excitement and encourage trial purchases. Additionally, the incorporation of functional ingredients, such as probiotics or plant-based options, caters to diverse consumer preferences and dietary needs. As the market evolves, the emphasis on innovation is likely to foster competition among brands, leading to a broader array of choices for consumers. This dynamic environment may further stimulate market growth and engagement.

    Rising Demand for Gourmet Products

    The Global Flavoured Butter Market Industry experiences a notable increase in demand for gourmet and artisanal food products. Consumers are increasingly seeking unique and high-quality culinary experiences, which drives the popularity of flavoured butter. This trend is particularly evident in upscale restaurants and gourmet food stores, where flavoured butter is used to enhance dishes. The market is projected to reach 2500 USD Million in 2024, reflecting a growing consumer preference for premium ingredients. As more individuals explore cooking at home, the demand for gourmet products is likely to continue, potentially leading to a compound annual growth rate of 6.5% from 2025 to 2035.

    Culinary Trends and Social Media Influence

    Culinary trends, often amplified by social media platforms, play a crucial role in shaping consumer preferences within the Global Flavoured Butter Market Industry. Influencers and food bloggers frequently showcase innovative recipes featuring flavoured butter, inspiring home cooks to experiment with diverse flavors. This exposure not only increases awareness but also drives demand for unique and exotic flavour combinations. As consumers become more adventurous in their cooking, the market is likely to see a rise in sales. The potential for growth is substantial, as the industry adapts to these trends and introduces new products that resonate with a digitally engaged audience.

    Health Consciousness and Natural Ingredients

    There is a growing awareness among consumers regarding health and nutrition, influencing their purchasing decisions in the Global Flavoured Butter Market Industry. Many consumers are opting for products made with natural ingredients and fewer additives. This shift towards healthier options has prompted manufacturers to innovate and create flavoured butters that are organic or contain beneficial ingredients such as herbs and spices. As a result, the market is likely to expand, catering to health-conscious consumers who seek flavorful alternatives without compromising their dietary preferences. This trend aligns with the broader movement towards clean eating and could significantly impact market growth.

    Market Segment Insights

    Flavoured Butter Market Product Type Insights

    The Flavoured Butter Market segmentation, based on product type includes salted and unsalted. The salted segment dominated the market, accounting for more than a quarter of market revenue. Salted flavored butter is characterized by its savory and slightly tangy taste, making it a preferred choice for consumers seeking a more robust and flavorful option. The addition of salt enhances the versatility of this product, making it suitable for both sweet and savory dishes.           

    The unsalted segment anticipated to grow at a fastest CAGR during the forecast period. Unsalted flavored butter provides a neutral base, allowing consumers to customize the level of salt in their dishes according to personal taste preferences and dietary restrictions. Bakers often prefer unsalted flavored butter as it allows them precise control over the salt content in recipes, especially in delicate and sweet baked goods. Health-conscious consumers who are mindful of their sodium intake often opt for unsalted flavored butter to have better control over the overall salt content in their diet.

    Flavoured Butter Market Format Insights

    The Flavoured Butter Market segmentation, based on format includes spreadable and non-Spreadable. The Spreadable segment dominated the market, accounting for more than a quarter of market revenue. Spreadable flavored butter is designed for easy spreading on various food items, such as bread, crackers, or other baked goods. Its smooth consistency makes it convenient for use as a spread. It is versatile and can be used as a condiment, a topping, or an ingredient in cooking. Its spreadable nature enhances its applicability in both sweet and savory culinary creations.             

    The Non-Spreadable segment anticipated to grow at a fastest CAGR during the forecast period. Non-spreadable flavored butter is formulated for cooking and baking purposes. Its thicker consistency makes it suitable for melting, sautéing, or incorporating into recipes where a more solid form is desired. It is chosen for its ability to impart concentrated and nuanced flavors to cooked dishes. It is often used for finishing touches in recipes to enhance the overall taste. Some non-spreadable flavored butters are positioned as specialty or gourmet products, appealing to consumers looking for premium options with distinctive flavors.

    Flavoured Butter Market Form Insights

    The Flavoured Butter Market segmentation, based on form includes Powder, Liquid and Paste. Powdered flavored butter offers advantages in terms of storage and transportation efficiency. It has a longer shelf life and is often more convenient for handling and logistics. It is versatile and can be used in various culinary applications, such as seasoning, flavoring, or as a component in dry mixes for convenience foods.

    The Powder segment anticipated to grow at a fastest CAGR during the forecast period. Liquid flavored butter is well-suited for drizzling over dishes or for use in cooking, providing a convenient and ready-to-use format. It often feature infused flavors such as herbs, spices, or other aromatic ingredients, offering a convenient way to enhance the taste of various dishes. Liquid flavored butter is versatile and can be used as a finishing touch, marinade, or ingredient in both sweet and savory dishes.

    Flavoured Butter Market Application Insights

    The Flavoured Butter Market segmentation, based on application includes milk & dairy products, bakery products, value added food and beverages, dips & sauces and blends & seasonings. The milk and dairy products segment dominated the market, accounting for more than a quarter of market revenue. Flavored butter is used to enhance the taste of milk and various dairy products. It may be incorporated into products such as yogurt, cheese, and ice cream to add unique and complementary flavors.            

    The value added food and beverages segment anticipated to grow at a fastest CAGR during the forecast period. Flavored butter contributes to value-added food products by providing a convenient and flavorful ingredient for ready-to-eat meals, snacks, and convenience foods. Its premium positioning enhances the perceived value of food and beverage products, appealing to consumers seeking elevated taste experiences.

    Flavoured Butter Market Distribution Channel Insights

    The Flavoured Butter Market segmentation, based on distribution channel includes store-based retailing and online retailing. The store-based retailing segment dominated the market, accounting for more than a quarter of market revenue .This is due to flavored butter is prominently featured in supermarkets and hypermarkets, where consumers can explore a wide range of options and brands.

    The online retailing segment anticipated to grow at a fastest CAGR during the forecast period. This is due to the rise of online shopping has made flavored butter readily available on various e-commerce platforms. Consumers can browse and purchase products from the comfort of their homes, benefiting from a vast selection.

    Source: Secondary Research, Primary Research, Market Research Future Database and Analyst Review

    Get more detailed insights about Flavoured Butter Market Research Report — Global Forecast till 2032

    Regional Insights

    By region, the study provides market insights into North America, Europe, Asia-Pacific, and Rest of the World. The North American Flavoured Butter Market area will dominate this market. This is driven by the North American consumers are known for their diverse culinary preferences and openness to trying new and innovative food products. Flavored butter, with its variety of tastes and applications, aligns well with this trend.

    Further, the major countries studied in the market report are The US, Canada, Germany, France, the UK, Italy, Spain, China, Japan, India, Australia, South Korea, and Brazil.

    Figure 2: FLAVOURED BUTTER MARKET SHARE BY REGION 2022 (USD Billion)

    FLAVOURED BUTTER MARKET SHARE BY REGION 2022

    Source: Secondary Research, Primary Research, Market Research Future Database and Analyst Review

    Europe Flavoured Butter Market accounts for the second-largest market share. This is due to the Europe is known for its rich culinary traditions and diverse food cultures. The demand for flavored butter in Europe is influenced by the wide range of tastes and preferences across countries, regions, and local cuisines.

    The Asia-Pacific Flavoured Butter Market is expected to grow at the fastest CAGR from 2023 to 2032. This is driven by the The Asia-Pacific region is known for its diverse culinary cultures, which include a wide array of flavors and ingredients. This diversity creates opportunities for flavored butter manufacturers to cater to specific taste preferences in different countries. Moreover, China’s Flavoured Butter Market held the largest market share, and the Indian Flavoured Butter Market was the fastest growing market in the Asia-Pacific region.

    Key Players and Competitive Insights

    Leading market players invest heavily in research and development to advance and innovate Flavoured Butter Market technologies and techniques. Market participants are also undertaking various strategic activities to expand their global footprint, with important market developments including new product launches, clinical integration, customer support and service contracts, contractual agreements, mergers and acquisitions, higher investments, and collaboration with other organizations. To expand and survive in a more competitive and rising market climate, the Flavoured Butter Market industry must offer customized solutions.

    Companies are forming partnerships with academic and research institutions to gain access to their expertise and share resources for joint research projects in the Flavoured Butter Market industry to develop novel applications and technologies. In recent years, the Flavoured Butter Market industry has offered some of the most significant advantages to consumers. Major players in the Flavoured Butter Market, including Nestlé, The J.M. Smucker Company., Unilever, Butter Buds Inc., Mainland, Arla Foods amba, Dairy Farmers of America, Inc., GCMMF, Ornua Co-operative Limited, Kerry, DAIRYCHEM, International Flavors & Fragrances Inc., Tatua, H.B.

    Taylor Co., The Edlong Corporation., abelei inc., Beck Flavors Inc., Biospringer, JENEIL, Blue Pacific Flavors, Inc., Flavor Solutions Inc., Comax MFG Corp. & CORMAN, and others, are attempting to increase market demand by investing in product development to increase their product line and cater to diverse consumer needs.

    Nestlé, founded is a Swiss multinational food and beverage company headquartered in Vevey, Switzerland. As one of the largest food companies globally, Nestlé operates in various segments, including beverages, dairy, health science, skin health, and infant nutrition. The company is renowned for its extensive product portfolio, featuring well-known brands such as Nescafé, Nestea, Nestle Purina, and KitKat. Nestlé's commitment to nutrition, health, and wellness is reflected in its continuous innovation and emphasis on sustainable practices. In October 2023, Kellogg launched a new line-up of flavored milks.

    The all-new NESTLÉ Sensations Frosted Flakes Cereal Flavored Milk and NESTLÉ Sensations Eggo Maple Waffle Flavored Milk are the breakfast and beverage.

    Butter Buds Inc. is a Wisconsin-based company specializing in the development and production of concentrated dairy flavors and flavor ingredients. The company has established itself as a leading innovator in the food industry, particularly in the creation of butter-flavored products. It utilizes advanced technology to produce concentrated butter flavor solutions that offer the rich taste of butter without the full fat content. These products find applications in various food and beverage sectors, including dairy, bakery, sauces, and snacks.

    In December 2023, Butter Buds Inc. launched Non-Dairy 32X, an ingredient solution proposing food formulators the same texture and taste of butter but without the dairy allergen. It provide medium-strong salted butter middle notes as Butter Buds 32X with same butter flavor and is ideal for a various foods.

    Key Companies in the Flavoured Butter Market market include

    Industry Developments

    June 2023:  Kerrygold launched a new savory range of flavored butters, Kerrygold Butter Blends, for tasty snacking or the impeccable finish to dish.

    July 2022: Danish Creamery launched two new European Style butter products, specialty salt sticks and spreadable with extra virgin oils, to expand its portfolio. It is launched in 2 flavors Extra Virgin Olive Oil and Extra Virgin Avocado Oil.

    July 2022: Challenge Butter launched new spreads make a variety of favorite sweet and savory flavor profiles, Challenge Butter Snack Spreads. It is ranging from Chocolate and Salted Caramel to Everything and Buffalo.

    Future Outlook

    Flavoured Butter Market Future Outlook

    The Global Flavoured Butter Market is projected to grow at a 20.00% CAGR from 2025 to 2035, driven by rising consumer demand for gourmet and health-conscious products.

    New opportunities lie in:

    • Develop plant-based flavoured butter alternatives to cater to vegan consumers.
    • Leverage e-commerce platforms for direct-to-consumer sales and personalized marketing.
    • Introduce limited-edition seasonal flavours to stimulate consumer interest and drive sales.

    By 2035, the Flavoured Butter Market is expected to exhibit robust growth, reflecting evolving consumer preferences and innovative product offerings.

    Market Segmentation

    Flavoured Butter Market Form Outlook

    • Powder
    • Liquid
    • Paste

    Flavoured Butter Market Format Outlook

    • Spreadable
    • Non-Spreadable

    Flavoured Butter Market Nature Outlook

    • Organic
    • Conventional

    Flavoured Butter Market Regional Outlook

    • US
    • Canada

    Flavoured Butter Market Application Outlook

    • Milk and Dairy Products
    • Bakery Products
    • Value Added Food and Beverages
    • Dips & Sauces
    • Blends & Seasonings

    Flavoured Butter Market Product Type Outlook

    • Salted
    • Unsalted

    Flavoured Butter Market Distribution Channel Outlook

    • Store-Based Retailing
    • Online Retailing

    Report Scope

    Report Attribute/Metric Details
    Market Size 2024 USD 2.04 Billion
    Market Size 2035 15.16 (Value (USD Billion))
    Compound Annual Growth Rate (CAGR) 20.00% (2025 - 2035)
    Base Year 2024
    Market Forecast Period 2025 - 2035
    Historical Data 2018- 2022
    Market Forecast Units Value (USD Billion)
    Report Coverage Revenue Forecast, Market Competitive Landscape, Growth Factors, and Trends
    Segments Covered Types, Application, and Region
    Geographies Covered North America, Europe, Asia Pacific, and the Rest of the World
    Countries Covered The US, Canada, Germany, France, UK, Italy, Spain, China, Japan, India, Australia, South Korea, and Brazil
    Key Companies Profiled Nestlé, The J.M. Smucker Company., Unilever, Butter Buds Inc., Mainland, Arla Foods amba, Dairy Farmers of America, Inc., GCMMF, Ornua Co-operative Limited, Kerry, DAIRYCHEM, International Flavors & Fragrances Inc., Tatua, H.B. Taylor Co., The Edlong Corporation., abelei inc., Beck Flavors Inc., Biospringer, JENEIL, Blue Pacific Flavors, Inc., Flavor Solutions Inc., and Comax MFG Corp. & CORMAN.
    Key Market Opportunities  Evolving consumer tastes and preferences for unique and gourmet flavors contribute significantly to the increasing demand for flavored butter.
    Key Market Dynamics Flavored butter, with its versatility and ability to complement various dishes, aligns with these trends, making it a popular choice in modern kitchens.
    Market Size 2025 2.45 (Value (USD Billion))

    Market Highlights

    Author

    Snehal Singh
    Assistant Manager - Research

    She holds an experience of about 6+ years in market research and business consulting, working under the spectrum of information communication technology, telecommunications and semiconductor domains. aarti conceptualizes and implements a scalable business strategy and provides strategic leadership to the clients. her expertise lies in market estimation, competitive intelligence, pipeline analysis, customer assessment, etc.

    Leave a Comment

    Latest Comments

    John Doe
    john@example.com

    This is a great article! Really helped me understand the topic better.

    Posted on July 23, 2025, 10:15 AM
    Jane Smith
    jane@domain.com

    Thanks for sharing this. I’ve bookmarked it for later reference.

    Posted on July 22, 2025, 7:45 PM

    FAQs

    How much is the Flavoured Butter Market?

    The Flavoured Butter Market size was valued at USD 1.7 Billion in 2023.

    What is the growth rate of the Flavoured Butter Market?

    The global market is projected to grow at a CAGR of 20.00% during the forecast period, 2024-2032.

    Which region held the largest market share in the Flavoured Butter Market?

    North America had the largest share of the global market

    Who are the key players in the Flavoured Butter Market?

    The key players in the market are Nestlé, The J.M. Smucker Company., Unilever, Butter Buds Inc., Mainland, Arla Foods amba, Dairy Farmers of America, Inc., GCMMF, Ornua Co-operative Limited, Kerry, DAIRYCHEM, International Flavors & Fragrances Inc., Tatua, H.B. Taylor Co., The Edlong Corporation., abelei inc., Beck Flavors Inc., Biospringer, JENEIL, Blue Pacific Flavors, Inc., Flavor Solutions Inc., and Comax MFG Corp. & CORMAN.

    Which product type led the Flavoured Butter Market?

    The salted product type dominated the market in 2023.

    Which application had the largest market share in the Flavoured Butter Market?

    Milk and Dairy Products had the largest share in the global market.

    1. Table of Contents
    2. Executive Summary
    3. Market Introduction
      1. Definition
      2. Scope of the Study
        1. Research Objective
        2. Assumptions
        3. Limitations
    4. Research Methodology
      1. Overview
      2. Data Mining
      3. Secondary Research
      4. Primary Research
        1. Primary Interviews and Information Gathering Process
        2. Breakdown of Primary Respondents
      5. Forecasting Model
      6. Market Size Estimation
        1. Bottom-up Approach
        2. Top-Down Approach
      7. Data Triangulation
      8. Validation
    5. MARKET DYNAMICS
      1. Overview
      2. Drivers
      3. Restraints
      4. Opportunities
    6. MARKET FACTOR ANALYSIS
      1. Value Chain Analysis
      2. Porter’s Five Forces Analysis
        1. Bargaining Power of Suppliers
        2. Bargaining Power of Buyers
        3. Threat of New Entrants
        4. Threat of Substitutes
        5. Intensity of Rivalry
      3. COVID-19 Impact Analysis
        1. Market Impact Analysis
        2. Regional Impact
        3. Opportunity and Threat Analysis
    7. GLOBAL FLAVOURED BUTTER MARKET, BY NATURE
      1. Overview
      2. Organic
      3. Conventional
    8. GLOBAL FLAVOURED BUTTER MARKET, BY PRODUCT TYPE
      1. Overview
      2. Salted
      3. Unsalted
    9. GLOBAL FLAVOURED BUTTER MARKET, BY FORMAT
      1. Overview
      2. Spreadable
      3. Non-Spreadable
    10. GLOBAL FLAVOURED BUTTER MARKET, BY FORM
      1. Overview
      2. Powder
      3. Liquid
      4. Paste
    11. GLOBAL FLAVOURED BUTTER MARKET, BY APPLICATION
      1. Overview
      2. Milk and Dairy Products
      3. Bakery Products
      4. Value Added Food and Beverages
      5. Dips & Sauces
      6. Blends & Seasonings
    12. GLOBAL FLAVOURED BUTTER MARKET, BY DISTRIBUTION CHANNEL
      1. Overview
      2. Store-Based Retailing
      3. Online Retailing
    13. GLOBAL FLAVOURED BUTTER MARKET, BY REGION
      1. Overview
      2. North America
        1. US
        2. Canada
      3. Europe
        1. Germany
        2. France
        3. UK
        4. Italy
        5. Spain
        6. Rest of Europe
      4. Asia-Pacific
        1. China
        2. India
        3. Japan
        4. South Korea
        5. Australia
        6. Rest of Asia-Pacific
      5. Rest of the World
        1. Middle East
        2. Africa
        3. Latin America
    14. Competitive Landscape
      1. Overview
      2. Competitive Analysis
      3. Market Share Analysis
      4. Major Growth Strategy in the Global Flavoured Butter Market,
      5. Competitive Benchmarking
      6. Leading Players in Terms of Number of Developments in the Global Flavoured Butter Market,
      7. Key developments and Growth Strategies
        1. New Product Launch/Service Deployment
        2. Merger & Acquisitions
        3. Joint Ventures
      8. Major Players Financial Matrix
        1. Sales & Operating Income, 2022
        2. Major Players R&D Expenditure. 2022
    15. COMPANY PROFILES
      1. Nestlé
        1. Company Overview
        2. Financial Overview
        3. Products Offered
        4. Key Developments
        5. SWOT Analysis
        6. Key Strategies
      2. The J.M. Smucker Company.
        1. Company Overview
        2. Financial Overview
        3. Products Offered
        4. Key Developments
        5. SWOT Analysis
        6. Key Strategies
      3. Unilever
        1. Company Overview
        2. Financial Overview
        3. Products Offered
        4. Key Developments
        5. SWOT Analysis
        6. Key Strategies
      4. Butter Buds Inc.
        1. Company Overview
        2. Financial Overview
        3. Products Offered
        4. Key Developments
        5. SWOT Analysis
        6. Key Strategies
      5. Mainland
        1. Company Overview
        2. Financial Overview
        3. Products Offered
        4. Key Developments
        5. SWOT Analysis
        6. Key Strategies
      6. Arla Foods amba
        1. Company Overview
        2. Financial Overview
        3. Products Offered
        4. Key Developments
        5. SWOT Analysis
        6. Key Strategies
      7. Dairy Farmers of America, Inc.
        1. Company Overview
        2. Financial Overview
        3. Products Offered
        4. Key Developments
        5. SWOT Analysis
        6. Key Strategies
      8. GCMMF
        1. Company Overview
        2. Financial Overview
        3. Products Offered
        4. Key Developments
        5. SWOT Analysis
        6. Key Strategies
      9. Ornua Co-operative Limited
        1. Company Overview
        2. Financial Overview
        3. Products Offered
        4. Key Developments
        5. SWOT Analysis
        6. Key Strategies
      10. Kerry, DAIRYCHEM
        1. Company Overview
        2. Financial Overview
        3. Products Offered
        4. Key Developments
        5. SWOT Analysis
        6. Key Strategies
      11. International Flavors & Fragrances Inc.
        1. Company Overview
        2. Financial Overview
        3. Products Offered
        4. Key Developments
        5. SWOT Analysis
        6. Key Strategies
      12. Tatua
        1. Company Overview
        2. Financial Overview
        3. Products Offered
        4. Key Developments
        5. SWOT Analysis
        6. Key Strategies
      13. H.B. Taylor Co.
        1. Company Overview
        2. Financial Overview
        3. Products Offered
        4. Key Developments
        5. SWOT Analysis
        6. Key Strategies
      14. The Edlong Corporation.
        1. Company Overview
        2. Financial Overview
        3. Products Offered
        4. Key Developments
        5. SWOT Analysis
        6. Key Strategies
      15. Abelei Inc.
        1. Company Overview
        2. Financial Overview
        3. Products Offered
        4. Key Developments
        5. SWOT Analysis
        6. Key Strategies
      16. Beck Flavors Inc.
        1. Company Overview
        2. Financial Overview
        3. Products Offered
        4. Key Developments
        5. SWOT Analysis
        6. Key Strategies
      17. Biospringer
        1. Company Overview
        2. Financial Overview
        3. Products Offered
        4. Key Developments
        5. SWOT Analysis
        6. Key Strategies
      18. JENEIL
        1. Company Overview
        2. Financial Overview
        3. Products Offered
        4. Key Developments
        5. SWOT Analysis
        6. Key Strategies
      19. Blue Pacific Flavors, Inc.
        1. Company Overview
        2. Financial Overview
        3. Products Offered
        4. Key Developments
        5. SWOT Analysis
        6. Key Strategies
      20. Flavor Solutions Inc.
        1. Company Overview
        2. Financial Overview
        3. Products Offered
        4. Key Developments
        5. SWOT Analysis
        6. Key Strategies
      21. Comax MFG Corp. & CORMAN
        1. Company Overview
        2. Financial Overview
        3. Products Offered
        4. Key Developments
        5. SWOT Analysis
        6. Key Strategies
    16. APPENDIX
      1. References
      2. Related Reports
    17. List of Tables and Figures
      1. LIST OF TABLES
      2. TABLE 1 GLOBAL FLAVOURED BUTTER MARKET, SYNOPSIS, 2024-2032
      3. TABLE 2 GLOBAL FLAVOURED BUTTER MARKET, ESTIMATES & FORECAST, 2024-2032 (USD BILLION)
      4. TABLE 3 GLOBAL FLAVOURED BUTTER MARKET, BY NATURE, 2024-2032 (USD BILLION)
      5. TABLE 4 GLOBAL FLAVOURED BUTTER MARKET, BY PRODUCT TYPE, 2024-2032 (USD BILLION)
      6. TABLE 5 GLOBAL FLAVOURED BUTTER MARKET, BY FORMAT, 2024-2032 (USD BILLION)
      7. TABLE 6 GLOBAL FLAVOURED BUTTER MARKET, BY FORM, 2024-2032 (USD BILLION)
      8. TABLE 7 GLOBAL FLAVOURED BUTTER MARKET, BY APPLICATION, 2024-2032 (USD BILLION)
      9. TABLE 8 GLOBAL FLAVOURED BUTTER MARKET, BY DISTRIBUTION CHANNEL, 2024-2032 (USD BILLION)
      10. TABLE 9 NORTH AMERICA: FLAVOURED BUTTER MARKET, BY NATURE, 2024-2032 (USD BILLION)
      11. TABLE 10 NORTH AMERICA: FLAVOURED BUTTER MARKET, BY PRODUCT TYPE, 2024-2032 (USD BILLION)
      12. TABLE 11 NORTH AMERICA: FLAVOURED BUTTER MARKET, BY FORMAT, 2024-2032 (USD BILLION)
      13. TABLE 12 NORTH AMERICA: FLAVOURED BUTTER MARKET, BY FORM, 2024-2032 (USD BILLION)
      14. TABLE 13 NORTH AMERICA: FLAVOURED BUTTER MARKET, BY APPLICATION, 2024-2032 (USD BILLION)
      15. TABLE 14 NORTH AMERICA: FLAVOURED BUTTER MARKET, BY DISTRIBUTION CHANNEL, 2024-2032 (USD BILLION)
      16. TABLE 15 US: FLAVOURED BUTTER MARKET, BY NATURE, 2024-2032 (USD BILLION)
      17. TABLE 16 US: FLAVOURED BUTTER MARKET, BY PRODUCT TYPE, 2024-2032 (USD BILLION)
      18. TABLE 17 US: FLAVOURED BUTTER MARKET, BY FORMAT, 2024-2032 (USD BILLION)
      19. TABLE 18 US: FLAVOURED BUTTER MARKET, BY FORM, 2024-2032 (USD BILLION)
      20. TABLE 19 US: FLAVOURED BUTTER MARKET, BY APPLICATION, 2024-2032 (USD BILLION)
      21. TABLE 20 US: FLAVOURED BUTTER MARKET, BY DISTRIBUTION CHANNEL, 2024-2032 (USD BILLION)
      22. TABLE 21 CANADA: FLAVOURED BUTTER MARKET, BY NATURE, 2024-2032 (USD BILLION)
      23. TABLE 22 CANADA: FLAVOURED BUTTER MARKET, BY PRODUCT TYPE, 2024-2032 (USD BILLION)
      24. TABLE 23 CANADA: FLAVOURED BUTTER MARKET, BY FORMAT, 2024-2032 (USD BILLION)
      25. TABLE 24 CANADA: FLAVOURED BUTTER MARKET, BY FORM, 2024-2032 (USD BILLION)
      26. TABLE 25 CANADA: FLAVOURED BUTTER MARKET, BY APPLICATION, 2024-2032 (USD BILLION)
      27. TABLE 26 CANADA: FLAVOURED BUTTER MARKET, BY DISTRIBUTION CHANNEL, 2024-2032 (USD BILLION)
      28. TABLE 1 EUROPE: FLAVOURED BUTTER MARKET, BY NATURE, 2024-2032 (USD BILLION)
      29. TABLE 2 EUROPE: FLAVOURED BUTTER MARKET, BY PRODUCT TYPE, 2024-2032 (USD BILLION)
      30. TABLE 3 EUROPE: FLAVOURED BUTTER MARKET, BY FORMAT, 2024-2032 (USD BILLION)
      31. TABLE 4 EUROPE: FLAVOURED BUTTER MARKET, BY FORM, 2024-2032 (USD BILLION)
      32. TABLE 5 EUROPE: FLAVOURED BUTTER MARKET, BY APPLICATION, 2024-2032 (USD BILLION)
      33. TABLE 6 EUROPE: FLAVOURED BUTTER MARKET, BY DISTRIBUTION CHANNEL, 2024-2032 (USD BILLION)
      34. TABLE 7 GERMANY: FLAVOURED BUTTER MARKET, BY NATURE, 2024-2032 (USD BILLION)
      35. TABLE 8 GERMANY: FLAVOURED BUTTER MARKET, BY PRODUCT TYPE, 2024-2032 (USD BILLION)
      36. TABLE 9 GERMANY: FLAVOURED BUTTER MARKET, BY FORMAT, 2024-2032 (USD BILLION)
      37. TABLE 10 GERMANY: FLAVOURED BUTTER MARKET, BY FORM, 2024-2032 (USD BILLION)
      38. TABLE 11 GERMANY: FLAVOURED BUTTER MARKET, BY APPLICATION, 2024-2032 (USD BILLION)
      39. TABLE 12 GERMANY: FLAVOURED BUTTER MARKET, BY DISTRIBUTION CHANNEL, 2024-2032 (USD BILLION)
      40. TABLE 13 FRANCE: FLAVOURED BUTTER MARKET, BY NATURE, 2024-2032 (USD BILLION)
      41. TABLE 14 FRANCE: FLAVOURED BUTTER MARKET, BY PRODUCT TYPE, 2024-2032 (USD BILLION)
      42. TABLE 15 FRANCE: FLAVOURED BUTTER MARKET, BY FORMAT, 2024-2032 (USD BILLION)
      43. TABLE 16 FRANCE: FLAVOURED BUTTER MARKET, BY FORM, 2024-2032 (USD BILLION)
      44. TABLE 17 FRANCE: FLAVOURED BUTTER MARKET, BY APPLICATION, 2024-2032 (USD BILLION)
      45. TABLE 18 FRANCE: FLAVOURED BUTTER MARKET, BY DISTRIBUTION CHANNEL, 2024-2032 (USD BILLION)
      46. TABLE 19 ITALY: FLAVOURED BUTTER MARKET, BY NATURE, 2024-2032 (USD BILLION)
      47. TABLE 20 ITALY: FLAVOURED BUTTER MARKET, BY PRODUCT TYPE, 2024-2032 (USD BILLION)
      48. TABLE 21 ITALY: FLAVOURED BUTTER MARKET, BY FORMAT, 2024-2032 (USD BILLION)
      49. TABLE 22 ITALY: FLAVOURED BUTTER MARKET, BY FORM, 2024-2032 (USD BILLION)
      50. TABLE 23 ITALY: FLAVOURED BUTTER MARKET, BY APPLICATION, 2024-2032 (USD BILLION)
      51. TABLE 24 ITALY: FLAVOURED BUTTER MARKET, BY DISTRIBUTION CHANNEL, 2024-2032 (USD BILLION)
      52. TABLE 25 SPAIN: FLAVOURED BUTTER MARKET, BY NATURE, 2024-2032 (USD BILLION)
      53. TABLE 26 SPAIN: FLAVOURED BUTTER MARKET, BY PRODUCT TYPE, 2024-2032 (USD BILLION)
      54. TABLE 27 SPAIN: FLAVOURED BUTTER MARKET, BY FORMAT, 2024-2032 (USD BILLION)
      55. TABLE 28 SPAIN: FLAVOURED BUTTER MARKET, BY FORM, 2024-2032 (USD BILLION)
      56. TABLE 29 SPAIN: FLAVOURED BUTTER MARKET, BY APPLICATION, 2024-2032 (USD BILLION)
      57. TABLE 30 SPAIN: FLAVOURED BUTTER MARKET, BY DISTRIBUTION CHANNEL, 2024-2032 (USD BILLION)
      58. TABLE 31 UK: FLAVOURED BUTTER MARKET, BY NATURE, 2024-2032 (USD BILLION)
      59. TABLE 32 UK: FLAVOURED BUTTER MARKET, BY PRODUCT TYPE, 2024-2032 (USD BILLION)
      60. TABLE 33 UK: FLAVOURED BUTTER MARKET, BY FORMAT, 2024-2032 (USD BILLION)
      61. TABLE 34 UK: FLAVOURED BUTTER MARKET, BY FORM, 2024-2032 (USD BILLION)
      62. TABLE 35 UK: FLAVOURED BUTTER MARKET, BY APPLICATION, 2024-2032 (USD BILLION)
      63. TABLE 36 UK: FLAVOURED BUTTER MARKET, BY DISTRIBUTION CHANNEL, 2024-2032 (USD BILLION)
      64. TABLE 37 REST OF EUROPE: FLAVOURED BUTTER MARKET, BY NATURE, 2024-2032 (USD BILLION)
      65. TABLE 38 REST OF EUROPE: FLAVOURED BUTTER MARKET, BY PRODUCT TYPE, 2024-2032 (USD BILLION)
      66. TABLE 39 REST OF EUROPE: FLAVOURED BUTTER MARKET, BY FORMAT, 2024-2032 (USD BILLION)
      67. TABLE 40 REST OF EUROPE: FLAVOURED BUTTER MARKET, BY FORM, 2024-2032 (USD BILLION)
      68. TABLE 41 REST OF EUROPE: FLAVOURED BUTTER MARKET, BY APPLICATION, 2024-2032 (USD BILLION)
      69. TABLE 42 REST OF EUROPE: FLAVOURED BUTTER MARKET, BY DISTRIBUTION CHANNEL, 2024-2032 (USD BILLION)
      70. TABLE 43 ASIA-PACIFIC: FLAVOURED BUTTER MARKET, BY NATURE, 2024-2032 (USD BILLION)
      71. TABLE 44 ASIA-PACIFIC: FLAVOURED BUTTER MARKET, BY PRODUCT TYPE, 2024-2032 (USD BILLION)
      72. TABLE 45 ASIA-PACIFIC: FLAVOURED BUTTER MARKET, BY FORMAT, 2024-2032 (USD BILLION)
      73. TABLE 46 ASIA-PACIFIC: FLAVOURED BUTTER MARKET, BY FORM, 2024-2032 (USD BILLION)
      74. TABLE 47 ASIA-PACIFIC: FLAVOURED BUTTER MARKET, BY APPLICATION, 2024-2032 (USD BILLION)
      75. TABLE 48 ASIA-PACIFIC: FLAVOURED BUTTER MARKET, BY DISTRIBUTION CHANNEL, 2024-2032 (USD BILLION)
      76. TABLE 49 JAPAN: FLAVOURED BUTTER MARKET, BY NATURE, 2024-2032 (USD BILLION)
      77. TABLE 50 JAPAN: FLAVOURED BUTTER MARKET, BY PRODUCT TYPE, 2024-2032 (USD BILLION)
      78. TABLE 51 JAPAN: FLAVOURED BUTTER MARKET, BY FORMAT, 2024-2032 (USD BILLION)
      79. TABLE 52 JAPAN: FLAVOURED BUTTER MARKET, BY FORM, 2024-2032 (USD BILLION)
      80. TABLE 53 JAPAN: FLAVOURED BUTTER MARKET, BY APPLICATION, 2024-2032 (USD BILLION)
      81. TABLE 54 JAPAN: FLAVOURED BUTTER MARKET, BY DISTRIBUTION CHANNEL, 2024-2032 (USD BILLION)
      82. TABLE 55 CHINA: FLAVOURED BUTTER MARKET, BY NATURE, 2024-2032 (USD BILLION)
      83. TABLE 56 CHINA: FLAVOURED BUTTER MARKET, BY PRODUCT TYPE, 2024-2032 (USD BILLION)
      84. TABLE 57 CHINA: FLAVOURED BUTTER MARKET, BY FORMAT, 2024-2032 (USD BILLION)
      85. TABLE 58 CHINA: FLAVOURED BUTTER MARKET, BY FORM, 2024-2032 (USD BILLION)
      86. TABLE 59 CHINA: FLAVOURED BUTTER MARKET, BY APPLICATION, 2024-2032 (USD BILLION)
      87. TABLE 60 CHINA: FLAVOURED BUTTER MARKET, BY DISTRIBUTION CHANNEL, 2024-2032 (USD BILLION)
      88. TABLE 61 INDIA: FLAVOURED BUTTER MARKET, BY NATURE, 2024-2032 (USD BILLION)
      89. TABLE 62 INDIA: FLAVOURED BUTTER MARKET, BY PRODUCT TYPE, 2024-2032 (USD BILLION)
      90. TABLE 63 INDIA: FLAVOURED BUTTER MARKET, BY FORMAT, 2024-2032 (USD BILLION)
      91. TABLE 64 INDIA: FLAVOURED BUTTER MARKET, BY FORM, 2024-2032 (USD BILLION)
      92. TABLE 65 INDIA: FLAVOURED BUTTER MARKET, BY APPLICATION, 2024-2032 (USD BILLION)
      93. TABLE 66 INDIA: FLAVOURED BUTTER MARKET, BY DISTRIBUTION CHANNEL, 2024-2032 (USD BILLION)
      94. TABLE 67 AUSTRALIA: FLAVOURED BUTTER MARKET, BY NATURE, 2024-2032 (USD BILLION)
      95. TABLE 68 AUSTRALIA: FLAVOURED BUTTER MARKET, BY PRODUCT TYPE, 2024-2032 (USD BILLION)
      96. TABLE 69 AUSTRALIA: FLAVOURED BUTTER MARKET, BY FORMAT, 2024-2032 (USD BILLION)
      97. TABLE 70 AUSTRALIA: FLAVOURED BUTTER MARKET, BY FORM, 2024-2032 (USD BILLION)
      98. TABLE 71 AUSTRALIA: FLAVOURED BUTTER MARKET, BY APPLICATION, 2024-2032 (USD BILLION)
      99. TABLE 72 AUSTRALIA: FLAVOURED BUTTER MARKET, BY DISTRIBUTION CHANNEL, 2024-2032 (USD BILLION)
      100. TABLE 73 SOUTH KOREA: FLAVOURED BUTTER MARKET, BY NATURE, 2024-2032 (USD BILLION)
      101. TABLE 74 SOUTH KOREA: FLAVOURED BUTTER MARKET, BY PRODUCT TYPE, 2024-2032 (USD BILLION)
      102. TABLE 75 SOUTH KOREA: FLAVOURED BUTTER MARKET, BY FORMAT, 2024-2032 (USD BILLION)
      103. TABLE 76 SOUTH KOREA: FLAVOURED BUTTER MARKET, BY FORM, 2024-2032 (USD BILLION)
      104. TABLE 77 SOUTH KOREA: FLAVOURED BUTTER MARKET, BY APPLICATION, 2024-2032 (USD BILLION)
      105. TABLE 78 SOUTH KOREA: FLAVOURED BUTTER MARKET, BY DISTRIBUTION CHANNEL, 2024-2032 (USD BILLION)
      106. TABLE 79 REST OF ASIA-PACIFIC: FLAVOURED BUTTER MARKET, BY NATURE, 2024-2032 (USD BILLION)
      107. TABLE 80 REST OF ASIA-PACIFIC: FLAVOURED BUTTER MARKET, BY PRODUCT TYPE, 2024-2032 (USD BILLION)
      108. TABLE 81 REST OF ASIA-PACIFIC: FLAVOURED BUTTER MARKET, BY FORMAT, 2024-2032 (USD BILLION)
      109. TABLE 82 REST OF ASIA-PACIFIC: FLAVOURED BUTTER MARKET, BY FORM, 2024-2032 (USD BILLION)
      110. TABLE 83 REST OF ASIA-PACIFIC: FLAVOURED BUTTER MARKET, BY APPLICATION, 2024-2032 (USD BILLION)
      111. TABLE 84 REST OF ASIA-PACIFIC: FLAVOURED BUTTER MARKET, BY DISTRIBUTION CHANNEL, 2024-2032 (USD BILLION)
      112. TABLE 85 REST OF THE WORLD: FLAVOURED BUTTER MARKET, BY NATURE, 2024-2032 (USD BILLION)
      113. TABLE 86 REST OF THE WORLD: FLAVOURED BUTTER MARKET, BY PRODUCT TYPE, 2024-2032 (USD BILLION)
      114. TABLE 87 REST OF THE WORLD: FLAVOURED BUTTER MARKET, BY FORMAT, 2024-2032 (USD BILLION)
      115. TABLE 88 REST OF THE WORLD: FLAVOURED BUTTER MARKET, BY FORM, 2024-2032 (USD BILLION)
      116. TABLE 89 REST OF THE WORLD: FLAVOURED BUTTER MARKET, BY APPLICATION, 2024-2032 (USD BILLION)
      117. TABLE 90 REST OF THE WORLD: FLAVOURED BUTTER MARKET, BY DISTRIBUTION CHANNEL, 2024-2032 (USD BILLION)
      118. TABLE 91 MIDDLE EAST: FLAVOURED BUTTER MARKET, BY NATURE, 2024-2032 (USD BILLION)
      119. TABLE 92 MIDDLE EAST: FLAVOURED BUTTER MARKET, BY PRODUCT TYPE, 2024-2032 (USD BILLION)
      120. TABLE 93 MIDDLE EAST: FLAVOURED BUTTER MARKET, BY FORMAT, 2024-2032 (USD BILLION)
      121. TABLE 94 MIDDLE EAST: FLAVOURED BUTTER MARKET, BY FORM, 2024-2032 (USD BILLION)
      122. TABLE 95 MIDDLE EAST: FLAVOURED BUTTER MARKET, BY APPLICATION, 2024-2032 (USD BILLION)
      123. TABLE 96 MIDDLE EAST: FLAVOURED BUTTER MARKET, BY DISTRIBUTION CHANNEL, 2024-2032 (USD BILLION)
      124. TABLE 97 AFRICA: FLAVOURED BUTTER MARKET, BY NATURE, 2024-2032 (USD BILLION)
      125. TABLE 98 AFRICA: FLAVOURED BUTTER MARKET, BY PRODUCT TYPE, 2024-2032 (USD BILLION)
      126. TABLE 99 AFRICA: FLAVOURED BUTTER MARKET, BY FORMAT, 2024-2032 (USD BILLION)
      127. TABLE 100 AFRICA: FLAVOURED BUTTER MARKET, BY FORM, 2024-2032 (USD BILLION)
      128. TABLE 101 AFRICA: FLAVOURED BUTTER MARKET, BY APPLICATION, 2024-2032 (USD BILLION)
      129. TABLE 102 AFRICA: FLAVOURED BUTTER MARKET, BY DISTRIBUTION CHANNEL, 2024-2032 (USD BILLION)
      130. TABLE 103 LATIN AMERICA: FLAVOURED BUTTER MARKET, BY NATURE, 2024-2032 (USD BILLION)
      131. TABLE 104 LATIN AMERICA: FLAVOURED BUTTER MARKET, BY PRODUCT TYPE, 2024-2032 (USD BILLION)
      132. TABLE 105 LATIN AMERICA: FLAVOURED BUTTER MARKET, BY FORMAT, 2024-2032 (USD BILLION)
      133. TABLE 106 LATIN AMERICA: FLAVOURED BUTTER MARKET, BY FORM, 2024-2032 (USD BILLION)
      134. TABLE 107 LATIN AMERICA: FLAVOURED BUTTER MARKET, BY APPLICATION, 2024-2032 (USD BILLION)
      135. TABLE 108 LATIN AMERICA: FLAVOURED BUTTER MARKET, BY DISTRIBUTION CHANNEL, 2024-2032 (USD BILLION) LIST OF FIGURES
      136. FIGURE 1 RESEARCH PROCESS
      137. FIGURE 2 MARKET STRUCTURE FOR THE GLOBAL FLAVOURED BUTTER MARKET
      138. FIGURE 3 MARKET DYNAMICS FOR THE GLOBAL FLAVOURED BUTTER MARKET
      139. FIGURE 4 GLOBAL FLAVOURED BUTTER MARKET, SHARE (%), BY NATURE, 2022
      140. FIGURE 5 GLOBAL FLAVOURED BUTTER MARKET, SHARE (%), BY PRODUCT TYPE, 2022
      141. FIGURE 6 GLOBAL FLAVOURED BUTTER MARKET, SHARE (%), BY FORMAT, 2022
      142. FIGURE 7 GLOBAL FLAVOURED BUTTER MARKET, SHARE (%), BY FORM, 2022
      143. FIGURE 8 GLOBAL FLAVOURED BUTTER MARKET, SHARE (%), BY APPLICATION, 2022
      144. FIGURE 9 GLOBAL FLAVOURED BUTTER MARKET, SHARE (%), BY DISTRIBUTION CHANNEL, 2022
      145. FIGURE 10 GLOBAL FLAVOURED BUTTER MARKET, SHARE (%), BY REGION, 2022
      146. FIGURE 11 NORTH AMERICA: FLAVOURED BUTTER MARKET, SHARE (%), BY REGION, 2022
      147. FIGURE 12 EUROPE: FLAVOURED BUTTER MARKET, SHARE (%), BY REGION, 2022
      148. FIGURE 13 ASIA-PACIFIC: FLAVOURED BUTTER MARKET, SHARE (%), BY REGION, 2022
      149. FIGURE 14 REST OF THE WORLD: FLAVOURED BUTTER MARKET, SHARE (%), BY REGION, 2022
      150. FIGURE 15 GLOBAL FLAVOURED BUTTER MARKET: COMPANY SHARE ANALYSIS, 2022 (%)
      151. FIGURE 16 ABELEI INC.: FINANCIAL OVERVIEW SNAPSHOT
      152. FIGURE 17 ABELEI INC.: SWOT ANALYSIS
      153. FIGURE 18 ARLA FOODS AMBA: FINANCIAL OVERVIEW SNAPSHOT
      154. FIGURE 19 ARLA FOODS AMBA: SWOT ANALYSIS
      155. FIGURE 20 BECK FLAVORS INC.: FINANCIAL OVERVIEW SNAPSHOT
      156. FIGURE 21 BECK FLAVORS INC.: SWOT ANALYSIS
      157. FIGURE 22 BIOSPRINGER: FINANCIAL OVERVIEW SNAPSHOT
      158. FIGURE 23 BIOSPRINGER: SWOT ANALYSIS
      159. FIGURE 24 BLUE PACIFIC FLAVORS, INC.: FINANCIAL OVERVIEW SNAPSHOT
      160. FIGURE 25 BLUE PACIFIC FLAVORS, INC.: SWOT ANALYSIS
      161. FIGURE 26 BUTTER BUDS INC.: FINANCIAL OVERVIEW SNAPSHOT
      162. FIGURE 27 BUTTER BUDS INC.: SWOT ANALYSIS
      163. FIGURE 28 COMAX MFG CORP. & CORMAN: FINANCIAL OVERVIEW SNAPSHOT
      164. FIGURE 29 COMAX MFG CORP. & CORMAN: SWOT ANALYSIS
      165. FIGURE 30 DAIRY FARMERS OF AMERICA, INC.: FINANCIAL OVERVIEW SNAPSHOT
      166. FIGURE 31 DAIRY FARMERS OF AMERICA, INC.: SWOT ANALYSIS
      167. FIGURE 32 FLAVOR SOLUTIONS INC.: FINANCIAL OVERVIEW SNAPSHOT
      168. FIGURE 33 FLAVOR SOLUTIONS INC.: SWOT ANALYSIS
      169. FIGURE 34 GCMMF: FINANCIAL OVERVIEW SNAPSHOT
      170. FIGURE 35 GCMMF: SWOT ANALYSIS
      171. FIGURE 36 H.B. TAYLOR CO.: FINANCIAL OVERVIEW SNAPSHOT
      172. FIGURE 37 H.B. TAYLOR CO.: SWOT ANALYSIS
      173. FIGURE 38 INTERNATIONAL FLAVORS & FRAGRANCES INC.: FINANCIAL OVERVIEW SNAPSHOT
      174. FIGURE 39 INTERNATIONAL FLAVORS & FRAGRANCES INC.: SWOT ANALYSIS
      175. FIGURE 40 JENEIL: FINANCIAL OVERVIEW SNAPSHOT
      176. FIGURE 41 JENEIL: SWOT ANALYSIS
      177. FIGURE 42 KERRY, DAIRYCHEM: FINANCIAL OVERVIEW SNAPSHOT
      178. FIGURE 43 KERRY, DAIRYCHEM: SWOT ANALYSIS
      179. FIGURE 44 MAINLAND: FINANCIAL OVERVIEW SNAPSHOT
      180. FIGURE 45 MAINLAND: SWOT ANALYSIS
      181. FIGURE 46 NESTLE: FINANCIAL OVERVIEW SNAPSHOT
      182. FIGURE 47 NESTLE: SWOT ANALYSIS
      183. FIGURE 48 ORNUA CO-OPERATIVE LIMITED: FINANCIAL OVERVIEW SNAPSHOT
      184. FIGURE 49 ORNUA CO-OPERATIVE LIMITED: SWOT ANALYSIS
      185. FIGURE 50 TATUA: FINANCIAL OVERVIEW SNAPSHOT
      186. FIGURE 51 TATUA: SWOT ANALYSIS
      187. FIGURE 52 THE EDLONG CORPORATION.: FINANCIAL OVERVIEW SNAPSHOT
      188. FIGURE 53 THE EDLONG CORPORATION.: SWOT ANALYSIS
      189. FIGURE 54 THE J.M. SMUCKER COMPANY.: FINANCIAL OVERVIEW SNAPSHOT
      190. FIGURE 55 THE J.M. SMUCKER COMPANY.: SWOT ANALYSIS
      191. FIGURE 56 UNILEVER: FINANCIAL OVERVIEW SNAPSHOT
      192. FIGURE 57 UNILEVER: SWOT ANALYSIS

    Flavoured Butter Market Segmentation

    Market Segmentation Overview

    • Detailed segmentation data will be available in the full report
    • Comprehensive analysis by multiple parameters
    • Regional and country-level breakdowns
    • Market size forecasts by segment
    Infographic

    Free Sample Request

    Kindly complete the form below to receive a free sample of this Report

    Get Free Sample

    Customer Strories

    “I am very pleased with how market segments have been defined in a relevant way for my purposes (such as "Portable Freezers & refrigerators" and "last-mile"). In general the report is well structured. Thanks very much for your efforts.”

    Victoria Milne

    Founder
    Case Study
    Chemicals and Materials