Field Programmable Gate Array Market Summary
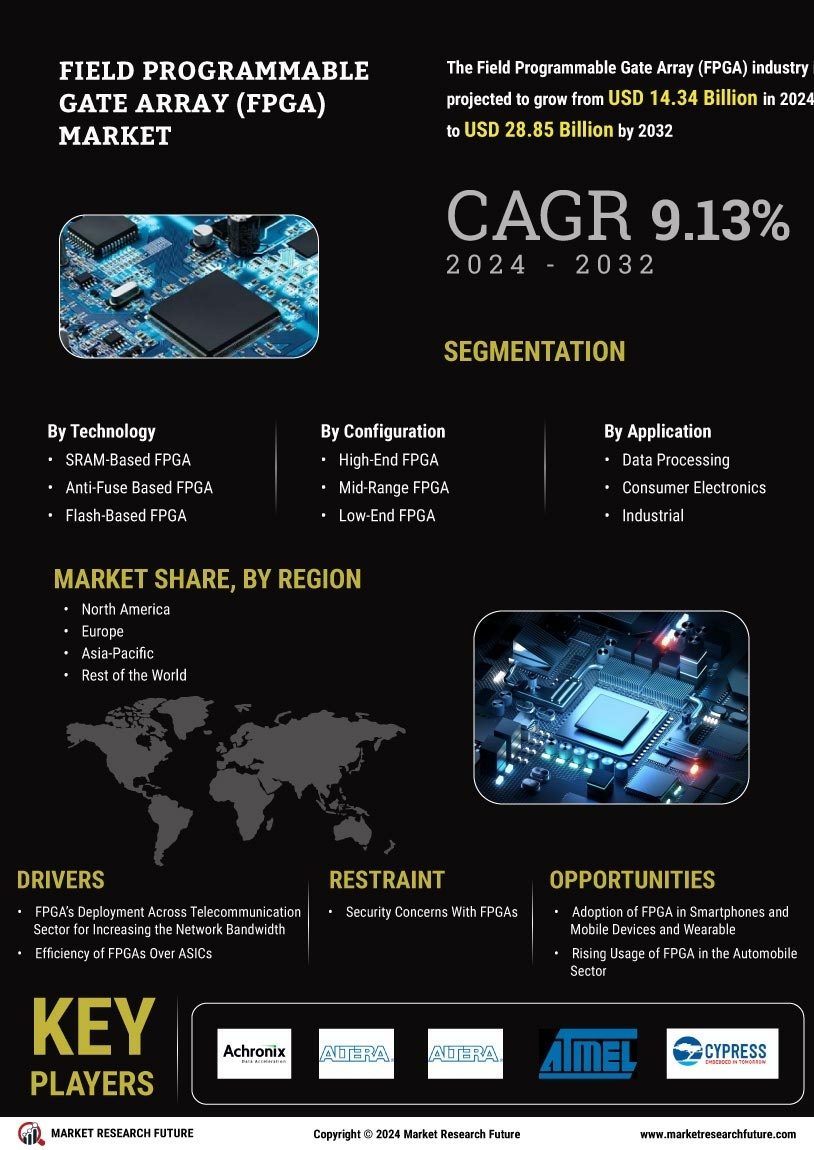
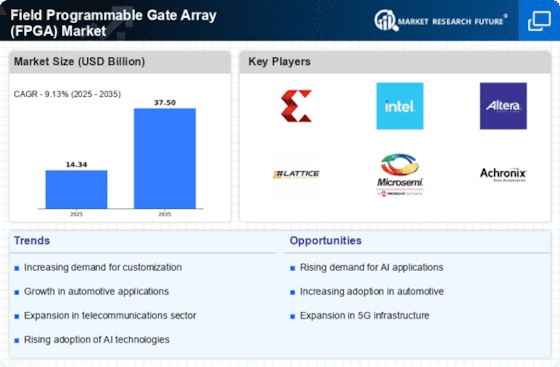
As per MRFR Analysis, the Global Field Programmable Gate Array (FPGA) Market was valued at 8.81 USD Billion in 2024 and is projected to grow to 17.81 USD Billion by 2035, with a CAGR of 6.61% from 2024 to 2032. The market is driven by the increasing demand for high-performance computing, IoT devices, and advanced communication technologies, particularly in sectors like telecommunications, automotive, and aerospace. FPGAs offer customizable hardware solutions that enhance efficiency and adaptability across various applications.
Key Market Trends & Highlights
Key trends driving the FPGA market include technological advancements and growing adoption across multiple sectors.
- FPGA Market Size in 2024: 8.81 USD Billion; Expected to reach 17.81 USD Billion by 2035.
- Static RAM technology holds a market valuation of 3.75 USD Billion in 2023, projected to grow to 6.75 USD Billion by 2032.
- The automotive sector increasingly utilizes FPGAs, reflecting the trend towards automated driving.
- North America leads the market with a valuation of 3.2 USD Billion in 2023, expected to grow to 5.7 USD Billion by 2032.
Market Size & Forecast
2023 Market Size: USD 8.27 Billion
2024 Market Size: USD 8.81 Billion
2035 Market Size: USD 17.81 Billion
CAGR (2025-2035): 6.61%
Largest Regional Market Share in 2023: North America.
Major Players
Key players include Siemens, Analog Devices, Actel, Broadcom, QuickLogic, Microsemi, Texas Instruments, Lattice Semiconductor, MikroElektronika, Altera, Achronix, Xilinx, NVIDIA, and Intel.
Key Field Programmable Gate Array (FPGA) Market Trends Highlighted
Advancements in technology and the proliferation of applications across a variety of sectors are driving substantial trends in the Field Programmable Gate Array (FPGA) Market. The increasing demand for high-performance computing and the necessity for hardware solutions that are both flexible and reconfigurable are among the primary market drivers.
FPGAs are being increasingly adopted by industries such as aerospace, defense, automotive, and telecommunications as a result of their capacity to reduce power consumption and accelerate processing duties. The increasing prevalence of Internet of Things (IoT) devices presents an opportunity for market exploration, as FPGAs can improve data processing and connectivity capabilities.
Furthermore, the global expansion of 5G networks provides an opportunity for FPGA integration, as these devices are capable of efficiently managing intricate signal processing tasks. In recent years, there has been a significant shift toward the implementation of smaller, more energy-efficient FPGA solutions that are suitable for a variety of applications, including peripheral computing and data centers.
Moreover, the integration of artificial intelligence and machine learning capabilities into FPGAs is becoming increasingly prevalent, which facilitates real-time data analysis and intelligent decision-making processes. The competition among FPGA manufacturers is further fueled by the continuous innovation within the semiconductor industry, resulting in rapid technological advancements and expanded product offerings.
The emphasis on FPGAs is expected to increase as companies worldwide endeavor to improve the performance and efficiency of their systems, which is indicative of the necessity for high adaptability in a digital landscape that is swiftly evolving.

Field Programmable Gate Array Market Drivers
Growing Demand for High-Performance Computing
The increasing requirement for high-performance computing (HPC) across various industries is a significant driver for the Field Programmable Gate Array (FPGA) Market Industry. According to global technology platforms, the HPC market has been experiencing a compound annual growth rate (CAGR) of around 7-9% over the past few years, driven by sectors such as financial services, scientific research, and machine learning. Companies like NVIDIA and Intel have significantly invested in HPC solutions, often leveraging FPGAs for their flexibility and performance optimization capabilities.
Furthermore, government initiatives in regions like the European Union aim to enhance their HPC capabilities with a focus on cloud computing, artificial intelligence, and big data analytics, pushing the demand for FPGAs as essential components in these systems. This trend showcases rising importance and reliance on FPGAs to achieve superior computing performance, opening new avenues for market expansion in the Field Programmable Gate Array (FPGA) Market.
Advancements in Telecommunications and 5G Deployment
The rapid deployment of 5G telecommunications networks is driving substantial growth in the Field Programmable Gate Array (FPGA) Market Industry. As telecommunications infrastructure evolves to meet the demands of higher-speed data transfer and increased connectivity, FPGAs are being utilized for their reconfigurable hardware and versatility. Industry giants like Qualcomm and Ericsson are leveraging FPGA technology to optimize and enhance 5G network function and performance.
The International Telecommunication Union has reported that 5G networks are expected to cover one-third of the global population by 2025. This strong growth forecast highlights the critical role of FPGAs in enabling advanced network capabilities and maintaining competitive advantages in an increasingly connected world.
Innovation in Automotive Technology
The automotive industry is experiencing a transformational shift towards automation and electrification, creating opportunities for the Field Programmable Gate Array (FPGA) Market Industry. Established manufacturers such as Tesla and Ford are increasingly incorporating FPGAs in their electric and autonomous vehicles, which require high processing power and real-time data handling. The Automotive Industry Association projects a significant increase in electric vehicle sales, estimating that by 2030, nearly 30% of all vehicle sales worldwide will be electric.
This shift emphasizes the critical need for FPGAs to manage complex algorithms and extensive sensor data to enable autonomous driving capabilities, thereby propelling market growth.
Rising Adoption of Internet of Things (IoT)
The proliferation of Internet of Things (IoT) devices and applications is fostering substantial growth in the Field Programmable Gate Array (FPGA) Market Industry. With the number of connected IoT devices expected to reach 30 billion globally by 2025, there is a pressing need to manage data efficiently and ensure real-time processing. Major technology companies such as Amazon and Microsoft are increasingly leveraging FPGAs in their IoT solutions to enhance performance and efficiency in edge computing scenarios.
According to the Global Standards Organization, the IoT industry is on track to generate a revenue of over $1.5 trillion by 2025, emphasizing the demand for versatile and adaptable hardware solutions like FPGAs, which are essential in navigating the complex landscapes of IoT ecosystems.
Field Programmable Gate Array Market Segment Insights
Field Programmable Gate Array (FPGA) Market Technology Insights
The Field Programmable Gate Array (FPGA) Market, within the Technology segment, showcases significant potential and value, reached 8.81 USD Billion in 2024 and expanding to 17.81 USD Billion by 2035, reflecting robust growth driven by increasing technological advancements. The segmentation within this market highlights three key categories: Static RAM, Flash, and Antifuse, each playing a crucial role in various applications and industries.
Static RAM, valued at 3.54 USD Billion in 2024 and expected to grow to 7.35 USD Billion by 2035, holds a majority share as it offers superior speed and reliability, making it vital for applications requiring high performance, such as telecommunications and data processing.
Flash technology, with a market value of 3.14 USD Billion in 2024 and anticipated to rise to 6.36 USD Billion in 2035, is significant for its capacity to store large volumes of data efficiently, appealing in sectors including consumer electronics and automotive. Lastly, Antifuse technology, which was valued at 2.13 USD Billion in 2024 and is projected to increase to 4.1 USD Billion by 2035, is less dominant but indispensable due to its unique one-time programmability, often utilized in applications demanding high security and reliability.
Each of these technologies contributes uniquely to the overall dynamics of the Field Programmable Gate Array (FPGA) Market revenue, driven by ongoing trends in electronic devices requiring flexible and reconfigurable hardware solutions.
The market growth is also influenced by formidable demands in various industries for customization, efficiency, and adaptability, positioning these technologies at the forefront of innovation. The Field Programmable Gate Array (FPGA) Market statistics illustrate the competitive landscape, where companies are focused on Research and Development to enhance performance and capabilities further, reinforcing their significance in this evolving industry.
Hence, the structured exploration of these segments not only reflects the current standing of each technology but also unveils a path toward future advancements and opportunities in the Field Programmable Gate Array (FPGA) Market data.

Field Programmable Gate Array (FPGA) Market Application Insights
The Application segment of the Field Programmable Gate Array (FPGA) Market showcases a diverse array of industries, each with its unique demands and characteristics. In 2024, the overall market was valued at 8.81 USD Billion, reflecting the ongoing growth across various sectors.
Telecommunications remains a pivotal area, driven by the increasing demand for advanced networking solutions and high-speed data transmission. The Automotive sector is also gaining traction, largely due to the rise of autonomous driving technologies and electric vehicles that require sophisticated electronic systems.
Consumer Electronics continues to dominate in market evolution, with a focus on enhancing product functionality and performance. The Industrial segment benefits from automation and smart manufacturing trends, while Aerospace and Defense applications emphasize reliability and performance in mission-critical environments. Together, these fields contribute significantly to the Field Programmable Gate Array Market revenue, influenced by trends like increased integration of IoT devices and advancements in communication technologies.
The Field Programmable Gate Array (FPGA) Market data indicates that applications in these sectors are essential for driving innovation and meeting consumer expectations across the globe, with each segment presenting distinct growth opportunities and challenges.
Additionally, changes in regulations and technological advancements will continue to shape the dynamics of the Field Programmable Gate Array (FPGA) Market Statistics, enhancing the relevance of FPGAs in various applications.
Field Programmable Gate Array (FPGA) Market End Use Insights
The Field Programmable Gate Array (FPGA) Market exhibits notable diversity in its End Use segmentation, which can be categorized into Consumer, Commercial, and Government applications. As of 2024, the overall market reached a value of 8.81 USD Billion, reflecting significant growth trends in these sectors.
The Consumer segment has gained traction due to increasing demand for advanced electronics and customizable solutions for personal devices. In the Commercial space, the integration of FPGAs into networking, telecommunications, and automotive applications drives market expansion, highlighting the technology's adaptability and efficiency.
Government sector utilization primarily revolves around defense and aerospace applications, where reliability and performance are critical; these sectors are expected to be significant contributors to the market's revenue. The growth of the FPGA Industry is attributed to the rising need for programmable solutions that offer flexibility, energy efficiency, and space-saving benefits.
With a projected CAGR of 6.61 from 2025 to 2035, the market is positioned for substantial advancement, owing to innovations in technology and increasing adoption across various industries, emphasizing the importance of the End Use segmentation in shaping the overall market landscape.
Field Programmable Gate Array (FPGA) Market Product Type Insights
The Field Programmable Gate Array (FPGA) Market, reached 8.81 billion USD in 2024, exhibits substantial growth potential across various product types. High-End FPGAs are crucial for applications requiring extensive processing capabilities, like telecommunications and high-performance computing, establishing their dominance in innovation-driven sectors.
Mid-Range FPGAs serve a balance between performance and cost, making them appealing across industries such as consumer electronics and automotive. Meanwhile, Low-End FPGAs cater to cost-sensitive applications, ensuring their significance in simpler tasks and enhancing overall market penetration.
The growing demand for flexible hardware solutions in edge computing and IoT applications signifies an increasing market shift towards versatile FPGAs, reflecting on the ongoing trends within the FPGA Market revenue.
Market drivers include the surge in automation and AI adoption, yet challenges lie in the complexity of FPGA design. Overall, the Field Programmable Gate Array (FPGA) Market segmentation emphasizes the need for robust solutions tailored to specific applications, ensuring sustained growth opportunities through various product types aligned with technological advancements.
Field Programmable Gate Array (FPGA) Market Regional Insights
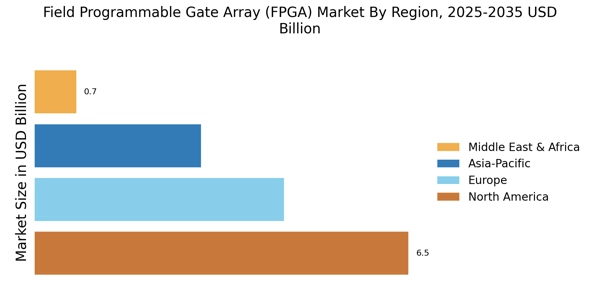
The Field Programmable Gate Array (FPGA) Market shows significant regional diversity in its growth, with North America leading prominently. In 2024, North America held a valuation of 3.54 USD Billion, projected to reach 7.32 USD Billion by 2035, reflecting its majority holding and significance as a technology hub.
Europe follows with a market value of 2.2 USD Billion in 2024, expected to grow to 4.45 USD Billion, supported by robust Research and Development initiatives. The Asia Pacific region, valued at 2.66 USD Billion in 2024, demonstrates potential for rapid expansion, anticipating growth to 5.51 USD Billion, driven by advancements in communication technologies.
South America and the Middle East and Africa exhibit smaller market sizes, valued at 0.6 USD Billion and 0.81 USD Billion, respectively in 2024, but they present emerging opportunities as technology adoption increases, with projections rising to 1.23 USD Billion and 1.3 USD Billion by 2035.
Overall, the Field Programmable Gate Array (FPGA) Market data highlights diverse opportunities across regions, with specific segments like North America and Europe showcasing significant revenue gains due to their established infrastructure and investment in cutting-edge technologies.

Field Programmable Gate Array Market Key Players and Competitive Insights
The Field Programmable Gate Array (FPGA) Market has exhibited remarkable growth, driven by the increasing demand for customizable solutions across various industries including telecommunications, automotive, consumer electronics, and data centers. The competition in this market is characterized by rapid technological advancements, where manufacturers strive to enhance their product offerings through innovation.
Factors such as the rising need for efficient and high-performance computing applications, along with the growing focus on hardware acceleration, significantly fuel the market dynamics. This competitive landscape is further influenced by the entry of new players, strategic collaborations, mergers, and investments in research and development activities, which collectively strengthen the market potential.
Vantis has emerged as a notable player within the Field Programmable Gate Array Industry, known for its innovative approach and strong presence in the sector. The company's strength lies in its advanced design solutions that cater to a wide array of applications, making it a preferred choice for developers seeking flexibility and efficiency. Vantis has built a reputation around its ability to offer high-performance FPGAs that deliver superior speed and reliability.
By focusing on customer-centric design methodologies, the company effectively addresses the diverse requirements of clients across various industries, thereby solidifying its foothold in the global market. Moreover, Vantis’s investments in cutting-edge technology and talent acquisition have further enhanced its competitive edge, enabling it to stay ahead in an evolving landscape.
PolarFire has made substantial contributions to the Field Programmable Gate Array (FPGA) Market, primarily through its distinctive product offerings and market strategies. Known for its low-power FPGA solutions, PolarFire has gained recognition, particularly in applications requiring energy efficiency and high performance. The company boasts a diversified portfolio that includes numerous products tailored for different market segments, thereby enhancing its appeal to customers across the globe.
PolarFire's strengths lie in its strong engineering capabilities and commitment to innovation, which allow it to deliver advanced solutions that meet contemporary demands. The company has also actively pursued strategic partnerships and acquisitions to bolster its market presence, aiming to expand its reach and enhance its technological capabilities. Through continuous research and development, PolarFire remains focused on providing high-quality products that cater to the evolving needs of the FPGA market on a global scale.
Key Companies in the Field Programmable Gate Array (FPGA) Market Include
- Vantis
- PolarFire
- Nallatech
- Lattice Semiconductor
- Achronix
- Intel
- Xilinx
- Gowin Semiconductor
- Efinix
- QuickLogic
- Dialog Semiconductor
- Microsemi
- Actel
Field Programmable Gate Array (FPGA) Industry Developments
Recent developments in the Field Programmable Gate Array Market highlight significant advancements and transformations within the sectorIntel (Altera/PSG) announced in October 2023 its intention to separate its Programmable Solutions Group (PSG) into a standalone company, which will be rebranded as Altera. Altera will offer AI-capable FPGAs such as Agilex 5, 7, and Agilex 9 that are designed for the data center, edge, automotive, and defense sectors. The company also intends to pursue an IPO or partial third-party investment.
Ayar Labs demonstrated a 4 Tbps optical I/O chiplet that was integrated with an Intel Agilex FPGA in a PCIe card at Supercomputing 2023. This chiplet is expected to significantly increase bandwidth and reduce power consumption, which will have an impact on HPC, AI, and disaggregated architectures.
Achronix maintains its independence by providing high-performance Speedster FPGAs and eFPGA IP that are integrated in data centers and with clients such as Intel. The company does not intend to merge or collaborate with Microsemi.
Field Programmable Gate Array (FPGA) Market Segmentation Insights
-
Field Programmable Gate Array Market Technology Outlook
- Static RAM
- Flash
- Antifuse
-
Field Programmable Gate Array Market Application Outlook
- Telecommunications
- Automotive
- Consumer Electronics
- Industrial
- Aerospace and Defense
-
Field Programmable Gate Array Market End Use Outlook
- Consumer
- Commercial
- Government
-
Field Programmable Gate Array Market Product Type Outlook
- High-End
- Mid-Range
- Low-End
-
Field Programmable Gate Array Market Regional Outlook
- North America
- Europe
- South America
- Asia Pacific
- Middle East and Africa
Report Attribute/Metric
|
Details
|
Market Size 2023
|
8.27 (USD Billion)
|
Market Size 2024
|
8.81 (USD Billion)
|
Market Size 2035
|
17.81 (USD Billion)
|
Compound Annual Growth Rate (CAGR)
|
6.61% (2025 - 2035)
|
Report Coverage
|
Revenue Forecast, Competitive Landscape, Growth Factors, and Trends
|
Base Year
|
2024
|
Market Forecast Period
|
2025 - 2035
|
Historical Data
|
2019 - 2024
|
Market Forecast Units
|
USD Billion
|
Key Companies Profiled
|
Vantis, PolarFire, Nallatech, Lattice Semiconductor, Achronix, Intel, Xilinx, Gowin Semiconductor, Efinix, Semtech, QuickLogic, Dialog Semiconductor, Microsemi, Actel, Silego Technology
|
Segments Covered
|
Technology, Application, End Use, Product Type, Regional
|
Key Market Opportunities
|
Emerging IoT applications, Automotive electronics growth, AI and machine learning integration, 5G network expansion, Defense and aerospace innovations
|
Key Market Dynamics
|
Increasing demand for customization, Growth in artificial intelligence, Surging adoption in telecommunications, Rising need for low-latency processing, Technological advancements in semiconductor industry
|
Countries Covered
|
North America, Europe, APAC, South America, MEA
|
Field Programmable Gate Array Market Highlights:
Frequently Asked Questions (FAQ):
The Field Programmable Gate Array (FPGA) Market was valued at 8.81 USD Billion by 2024.
By 2035, the Field Programmable Gate Array (FPGA) Market is projected to reach a value of 17.81 USD Billion.
The Field Programmable Gate Array (FPGA) Market is expected to grow at a CAGR of 6.61% from 2025 to 2035.
North America have the largest market share in the Field Programmable Gate Array (FPGA) Market, valued at 3.54 USD Billion in 2024.
The Asia Pacific region is projected to reach a market size of 5.51 USD Billion in the Field Programmable Gate Array (FPGA) Market by 2035.
Key players in the Field Programmable Gate Array (FPGA) Market include Intel, Xilinx, Lattice Semiconductor, and Achronix, among others.
The Static RAM technology segment was valued at 3.54 USD Billion in the Field Programmable Gate Array (FPGA) Market in 2024.
The Antifuse technology segment is expected to reach a market size of 4.1 USD Billion by 2035 in the Field Programmable Gate Array (FPGA) Market.
The South America region is expected to experience significant growth, with a projected market size of 1.23 USD Billion by 2035 in the FPGA market.
TABLE OF CONTENTS
1. EXECUTIVE SUMMARY
1.1. Market Overview
1.2. Key Findings
1.3. Market Segmentation
1.4. Competitive Landscape
1.5. Challenges and Opportunities
1.6. Future Outlook
2. PROGRAMMABLE GATE ARRAY MARKET INTRODUCTION
2.1. Definition
2.2. Scope of the study
2.2.1. Research Objective
2.2.2. Assumption
2.2.3. Limitations
3. RESEARCH METHODOLOGY
3.1. Overview
3.2. Data Mining
3.3. Secondary Research
3.4. Primary Research
3.4.1. Primary Interviews and Information Gathering Process
3.4.2. Breakdown of Primary Respondents
3.5. Forecasting Model
3.6. Market Size Estimation
3.6.1. Bottom-Up Approach
3.6.2. Top-Down Approach
3.7. Data Triangulation
3.8. Validation
4. PROGRAMMABLE GATE ARRAY MARKET DYNAMICS
4.1. Overview
4.2. Drivers
4.3. Restraints
4.4. Opportunities
5. MARKET FACTOR ANALYSIS
5.1. Value chain Analysis
5.2. Porter's Five Forces Analysis
5.2.1. Bargaining Power of Suppliers
5.2.2. Bargaining Power of Buyers
5.2.3. Threat of New Entrants
5.2.4. Threat of Substitutes
5.2.5. Intensity of Rivalry
5.3. COVID-19 Impact Analysis
5.3.1. Market Impact Analysis
5.3.2. Regional Impact
5.3.3. Opportunity and Threat Analysis
6. FIELD PROGRAMMABLE GATE ARRAY (FPGA) MARKET, BY TECHNOLOGY (USD BILLION)
6.1. Static RAM
6.2. Flash
6.3. Antifuse
7. FIELD PROGRAMMABLE GATE ARRAY (FPGA) MARKET, BY APPLICATION (USD BILLION)
7.1. Telecommunications
7.2. Automotive
7.3. Consumer Electronics
7.4. Industrial
7.5. Aerospace and Defense
8. FIELD PROGRAMMABLE GATE ARRAY (FPGA) MARKET, BY END USE (USD BILLION)
8.1. Consumer
8.2. Commercial
8.3. Government
9. FIELD PROGRAMMABLE GATE ARRAY (FPGA) MARKET, BY PRODUCT TYPE (USD BILLION)
9.1. High-End
9.2. Mid-Range
9.3. Low-End
10. FIELD PROGRAMMABLE GATE ARRAY (FPGA) MARKET, BY REGIONAL (USD BILLION)
10.1. North America PROGRAMMABLE GATE ARRAY (FPGA) MARKET
10.1.1. US
10.1.2. Canada
10.2. Europe PROGRAMMABLE GATE ARRAY (FPGA) MARKET
10.2.1. Germany
10.2.2. UK
10.2.3. France
10.2.4. Russia
10.2.5. Italy
10.2.6. Spain
10.2.7. Rest of Europe
10.3. APAC PROGRAMMABLE GATE ARRAY (FPGA) MARKET
10.3.1. China
10.3.2. India
10.3.3. Japan
10.3.4. South Korea
10.3.5. Malaysia
10.3.6. Thailand
10.3.7. Indonesia
10.3.8. Rest of APAC
10.4. South America PROGRAMMABLE GATE ARRAY (FPGA) MARKET
10.4.1. Brazil
10.4.2. Mexico
10.4.3. Argentina
10.4.4. Rest of South America
10.5. MEA PROGRAMMABLE GATE ARRAY (FPGA) MARKET
10.5.1. GCC Countries
10.5.2. South Africa
10.5.3. Rest of MEA
11. COMPETITIVE LANDSCAPE
11.1. Overview
11.2. Competitive Analysis
11.3. Market share Analysis
11.4. Major Growth Strategy in the Field Programmable Gate Array (FPGA) Market
11.5. Competitive Benchmarking
11.6. Leading Players in Terms of Number of Developments in the Field Programmable Gate Array (FPGA) Market
11.7. Key developments and growth strategies
11.7.1. New Product Launch/Service Deployment
11.7.2. Merger & Acquisitions
11.7.3. Joint Ventures
11.8. Major Players Financial Matrix
11.8.1. Sales and Operating Income
11.8.2. Major Players R&D Expenditure. 2023
12. COMPANY PROFILES
12.1. Vantis
12.1.1. Financial Overview
12.1.2. Products Offered
12.1.3. Key Developments
12.1.4. SWOT Analysis
12.1.5. Key Strategies
12.2. PolarFire
12.2.1. Financial Overview
12.2.2. Products Offered
12.2.3. Key Developments
12.2.4. SWOT Analysis
12.2.5. Key Strategies
12.3. Nallatech
12.3.1. Financial Overview
12.3.2. Products Offered
12.3.3. Key Developments
12.3.4. SWOT Analysis
12.3.5. Key Strategies
12.4. Lattice Semiconductor
12.4.1. Financial Overview
12.4.2. Products Offered
12.4.3. Key Developments
12.4.4. SWOT Analysis
12.4.5. Key Strategies
12.5. Achronix
12.5.1. Financial Overview
12.5.2. Products Offered
12.5.3. Key Developments
12.5.4. SWOT Analysis
12.5.5. Key Strategies
12.6. Intel
12.6.1. Financial Overview
12.6.2. Products Offered
12.6.3. Key Developments
12.6.4. SWOT Analysis
12.6.5. Key Strategies
12.7. Xilinx
12.7.1. Financial Overview
12.7.2. Products Offered
12.7.3. Key Developments
12.7.4. SWOT Analysis
12.7.5. Key Strategies
12.8. Gowin Semiconductor
12.8.1. Financial Overview
12.8.2. Products Offered
12.8.3. Key Developments
12.8.4. SWOT Analysis
12.8.5. Key Strategies
12.9. Efinix
12.9.1. Financial Overview
12.9.2. Products Offered
12.9.3. Key Developments
12.9.4. SWOT Analysis
12.9.5. Key Strategies
12.10. Semtech
12.10.1. Financial Overview
12.10.2. Products Offered
12.10.3. Key Developments
12.10.4. SWOT Analysis
12.10.5. Key Strategies
12.11. QuickLogic
12.11.1. Financial Overview
12.11.2. Products Offered
12.11.3. Key Developments
12.11.4. SWOT Analysis
12.11.5. Key Strategies
12.12. Dialog Semiconductor
12.12.1. Financial Overview
12.12.2. Products Offered
12.12.3. Key Developments
12.12.4. SWOT Analysis
12.12.5. Key Strategies
12.13. Microsemi
12.13.1. Financial Overview
12.13.2. Products Offered
12.13.3. Key Developments
12.13.4. SWOT Analysis
12.13.5. Key Strategies
12.14. Actel
12.14.1. Financial Overview
12.14.2. Products Offered
12.14.3. Key Developments
12.14.4. SWOT Analysis
12.14.5. Key Strategies
12.15. Silego Technology
12.15.1. Financial Overview
12.15.2. Products Offered
12.15.3. Key Developments
12.15.4. SWOT Analysis
12.15.5. Key Strategies
13. APPENDIX
13.1. References
13.2. Related Reports
LIST OF TABLES
TABLE 1. LIST OF ASSUMPTIONS
TABLE 2. NORTH AMERICA MARKET SIZE ESTIMATES & FORECAST, BY TECHNOLOGY, 2019-2035 (USD BILLIONS)
TABLE 3. NORTH AMERICA MARKET SIZE ESTIMATES & FORECAST, BY APPLICATION, 2019-2035 (USD BILLIONS)
TABLE 4. NORTH AMERICA MARKET SIZE ESTIMATES & FORECAST, BY END USE, 2019-2035 (USD BILLIONS)
TABLE 5. NORTH AMERICA MARKET SIZE ESTIMATES & FORECAST, BY PRODUCT TYPE, 2019-2035 (USD BILLIONS)
TABLE 6. NORTH AMERICA MARKET SIZE ESTIMATES & FORECAST, BY REGIONAL, 2019-2035 (USD BILLIONS)
TABLE 7. US MARKET SIZE ESTIMATES & FORECAST, BY TECHNOLOGY, 2019-2035 (USD BILLIONS)
TABLE 8. US MARKET SIZE ESTIMATES & FORECAST, BY APPLICATION, 2019-2035 (USD BILLIONS)
TABLE 9. US MARKET SIZE ESTIMATES & FORECAST, BY END USE, 2019-2035 (USD BILLIONS)
TABLE 10. US MARKET SIZE ESTIMATES & FORECAST, BY PRODUCT TYPE, 2019-2035 (USD BILLIONS)
TABLE 11. US MARKET SIZE ESTIMATES & FORECAST, BY REGIONAL, 2019-2035 (USD BILLIONS)
TABLE 12. CANADA MARKET SIZE ESTIMATES & FORECAST, BY TECHNOLOGY, 2019-2035 (USD BILLIONS)
TABLE 13. CANADA MARKET SIZE ESTIMATES & FORECAST, BY APPLICATION, 2019-2035 (USD BILLIONS)
TABLE 14. CANADA MARKET SIZE ESTIMATES & FORECAST, BY END USE, 2019-2035 (USD BILLIONS)
TABLE 15. CANADA MARKET SIZE ESTIMATES & FORECAST, BY PRODUCT TYPE, 2019-2035 (USD BILLIONS)
TABLE 16. CANADA MARKET SIZE ESTIMATES & FORECAST, BY REGIONAL, 2019-2035 (USD BILLIONS)
TABLE 17. EUROPE MARKET SIZE ESTIMATES & FORECAST, BY TECHNOLOGY, 2019-2035 (USD BILLIONS)
TABLE 18. EUROPE MARKET SIZE ESTIMATES & FORECAST, BY APPLICATION, 2019-2035 (USD BILLIONS)
TABLE 19. EUROPE MARKET SIZE ESTIMATES & FORECAST, BY END USE, 2019-2035 (USD BILLIONS)
TABLE 20. EUROPE MARKET SIZE ESTIMATES & FORECAST, BY PRODUCT TYPE, 2019-2035 (USD BILLIONS)
TABLE 21. EUROPE MARKET SIZE ESTIMATES & FORECAST, BY REGIONAL, 2019-2035 (USD BILLIONS)
TABLE 22. GERMANY MARKET SIZE ESTIMATES & FORECAST, BY TECHNOLOGY, 2019-2035 (USD BILLIONS)
TABLE 23. GERMANY MARKET SIZE ESTIMATES & FORECAST, BY APPLICATION, 2019-2035 (USD BILLIONS)
TABLE 24. GERMANY MARKET SIZE ESTIMATES & FORECAST, BY END USE, 2019-2035 (USD BILLIONS)
TABLE 25. GERMANY MARKET SIZE ESTIMATES & FORECAST, BY PRODUCT TYPE, 2019-2035 (USD BILLIONS)
TABLE 26. GERMANY MARKET SIZE ESTIMATES & FORECAST, BY REGIONAL, 2019-2035 (USD BILLIONS)
TABLE 27. UK MARKET SIZE ESTIMATES & FORECAST, BY TECHNOLOGY, 2019-2035 (USD BILLIONS)
TABLE 28. UK MARKET SIZE ESTIMATES & FORECAST, BY APPLICATION, 2019-2035 (USD BILLIONS)
TABLE 29. UK MARKET SIZE ESTIMATES & FORECAST, BY END USE, 2019-2035 (USD BILLIONS)
TABLE 30. UK MARKET SIZE ESTIMATES & FORECAST, BY PRODUCT TYPE, 2019-2035 (USD BILLIONS)
TABLE 31. UK MARKET SIZE ESTIMATES & FORECAST, BY REGIONAL, 2019-2035 (USD BILLIONS)
TABLE 32. FRANCE MARKET SIZE ESTIMATES & FORECAST, BY TECHNOLOGY, 2019-2035 (USD BILLIONS)
TABLE 33. FRANCE MARKET SIZE ESTIMATES & FORECAST, BY APPLICATION, 2019-2035 (USD BILLIONS)
TABLE 34. FRANCE MARKET SIZE ESTIMATES & FORECAST, BY END USE, 2019-2035 (USD BILLIONS)
TABLE 35. FRANCE MARKET SIZE ESTIMATES & FORECAST, BY PRODUCT TYPE, 2019-2035 (USD BILLIONS)
TABLE 36. FRANCE MARKET SIZE ESTIMATES & FORECAST, BY REGIONAL, 2019-2035 (USD BILLIONS)
TABLE 37. RUSSIA MARKET SIZE ESTIMATES & FORECAST, BY TECHNOLOGY, 2019-2035 (USD BILLIONS)
TABLE 38. RUSSIA MARKET SIZE ESTIMATES & FORECAST, BY APPLICATION, 2019-2035 (USD BILLIONS)
TABLE 39. RUSSIA MARKET SIZE ESTIMATES & FORECAST, BY END USE, 2019-2035 (USD BILLIONS)
TABLE 40. RUSSIA MARKET SIZE ESTIMATES & FORECAST, BY PRODUCT TYPE, 2019-2035 (USD BILLIONS)
TABLE 41. RUSSIA MARKET SIZE ESTIMATES & FORECAST, BY REGIONAL, 2019-2035 (USD BILLIONS)
TABLE 42. ITALY MARKET SIZE ESTIMATES & FORECAST, BY TECHNOLOGY, 2019-2035 (USD BILLIONS)
TABLE 43. ITALY MARKET SIZE ESTIMATES & FORECAST, BY APPLICATION, 2019-2035 (USD BILLIONS)
TABLE 44. ITALY MARKET SIZE ESTIMATES & FORECAST, BY END USE, 2019-2035 (USD BILLIONS)
TABLE 45. ITALY MARKET SIZE ESTIMATES & FORECAST, BY PRODUCT TYPE, 2019-2035 (USD BILLIONS)
TABLE 46. ITALY MARKET SIZE ESTIMATES & FORECAST, BY REGIONAL, 2019-2035 (USD BILLIONS)
TABLE 47. SPAIN MARKET SIZE ESTIMATES & FORECAST, BY TECHNOLOGY, 2019-2035 (USD BILLIONS)
TABLE 48. SPAIN MARKET SIZE ESTIMATES & FORECAST, BY APPLICATION, 2019-2035 (USD BILLIONS)
TABLE 49. SPAIN MARKET SIZE ESTIMATES & FORECAST, BY END USE, 2019-2035 (USD BILLIONS)
TABLE 50. SPAIN MARKET SIZE ESTIMATES & FORECAST, BY PRODUCT TYPE, 2019-2035 (USD BILLIONS)
TABLE 51. SPAIN MARKET SIZE ESTIMATES & FORECAST, BY REGIONAL, 2019-2035 (USD BILLIONS)
TABLE 52. REST OF EUROPE MARKET SIZE ESTIMATES & FORECAST, BY TECHNOLOGY, 2019-2035 (USD BILLIONS)
TABLE 53. REST OF EUROPE MARKET SIZE ESTIMATES & FORECAST, BY APPLICATION, 2019-2035 (USD BILLIONS)
TABLE 54. REST OF EUROPE MARKET SIZE ESTIMATES & FORECAST, BY END USE, 2019-2035 (USD BILLIONS)
TABLE 55. REST OF EUROPE MARKET SIZE ESTIMATES & FORECAST, BY PRODUCT TYPE, 2019-2035 (USD BILLIONS)
TABLE 56. REST OF EUROPE MARKET SIZE ESTIMATES & FORECAST, BY REGIONAL, 2019-2035 (USD BILLIONS)
TABLE 57. APAC MARKET SIZE ESTIMATES & FORECAST, BY TECHNOLOGY, 2019-2035 (USD BILLIONS)
TABLE 58. APAC MARKET SIZE ESTIMATES & FORECAST, BY APPLICATION, 2019-2035 (USD BILLIONS)
TABLE 59. APAC MARKET SIZE ESTIMATES & FORECAST, BY END USE, 2019-2035 (USD BILLIONS)
TABLE 60. APAC MARKET SIZE ESTIMATES & FORECAST, BY PRODUCT TYPE, 2019-2035 (USD BILLIONS)
TABLE 61. APAC MARKET SIZE ESTIMATES & FORECAST, BY REGIONAL, 2019-2035 (USD BILLIONS)
TABLE 62. CHINA MARKET SIZE ESTIMATES & FORECAST, BY TECHNOLOGY, 2019-2035 (USD BILLIONS)
TABLE 63. CHINA MARKET SIZE ESTIMATES & FORECAST, BY APPLICATION, 2019-2035 (USD BILLIONS)
TABLE 64. CHINA MARKET SIZE ESTIMATES & FORECAST, BY END USE, 2019-2035 (USD BILLIONS)
TABLE 65. CHINA MARKET SIZE ESTIMATES & FORECAST, BY PRODUCT TYPE, 2019-2035 (USD BILLIONS)
TABLE 66. CHINA MARKET SIZE ESTIMATES & FORECAST, BY REGIONAL, 2019-2035 (USD BILLIONS)
TABLE 67. INDIA MARKET SIZE ESTIMATES & FORECAST, BY TECHNOLOGY, 2019-2035 (USD BILLIONS)
TABLE 68. INDIA MARKET SIZE ESTIMATES & FORECAST, BY APPLICATION, 2019-2035 (USD BILLIONS)
TABLE 69. INDIA MARKET SIZE ESTIMATES & FORECAST, BY END USE, 2019-2035 (USD BILLIONS)
TABLE 70. INDIA MARKET SIZE ESTIMATES & FORECAST, BY PRODUCT TYPE, 2019-2035 (USD BILLIONS)
TABLE 71. INDIA MARKET SIZE ESTIMATES & FORECAST, BY REGIONAL, 2019-2035 (USD BILLIONS)
TABLE 72. JAPAN MARKET SIZE ESTIMATES & FORECAST, BY TECHNOLOGY, 2019-2035 (USD BILLIONS)
TABLE 73. JAPAN MARKET SIZE ESTIMATES & FORECAST, BY APPLICATION, 2019-2035 (USD BILLIONS)
TABLE 74. JAPAN MARKET SIZE ESTIMATES & FORECAST, BY END USE, 2019-2035 (USD BILLIONS)
TABLE 75. JAPAN MARKET SIZE ESTIMATES & FORECAST, BY PRODUCT TYPE, 2019-2035 (USD BILLIONS)
TABLE 76. JAPAN MARKET SIZE ESTIMATES & FORECAST, BY REGIONAL, 2019-2035 (USD BILLIONS)
TABLE 77. SOUTH KOREA MARKET SIZE ESTIMATES & FORECAST, BY TECHNOLOGY, 2019-2035 (USD BILLIONS)
TABLE 78. SOUTH KOREA MARKET SIZE ESTIMATES & FORECAST, BY APPLICATION, 2019-2035 (USD BILLIONS)
TABLE 79. SOUTH KOREA MARKET SIZE ESTIMATES & FORECAST, BY END USE, 2019-2035 (USD BILLIONS)
TABLE 80. SOUTH KOREA MARKET SIZE ESTIMATES & FORECAST, BY PRODUCT TYPE, 2019-2035 (USD BILLIONS)
TABLE 81. SOUTH KOREA MARKET SIZE ESTIMATES & FORECAST, BY REGIONAL, 2019-2035 (USD BILLIONS)
TABLE 82. MALAYSIA MARKET SIZE ESTIMATES & FORECAST, BY TECHNOLOGY, 2019-2035 (USD BILLIONS)
TABLE 83. MALAYSIA MARKET SIZE ESTIMATES & FORECAST, BY APPLICATION, 2019-2035 (USD BILLIONS)
TABLE 84. MALAYSIA MARKET SIZE ESTIMATES & FORECAST, BY END USE, 2019-2035 (USD BILLIONS)
TABLE 85. MALAYSIA MARKET SIZE ESTIMATES & FORECAST, BY PRODUCT TYPE, 2019-2035 (USD BILLIONS)
TABLE 86. MALAYSIA MARKET SIZE ESTIMATES & FORECAST, BY REGIONAL, 2019-2035 (USD BILLIONS)
TABLE 87. THAILAND MARKET SIZE ESTIMATES & FORECAST, BY TECHNOLOGY, 2019-2035 (USD BILLIONS)
TABLE 88. THAILAND MARKET SIZE ESTIMATES & FORECAST, BY APPLICATION, 2019-2035 (USD BILLIONS)
TABLE 89. THAILAND MARKET SIZE ESTIMATES & FORECAST, BY END USE, 2019-2035 (USD BILLIONS)
TABLE 90. THAILAND MARKET SIZE ESTIMATES & FORECAST, BY PRODUCT TYPE, 2019-2035 (USD BILLIONS)
TABLE 91. THAILAND MARKET SIZE ESTIMATES & FORECAST, BY REGIONAL, 2019-2035 (USD BILLIONS)
TABLE 92. INDONESIA MARKET SIZE ESTIMATES & FORECAST, BY TECHNOLOGY, 2019-2035 (USD BILLIONS)
TABLE 93. INDONESIA MARKET SIZE ESTIMATES & FORECAST, BY APPLICATION, 2019-2035 (USD BILLIONS)
TABLE 94. INDONESIA MARKET SIZE ESTIMATES & FORECAST, BY END USE, 2019-2035 (USD BILLIONS)
TABLE 95. INDONESIA MARKET SIZE ESTIMATES & FORECAST, BY PRODUCT TYPE, 2019-2035 (USD BILLIONS)
TABLE 96. INDONESIA MARKET SIZE ESTIMATES & FORECAST, BY REGIONAL, 2019-2035 (USD BILLIONS)
TABLE 97. REST OF APAC MARKET SIZE ESTIMATES & FORECAST, BY TECHNOLOGY, 2019-2035 (USD BILLIONS)
TABLE 98. REST OF APAC MARKET SIZE ESTIMATES & FORECAST, BY APPLICATION, 2019-2035 (USD BILLIONS)
TABLE 99. REST OF APAC MARKET SIZE ESTIMATES & FORECAST, BY END USE, 2019-2035 (USD BILLIONS)
TABLE 100. REST OF APAC MARKET SIZE ESTIMATES & FORECAST, BY PRODUCT TYPE, 2019-2035 (USD BILLIONS)
TABLE 101. REST OF APAC MARKET SIZE ESTIMATES & FORECAST, BY REGIONAL, 2019-2035 (USD BILLIONS)
TABLE 102. SOUTH AMERICA MARKET SIZE ESTIMATES & FORECAST, BY TECHNOLOGY, 2019-2035 (USD BILLIONS)
TABLE 103. SOUTH AMERICA MARKET SIZE ESTIMATES & FORECAST, BY APPLICATION, 2019-2035 (USD BILLIONS)
TABLE 104. SOUTH AMERICA MARKET SIZE ESTIMATES & FORECAST, BY END USE, 2019-2035 (USD BILLIONS)
TABLE 105. SOUTH AMERICA MARKET SIZE ESTIMATES & FORECAST, BY PRODUCT TYPE, 2019-2035 (USD BILLIONS)
TABLE 106. SOUTH AMERICA MARKET SIZE ESTIMATES & FORECAST, BY REGIONAL, 2019-2035 (USD BILLIONS)
TABLE 107. BRAZIL MARKET SIZE ESTIMATES & FORECAST, BY TECHNOLOGY, 2019-2035 (USD BILLIONS)
TABLE 108. BRAZIL MARKET SIZE ESTIMATES & FORECAST, BY APPLICATION, 2019-2035 (USD BILLIONS)
TABLE 109. BRAZIL MARKET SIZE ESTIMATES & FORECAST, BY END USE, 2019-2035 (USD BILLIONS)
TABLE 110. BRAZIL MARKET SIZE ESTIMATES & FORECAST, BY PRODUCT TYPE, 2019-2035 (USD BILLIONS)
TABLE 111. BRAZIL MARKET SIZE ESTIMATES & FORECAST, BY REGIONAL, 2019-2035 (USD BILLIONS)
TABLE 112. MEXICO MARKET SIZE ESTIMATES & FORECAST, BY TECHNOLOGY, 2019-2035 (USD BILLIONS)
TABLE 113. MEXICO MARKET SIZE ESTIMATES & FORECAST, BY APPLICATION, 2019-2035 (USD BILLIONS)
TABLE 114. MEXICO MARKET SIZE ESTIMATES & FORECAST, BY END USE, 2019-2035 (USD BILLIONS)
TABLE 115. MEXICO MARKET SIZE ESTIMATES & FORECAST, BY PRODUCT TYPE, 2019-2035 (USD BILLIONS)
TABLE 116. MEXICO MARKET SIZE ESTIMATES & FORECAST, BY REGIONAL, 2019-2035 (USD BILLIONS)
TABLE 117. ARGENTINA MARKET SIZE ESTIMATES & FORECAST, BY TECHNOLOGY, 2019-2035 (USD BILLIONS)
TABLE 118. ARGENTINA MARKET SIZE ESTIMATES & FORECAST, BY APPLICATION, 2019-2035 (USD BILLIONS)
TABLE 119. ARGENTINA MARKET SIZE ESTIMATES & FORECAST, BY END USE, 2019-2035 (USD BILLIONS)
TABLE 120. ARGENTINA MARKET SIZE ESTIMATES & FORECAST, BY PRODUCT TYPE, 2019-2035 (USD BILLIONS)
TABLE 121. ARGENTINA MARKET SIZE ESTIMATES & FORECAST, BY REGIONAL, 2019-2035 (USD BILLIONS)
TABLE 122. REST OF SOUTH AMERICA MARKET SIZE ESTIMATES & FORECAST, BY TECHNOLOGY, 2019-2035 (USD BILLIONS)
TABLE 123. REST OF SOUTH AMERICA MARKET SIZE ESTIMATES & FORECAST, BY APPLICATION, 2019-2035 (USD BILLIONS)
TABLE 124. REST OF SOUTH AMERICA MARKET SIZE ESTIMATES & FORECAST, BY END USE, 2019-2035 (USD BILLIONS)
TABLE 125. REST OF SOUTH AMERICA MARKET SIZE ESTIMATES & FORECAST, BY PRODUCT TYPE, 2019-2035 (USD BILLIONS)
TABLE 126. REST OF SOUTH AMERICA MARKET SIZE ESTIMATES & FORECAST, BY REGIONAL, 2019-2035 (USD BILLIONS)
TABLE 127. MEA MARKET SIZE ESTIMATES & FORECAST, BY TECHNOLOGY, 2019-2035 (USD BILLIONS)
TABLE 128. MEA MARKET SIZE ESTIMATES & FORECAST, BY APPLICATION, 2019-2035 (USD BILLIONS)
TABLE 129. MEA MARKET SIZE ESTIMATES & FORECAST, BY END USE, 2019-2035 (USD BILLIONS)
TABLE 130. MEA MARKET SIZE ESTIMATES & FORECAST, BY PRODUCT TYPE, 2019-2035 (USD BILLIONS)
TABLE 131. MEA MARKET SIZE ESTIMATES & FORECAST, BY REGIONAL, 2019-2035 (USD BILLIONS)
TABLE 132. GCC COUNTRIES MARKET SIZE ESTIMATES & FORECAST, BY TECHNOLOGY, 2019-2035 (USD BILLIONS)
TABLE 133. GCC COUNTRIES MARKET SIZE ESTIMATES & FORECAST, BY APPLICATION, 2019-2035 (USD BILLIONS)
TABLE 134. GCC COUNTRIES MARKET SIZE ESTIMATES & FORECAST, BY END USE, 2019-2035 (USD BILLIONS)
TABLE 135. GCC COUNTRIES MARKET SIZE ESTIMATES & FORECAST, BY PRODUCT TYPE, 2019-2035 (USD BILLIONS)
TABLE 136. GCC COUNTRIES MARKET SIZE ESTIMATES & FORECAST, BY REGIONAL, 2019-2035 (USD BILLIONS)
TABLE 137. SOUTH AFRICA MARKET SIZE ESTIMATES & FORECAST, BY TECHNOLOGY, 2019-2035 (USD BILLIONS)
TABLE 138. SOUTH AFRICA MARKET SIZE ESTIMATES & FORECAST, BY APPLICATION, 2019-2035 (USD BILLIONS)
TABLE 139. SOUTH AFRICA MARKET SIZE ESTIMATES & FORECAST, BY END USE, 2019-2035 (USD BILLIONS)
TABLE 140. SOUTH AFRICA MARKET SIZE ESTIMATES & FORECAST, BY PRODUCT TYPE, 2019-2035 (USD BILLIONS)
TABLE 141. SOUTH AFRICA MARKET SIZE ESTIMATES & FORECAST, BY REGIONAL, 2019-2035 (USD BILLIONS)
TABLE 142. REST OF MEA MARKET SIZE ESTIMATES & FORECAST, BY TECHNOLOGY, 2019-2035 (USD BILLIONS)
TABLE 143. REST OF MEA MARKET SIZE ESTIMATES & FORECAST, BY APPLICATION, 2019-2035 (USD BILLIONS)
TABLE 144. REST OF MEA MARKET SIZE ESTIMATES & FORECAST, BY END USE, 2019-2035 (USD BILLIONS)
TABLE 145. REST OF MEA MARKET SIZE ESTIMATES & FORECAST, BY PRODUCT TYPE, 2019-2035 (USD BILLIONS)
TABLE 146. REST OF MEA MARKET SIZE ESTIMATES & FORECAST, BY REGIONAL, 2019-2035 (USD BILLIONS)
TABLE 147. PRODUCT LAUNCH/PRODUCT DEVELOPMENT/APPROVAL
TABLE 148. ACQUISITION/PARTNERSHIP
LIST OF FIGURES
FIGURE 1. MARKET FIELD PROGRAMMABLE GATE ARRAY MARKET SYNOPSIS
FIGURE 2. NORTH AMERICA FIELD PROGRAMMABLE GATE ARRAY MARKET ANALYSIS
FIGURE 3. US MARKET ANALYSIS BY TECHNOLOGY
FIGURE 4. US MARKET ANALYSIS BY APPLICATION
FIGURE 5. US MARKET ANALYSIS BY END USE
FIGURE 6. US MARKET ANALYSIS BY PRODUCT TYPE
FIGURE 7. US MARKET ANALYSIS BY REGIONAL
FIGURE 8. CANADA MARKET ANALYSIS BY TECHNOLOGY
FIGURE 9. CANADA MARKET ANALYSIS BY APPLICATION
FIGURE 10. CANADA MARKET ANALYSIS BY END USE
FIGURE 11. CANADA MARKET ANALYSIS BY PRODUCT TYPE
FIGURE 12. CANADA MARKET ANALYSIS BY REGIONAL
FIGURE 13. EUROPE FIELD PROGRAMMABLE GATE ARRAY MARKET ANALYSIS
FIGURE 14. GERMANY MARKET ANALYSIS BY TECHNOLOGY
FIGURE 15. GERMANY MARKET ANALYSIS BY APPLICATION
FIGURE 16. GERMANY MARKET ANALYSIS BY END USE
FIGURE 17. GERMANY MARKET ANALYSIS BY PRODUCT TYPE
FIGURE 18. GERMANY MARKET ANALYSIS BY REGIONAL
FIGURE 19. UK MARKET ANALYSIS BY TECHNOLOGY
FIGURE 20. UK MARKET ANALYSIS BY APPLICATION
FIGURE 21. UK MARKET ANALYSIS BY END USE
FIGURE 22. UK MARKET ANALYSIS BY PRODUCT TYPE
FIGURE 23. UK MARKET ANALYSIS BY REGIONAL
FIGURE 24. FRANCE MARKET ANALYSIS BY TECHNOLOGY
FIGURE 25. FRANCE MARKET ANALYSIS BY APPLICATION
FIGURE 26. FRANCE MARKET ANALYSIS BY END USE
FIGURE 27. FRANCE MARKET ANALYSIS BY PRODUCT TYPE
FIGURE 28. FRANCE MARKET ANALYSIS BY REGIONAL
FIGURE 29. RUSSIA MARKET ANALYSIS BY TECHNOLOGY
FIGURE 30. RUSSIA MARKET ANALYSIS BY APPLICATION
FIGURE 31. RUSSIA MARKET ANALYSIS BY END USE
FIGURE 32. RUSSIA MARKET ANALYSIS BY PRODUCT TYPE
FIGURE 33. RUSSIA MARKET ANALYSIS BY REGIONAL
FIGURE 34. ITALY MARKET ANALYSIS BY TECHNOLOGY
FIGURE 35. ITALY MARKET ANALYSIS BY APPLICATION
FIGURE 36. ITALY MARKET ANALYSIS BY END USE
FIGURE 37. ITALY MARKET ANALYSIS BY PRODUCT TYPE
FIGURE 38. ITALY MARKET ANALYSIS BY REGIONAL
FIGURE 39. SPAIN MARKET ANALYSIS BY TECHNOLOGY
FIGURE 40. SPAIN MARKET ANALYSIS BY APPLICATION
FIGURE 41. SPAIN MARKET ANALYSIS BY END USE
FIGURE 42. SPAIN MARKET ANALYSIS BY PRODUCT TYPE
FIGURE 43. SPAIN MARKET ANALYSIS BY REGIONAL
FIGURE 44. REST OF EUROPE MARKET ANALYSIS BY TECHNOLOGY
FIGURE 45. REST OF EUROPE MARKET ANALYSIS BY APPLICATION
FIGURE 46. REST OF EUROPE MARKET ANALYSIS BY END USE
FIGURE 47. REST OF EUROPE MARKET ANALYSIS BY PRODUCT TYPE
FIGURE 48. REST OF EUROPE MARKET ANALYSIS BY REGIONAL
FIGURE 49. APAC FIELD PROGRAMMABLE GATE ARRAY MARKET ANALYSIS
FIGURE 50. CHINA MARKET ANALYSIS BY TECHNOLOGY
FIGURE 51. CHINA MARKET ANALYSIS BY APPLICATION
FIGURE 52. CHINA MARKET ANALYSIS BY END USE
FIGURE 53. CHINA MARKET ANALYSIS BY PRODUCT TYPE
FIGURE 54. CHINA MARKET ANALYSIS BY REGIONAL
FIGURE 55. INDIA MARKET ANALYSIS BY TECHNOLOGY
FIGURE 56. INDIA MARKET ANALYSIS BY APPLICATION
FIGURE 57. INDIA MARKET ANALYSIS BY END USE
FIGURE 58. INDIA MARKET ANALYSIS BY PRODUCT TYPE
FIGURE 59. INDIA MARKET ANALYSIS BY REGIONAL
FIGURE 60. JAPAN MARKET ANALYSIS BY TECHNOLOGY
FIGURE 61. JAPAN MARKET ANALYSIS BY APPLICATION
FIGURE 62. JAPAN MARKET ANALYSIS BY END USE
FIGURE 63. JAPAN MARKET ANALYSIS BY PRODUCT TYPE
FIGURE 64. JAPAN MARKET ANALYSIS BY REGIONAL
FIGURE 65. SOUTH KOREA MARKET ANALYSIS BY TECHNOLOGY
FIGURE 66. SOUTH KOREA MARKET ANALYSIS BY APPLICATION
FIGURE 67. SOUTH KOREA MARKET ANALYSIS BY END USE
FIGURE 68. SOUTH KOREA MARKET ANALYSIS BY PRODUCT TYPE
FIGURE 69. SOUTH KOREA MARKET ANALYSIS BY REGIONAL
FIGURE 70. MALAYSIA MARKET ANALYSIS BY TECHNOLOGY
FIGURE 71. MALAYSIA MARKET ANALYSIS BY APPLICATION
FIGURE 72. MALAYSIA MARKET ANALYSIS BY END USE
FIGURE 73. MALAYSIA MARKET ANALYSIS BY PRODUCT TYPE
FIGURE 74. MALAYSIA MARKET ANALYSIS BY REGIONAL
FIGURE 75. THAILAND MARKET ANALYSIS BY TECHNOLOGY
FIGURE 76. THAILAND MARKET ANALYSIS BY APPLICATION
FIGURE 77. THAILAND MARKET ANALYSIS BY END USE
FIGURE 78. THAILAND MARKET ANALYSIS BY PRODUCT TYPE
FIGURE 79. THAILAND MARKET ANALYSIS BY REGIONAL
FIGURE 80. INDONESIA MARKET ANALYSIS BY TECHNOLOGY
FIGURE 81. INDONESIA MARKET ANALYSIS BY APPLICATION
FIGURE 82. INDONESIA MARKET ANALYSIS BY END USE
FIGURE 83. INDONESIA MARKET ANALYSIS BY PRODUCT TYPE
FIGURE 84. INDONESIA MARKET ANALYSIS BY REGIONAL
FIGURE 85. REST OF APAC MARKET ANALYSIS BY TECHNOLOGY
FIGURE 86. REST OF APAC MARKET ANALYSIS BY APPLICATION
FIGURE 87. REST OF APAC MARKET ANALYSIS BY END USE
FIGURE 88. REST OF APAC MARKET ANALYSIS BY PRODUCT TYPE
FIGURE 89. REST OF APAC MARKET ANALYSIS BY REGIONAL
FIGURE 90. SOUTH AMERICA FIELD PROGRAMMABLE GATE ARRAY MARKET ANALYSIS
FIGURE 91. BRAZIL MARKET ANALYSIS BY TECHNOLOGY
FIGURE 92. BRAZIL MARKET ANALYSIS BY APPLICATION
FIGURE 93. BRAZIL MARKET ANALYSIS BY END USE
FIGURE 94. BRAZIL MARKET ANALYSIS BY PRODUCT TYPE
FIGURE 95. BRAZIL MARKET ANALYSIS BY REGIONAL
FIGURE 96. MEXICO MARKET ANALYSIS BY TECHNOLOGY
FIGURE 97. MEXICO MARKET ANALYSIS BY APPLICATION
FIGURE 98. MEXICO MARKET ANALYSIS BY END USE
FIGURE 99. MEXICO MARKET ANALYSIS BY PRODUCT TYPE
FIGURE 100. MEXICO MARKET ANALYSIS BY REGIONAL
FIGURE 101. ARGENTINA MARKET ANALYSIS BY TECHNOLOGY
FIGURE 102. ARGENTINA MARKET ANALYSIS BY APPLICATION
FIGURE 103. ARGENTINA MARKET ANALYSIS BY END USE
FIGURE 104. ARGENTINA MARKET ANALYSIS BY PRODUCT TYPE
FIGURE 105. ARGENTINA MARKET ANALYSIS BY REGIONAL
FIGURE 106. REST OF SOUTH AMERICA MARKET ANALYSIS BY TECHNOLOGY
FIGURE 107. REST OF SOUTH AMERICA MARKET ANALYSIS BY APPLICATION
FIGURE 108. REST OF SOUTH AMERICA MARKET ANALYSIS BY END USE
FIGURE 109. REST OF SOUTH AMERICA MARKET ANALYSIS BY PRODUCT TYPE
FIGURE 110. REST OF SOUTH AMERICA MARKET ANALYSIS BY REGIONAL
FIGURE 111. MEA FIELD PROGRAMMABLE GATE ARRAY MARKET ANALYSIS
FIGURE 112. GCC COUNTRIES MARKET ANALYSIS BY TECHNOLOGY
FIGURE 113. GCC COUNTRIES MARKET ANALYSIS BY APPLICATION
FIGURE 114. GCC COUNTRIES MARKET ANALYSIS BY END USE
FIGURE 115. GCC COUNTRIES MARKET ANALYSIS BY PRODUCT TYPE
FIGURE 116. GCC COUNTRIES MARKET ANALYSIS BY REGIONAL
FIGURE 117. SOUTH AFRICA MARKET ANALYSIS BY TECHNOLOGY
FIGURE 118. SOUTH AFRICA MARKET ANALYSIS BY APPLICATION
FIGURE 119. SOUTH AFRICA MARKET ANALYSIS BY END USE
FIGURE 120. SOUTH AFRICA MARKET ANALYSIS BY PRODUCT TYPE
FIGURE 121. SOUTH AFRICA MARKET ANALYSIS BY REGIONAL
FIGURE 122. REST OF MEA MARKET ANALYSIS BY TECHNOLOGY
FIGURE 123. REST OF MEA MARKET ANALYSIS BY APPLICATION
FIGURE 124. REST OF MEA MARKET ANALYSIS BY END USE
FIGURE 125. REST OF MEA MARKET ANALYSIS BY PRODUCT TYPE
FIGURE 126. REST OF MEA MARKET ANALYSIS BY REGIONAL
FIGURE 127. KEY BUYING CRITERIA OF FIELD PROGRAMMABLE GATE ARRAY (FPGA) MARKET
FIGURE 128. RESEARCH PROCESS OF MRFR
FIGURE 129. DRO ANALYSIS OF FIELD PROGRAMMABLE GATE ARRAY (FPGA) MARKET
FIGURE 130. DRIVERS IMPACT ANALYSIS: FIELD PROGRAMMABLE GATE ARRAY (FPGA) MARKET
FIGURE 131. RESTRAINTS IMPACT ANALYSIS: FIELD PROGRAMMABLE GATE ARRAY (FPGA) MARKET
FIGURE 132. SUPPLY / VALUE CHAIN: FIELD PROGRAMMABLE GATE ARRAY (FPGA) MARKET
FIGURE 133. FIELD PROGRAMMABLE GATE ARRAY (FPGA) MARKET, BY TECHNOLOGY, 2025 (% SHARE)
FIGURE 134. FIELD PROGRAMMABLE GATE ARRAY (FPGA) MARKET, BY TECHNOLOGY, 2019 TO 2035 (USD Billions)
FIGURE 135. FIELD PROGRAMMABLE GATE ARRAY (FPGA) MARKET, BY APPLICATION, 2025 (% SHARE)
FIGURE 136. FIELD PROGRAMMABLE GATE ARRAY (FPGA) MARKET, BY APPLICATION, 2019 TO 2035 (USD Billions)
FIGURE 137. FIELD PROGRAMMABLE GATE ARRAY (FPGA) MARKET, BY END USE, 2025 (% SHARE)
FIGURE 138. FIELD PROGRAMMABLE GATE ARRAY (FPGA) MARKET, BY END USE, 2019 TO 2035 (USD Billions)
FIGURE 139. FIELD PROGRAMMABLE GATE ARRAY (FPGA) MARKET, BY PRODUCT TYPE, 2025 (% SHARE)
FIGURE 140. FIELD PROGRAMMABLE GATE ARRAY (FPGA) MARKET, BY PRODUCT TYPE, 2019 TO 2035 (USD Billions)
FIGURE 141. FIELD PROGRAMMABLE GATE ARRAY (FPGA) MARKET, BY REGIONAL, 2025 (% SHARE)
FIGURE 142. FIELD PROGRAMMABLE GATE ARRAY (FPGA) MARKET, BY REGIONAL, 2019 TO 2035 (USD Billions)
FIGURE 143. BENCHMARKING OF MAJOR COMPETITORS