Segmentation Quick Reference
| Dimension | Sub-Segments | Dominant Segment | Fastest Growing Segment |
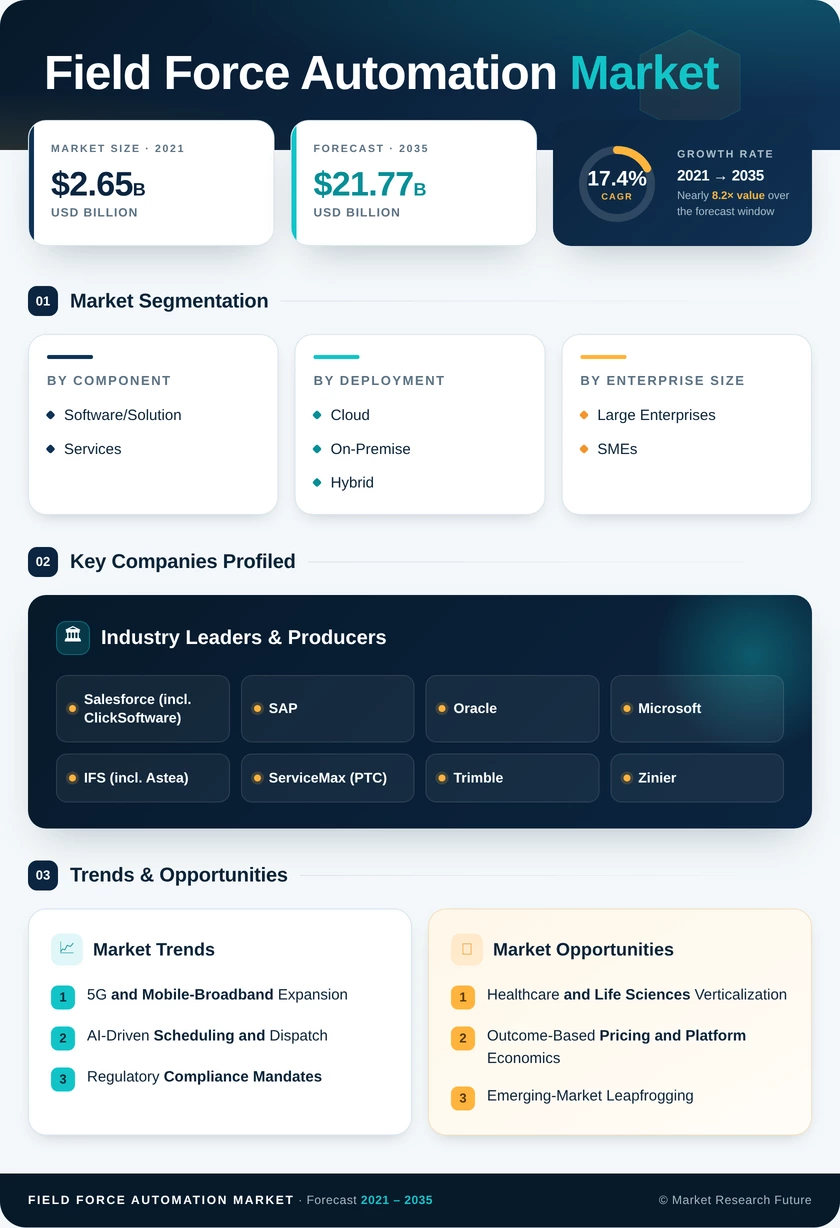
| Component | Field Force Automation Market/Solution, Services | Field Force Automation Market/Solution | Services |
| Deployment | Cloud, On-Premise, Hybrid | Cloud | Hybrid |
| Enterprise Size | Large Enterprises, SMEs | Large Enterprises | SMEs |
| Platform | Android, iOS, Windows | Android | iOS |
| Functionality | Scheduling and Dispatch, Route Optimization, Inventory and Parts Management, Work Order Management, Customer Management, Reporting and Analytics | Scheduling and Dispatch | Inventory and Parts Management |
| End-User Industry | Transportation and Logistics, Healthcare and Field Force Automation Market, IT and Telecom, Manufacturing, Energy and Utilities, Others | Transportation and Logistics | Healthcare and Field Force Automation Market |
Market Segmentation Overview
By Component
| Sub-Segment | Key Trend |
| Field Force Automation Market/Solution | Shift from standalone scheduling tools to unified AI-orchestrated platform suites. |
| Services | Growth in managed services and outcome-based implementation contracts |
Field Force Automation Market/Solution captures the largest revenue share as enterprises consolidate multiple point solutions into single-vendor platforms. Service growth is propelled by demand for change management, training, and ongoing optimization support.
By Deployment
| Sub-Segment | Key Trend |
| Cloud | Multi-tenant SaaS models with elastic scaling for seasonal workforce fluctuations |
| On-Premise | Persists in defense, government, and heavily regulated industries requiring data sovereignty |
| Hybrid | Bridges legacy on-premise ERP with cloud-native scheduling and analytics modules |
Cloud deployment dominates as organizations prioritize operational agility over infrastructure control. Hybrid models are gaining traction among enterprises midway through digital transformation.
By Enterprise Size
| Sub-Segment | Key Trend |
| Large Enterprises | Multi-region, multi-skill-set deployments with custom analytics layers |
| SMEs | Self-service SaaS tiers with usage-based pricing and mobile-first UX |
Large enterprises drive current spending volume, while SMEs represent the faster-expanding segment as affordable entry points proliferate.
By Platform
| Sub-Segment | Key Trend |
| Android | Preferred for cost-sensitive deployments and rugged-device availability |
| iOS | Growing in enterprise-mandated security environments and MDM-heavy organizations |
| Windows | Declining share; persists in legacy ruggedized tablet deployments. |
Android's dominance reflects the economics of equipping large field teams with sub-USD 200 rugged devices. iOS growth stems from corporate security policies favoring Apple's closed ecosystem.
By Functionality
| Sub-Segment | Key Trend |
| Scheduling and Dispatch | AI-powered auto-scheduling replacing manual dispatcher workflows |
| Route Optimization | Carbon-aware routing algorithms integrating fuel and emissions data |
| Inventory and Parts Management | Predictive replenishment tied to work-order forecasting models |
| Work Order Management | Digital audit trails replacing paper-based sign-off processes |
| Customer Management | Real-time NPS scoring and automated post-visit surveys |
| Reporting and Analytics | Executive dashboards with embedded predictive KPI modeling |
Scheduling and Dispatch remains the foundational module that anchors platform selection. Inventory and Parts Management is the fastest-growing functionality as first-time-fix economics increasingly drive procurement decisions.
By End-User Industry
| Sub-Segment | Key Trend |
| Transportation and Logistics | Last-mile delivery orchestration and real-time fleet visibility |
| Healthcare and Field Force Automation Market | EVV compliance, home-health visit tracking, clinical-trial monitoring |
| IT and Telecom | Cell-tower maintenance and fiber-rollout coordination |
| Manufacturing | Predictive equipment servicing tied to IoT sensor feeds |
| Energy and Utilities | Smart-meter deployment and grid-fault response automation |
| Others (Retail, BFSI, Government) | Branch-banking automation, government facility management |
Transportation and Logistics holds the largest end-user share, while Healthcare and Field Force Automation Market are the fastest-growing verticals driven by regulatory mandates and demographic tailwinds.