Fertilizer Additives Market
ID: MRFR/Agri/3875-HCR
200 Pages
Snehal Singh
Last Updated: April 28, 2026
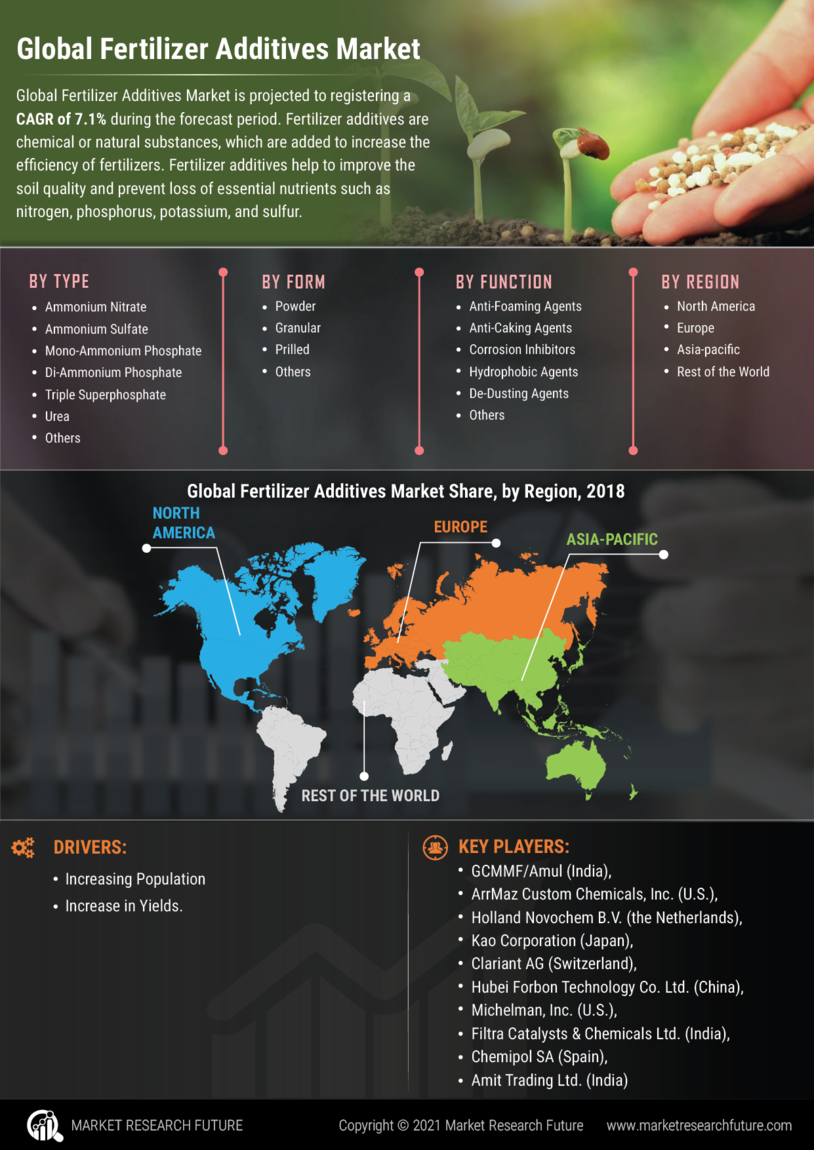
Fertilizer Additives Market Size, Share, Industry Trend & Analysis Research Report By Additive Type (Nutrient Additives, Stabilizers, Coating Agents, Enhancers), By Application (Cereals and Grains, Fruits and Vegetables, Turf and Ornamental, Non-Crop), By Formulation Type (Granular, Liquid, Water Soluble, Slow Release), By Functionality (Nutrient Efficiency, Soil Health Improvement, Reduced Leaching, Enhanced Crop Yield) and By Regional (North America, Europe, South America, Asia Pacific, Middle East and Africa) - Forecast to 2035