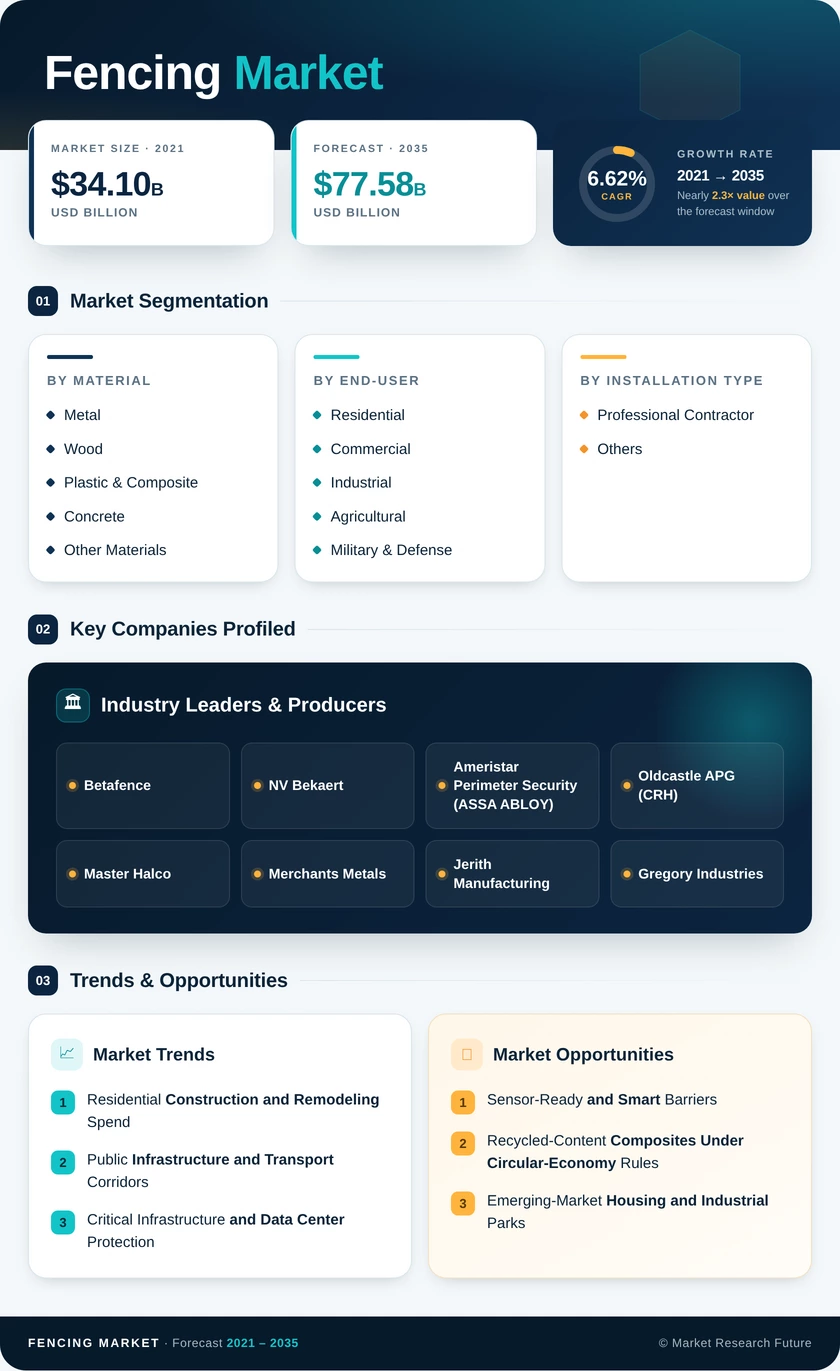
Fencing Market (2026 - 2035)

ID: MRFR/PCM/5919-HCR 111 Pages Snehal Singh Last Updated: November 07, 2026
Fencing Market Research Report Information By Material (Metal, Wood, Plastic & Composite, Concrete, and Other Materials), By End-User (Residential, Commercial, Industrial, Agricultural, Military & Defense, and Other End-Users), and By Installation Type (Professional Contractor and Others) – Forecast Till 2035.
Fencing Market
Market Size
Forecast Period2026-2035
CAGR (2026-2035)6.62%
2025 Market SizeUSD 40.90 Billion
2035 Market SizeUSD 77.58 Billion
Key Players
Betafence
NV Bekaert
Ameristar Perimeter Security
Oldcastle APG
Master Halco
Merchants Metals
Opportunities
  • Sensor-Ready and Smart Barriers
  • Recycled-Content Composites Under Circular-Economy Rules
  • Emerging-Market Housing and Industrial Parks
  1. 1 Market Summary | |
  2. 2 Key Report Takeaways | |
    1. 2.1 By Material | |
    2. 2.2 By End-User | |
    3. 2.3 By Installation Type | |
    4. 2.4 By Region | |
  3. 3 Market Size and Forecast (2021–2035) | |
    1. 3.1 Historical Market Size (2021–2025) | |
    2. 3.2 Forecast Market Size (2026–2035) | |
    3. 3.3 Year-over-Year Growth Analysis | |
  4. 4 Driver Impact Analysis | |
    1. 4.1 Residential Construction and Remodeling Spend | |
    2. 4.2 Public Infrastructure and Transport Corridors | |
    3. 4.3 Critical Infrastructure and Data Center Protection | |
    4. 4.4 Agricultural Modernization and Grazing Programs | |
    5. 4.5 Asia-Pacific Urbanization and Housing Programs | |
    6. 4.6 Border, Defense, and Public-Safety Programs | |
  5. 5 Restraints Impact Analysis | |
    1. 5.1 Steel and Aluminum Cost Volatility | |
    2. 5.2 Skilled Installer Shortage | |
    3. 5.3 Permitting, Zoning, and HOA Constraints | |
    4. 5.4 Timber Supply and Durability Concerns | |
    5. 5.5 Substitution by Electronic and Virtual Barriers | |
  6. 6 Opportunities | |
    1. 6.1 Sensor-Ready and Smart Barriers | |
    2. 6.2 Recycled-Content Composites Under Circular-Economy Rules | |
    3. 6.3 Emerging-Market Housing and Industrial Parks | |
    4. 6.4 Service Models: Rental, Maintenance Contracts, and Intrusion Data | |
    5. 6.5 Solar-Integrated and Agrivoltaic Fence Lines | |
  7. 7 Regional Market Share and Country-Level Analysis | |
    1. 7.1 North America | | |
      1. 7.1.1 US | | |
      2. 7.1.2 Canada | | |
      3. 7.1.3 Mexico | |
    2. 7.2 Europe | | |
      1. 7.2.1 Germany | | |
      2. 7.2.2 UK | | |
      3. 7.2.3 France | | |
      4. 7.2.4 Italy | | |
      5. 7.2.5 Spain | | |
      6. 7.2.6 Nordic Countries | | |
      7. 7.2.7 Russia | | |
      8. 7.2.8 Rest of Europe | |
    3. 7.3 Asia-Pacific | | |
      1. 7.3.1 China | | |
      2. 7.3.2 India | | |
      3. 7.3.3 Japan | | |
      4. 7.3.4 South Korea | | |
      5. 7.3.5 ASEAN | | |
      6. 7.3.6 Rest of Asia-Pacific | |
    4. 7.4 South America | | |
      1. 7.4.1 Brazil | | |
      2. 7.4.2 Argentina | | |
      3. 7.4.3 Rest of South America | |
    5. 7.5 Middle East & Africa | | |
      1. 7.5.1 Saudi Arabia | | |
      2. 7.5.2 UAE | | |
      3. 7.5.3 South Africa | | |
      4. 7.5.4 Egypt | | |
      5. 7.5.5 Rest of MEA | |
  8. 8 Future Outlook (2026–2035) | |
    1. 8.1 Digital Design and Automated Installation | |
    2. 8.2 Circular Materials and ESG Disclosure | |
    3. 8.3 Climate-Resilient Specifications | |
    4. 8.4 Convergence of Physical and Electronic Protection | |
  9. 9 Segmentation Analysis | |
    1. 9.1 By Material | | |
      1. 9.1.1 Metal | | |
      2. 9.1.2 Wood | | |
      3. 9.1.3 Plastic & Composite | | |
      4. 9.1.4 Concrete | | |
      5. 9.1.5 Other Materials | |
    2. 9.2 By End-User | | |
      1. 9.2.1 Residential | | |
      2. 9.2.2 Commercial | | |
      3. 9.2.3 Industrial | | |
      4. 9.2.4 Agricultural | | |
      5. 9.2.5 Military & Defense | | |
      6. 9.2.6 Other End-Users | |
    3. 9.3 By Installation Type | | |
      1. 9.3.1 Professional Contractor | | |
      2. 9.3.2 Others | |
  10. 10 Competitive Landscape | |
    1. 10.1 Market Concentration Analysis | |
    2. 10.2 Competitive Benchmarking Matrix | |
    3. 10.3 Company Profiles | | |
      1. 10.3.1 Betafence | | |
      2. 10.3.2 NV Bekaert | | |
      3. 10.3.3 Ameristar Perimeter Security (ASSA ABLOY) | | |
      4. 10.3.4 Oldcastle APG (CRH) | | |
      5. 10.3.5 Master Halco | | |
      6. 10.3.6 Merchants Metals | | |
      7. 10.3.7 Jerith Manufacturing | | |
      8. 10.3.8 Gregory Industries | | |
      9. 10.3.9 Long Fence Company | | |
      10. 10.3.10 Zaun Ltd | |
  11. 11 Recent News & Developments | |
  12. 12 Report Scope and Methodology | |
  13. 13 Detailed Sources and Citations | |
  14. 14 Frequently Asked Questions (FAQs) | | LIST OF TABLES | |
  15. TABLE 1 Global Market Size & Forecast, by Revenue (USD Billion), 2021–2035 | |
  16. TABLE 2 Year-over-Year Growth Analysis, 2021–2035 | |
  17. TABLE 3 Driver Impact Analysis on CAGR, 2026–2035 | |
  18. TABLE 4 Restraints Impact Analysis on CAGR, 2026–2035 | |
  19. TABLE 5 Regional Summary, 2025 | |
  20. TABLE 6 North America Market, by Country, 2025 | |
  21. TABLE 7 Europe Market, by Country, 2025 | |
  22. TABLE 8 Asia-Pacific Market, by Country, 2025 | |
  23. TABLE 9 South America Market, by Country, 2025 | |
  24. TABLE 10 Middle East & Africa Market, by Country, 2025 | |
  25. TABLE 11 Global Market, by Material, 2025 | |
  26. TABLE 12 Global Market, by End-User, 2025 | |
  27. TABLE 13 Global Market, by Installation Type, 2025 | |
  28. TABLE 14 Competitive Benchmarking Matrix, 2025 | |
  29. TABLE 15 Report Scope and Methodology | |
  30. TABLE 16 Detailed Sources and Citations | |
  31. TABLE 17 Segmentation Quick Reference | | LIST OF FIGURES | |
  32. FIGURE 1 Market Dynamics Overview (Drivers, Restraints, Opportunities) | |
  33. FIGURE 2 Industry Value Chain Analysis | |
  34. FIGURE 3 Porter's Five Forces Analysis | |
  35. FIGURE 4 Global Market Size Trend, 2021–2035 (USD Billion) | |
  36. FIGURE 5 Market Share by Material, 2025 | |
  37. FIGURE 6 Market Share by End-User, 2025 | |
  38. FIGURE 7 Market Share by Installation Type, 2025 | |
  39. FIGURE 8 Regional Market Share, 2025 | |
  40. FIGURE 9 Country-Level Share within Key Regions, 2025 | |
  41. FIGURE 10 Competitive Landscape Positioning Map, 2025 | |
  42. FIGURE 11 Estimated Revenue Share Ranges of Key Players, 2025

Segmentation Quick Reference

DimensionSub-SegmentsDominant SegmentFastest Growing Segment
By MaterialMetal, Wood, Plastic & Composite, Concrete, Other MaterialsMetal (50.5% share)Plastic & Composite (7.29% CAGR)
By End-UserResidential, Commercial, Industrial, Agricultural, Military & Defense, Other End-UsersResidential (48.3% share)Agricultural (7.66% CAGR)
By Installation TypeProfessional Contractor, OthersProfessional Contractor (68.7% share)Others (6.92% CAGR)
By RegionNorth America, Europe, Asia-Pacific, South America, Middle East & AfricaAsia-Pacific (37.5% share)Asia-Pacific (37.5% share)


Market Segmentation Overview

By Material

Sub-SegmentKey Trend
MetalPowder-coated steel and aluminum dominate industrial, utility, and pool-code applications.
WoodPressure-treated pine is losing ground on repaint and replacement cycles.
Plastic & CompositeVinyl and wood-plastic composites gaining in humid and coastal markets
ConcretePrecast sound walls and barrier slabs along highways and rail
Other MaterialsGabion, stone, and specialty installations for landscape projects


Metal leads with a 50.5% share because steel and aluminum remain mandatory where structural rigidity and anti-ram performance are specified. Plastic & Composite grows fastest at a 7.29% CAGR as buyers in hurricane-prone and humid climates choose rot-proof panels with long warranties. Wood still holds a large installed base, but its maintenance burden keeps pushing replacements toward composites.

By End-User

Sub-SegmentKey Trend
ResidentialPrivacy screens, pet containment, and pool enclosures drive volume
CommercialData centers and retail sites specify layered, higher-value barriers.
IndustrialMining and petrochemical sites require heavy-gauge steel for safety compliance.
AgriculturalCost-share programs fund high-tensile and woven wire for rotational grazing.
Military & DefenseBorder hardening and anti-climb mesh upgrades at bases
Other End-UsersSchools, parks, and sports venues with safety-driven replacement cycles


Residential dominates with a 48.3% share, supported by steady replacement of aging backyard installations and pool-barrier code requirements. Agricultural grows fastest at a 7.66% CAGR as EQIP cost-sharing and Latin American pasture expansion fund new boundary and cross fencing. Commercial and Military & Defense buyers purchase fewer feet but at far higher specification and value per run.

By Installation Type

Sub-SegmentKey Trend
Professional ContractorTurnkey permitting, engineering, and warranty-backed installation
OthersDIY and modular kits supported by retailer guides and online configurators


Professional Contractor installations lead with a 68.7% share because commercial, public, and security projects demand permits, engineering sign-off, and artistry warranties. Others grow fastest at a 6.92% CAGR as installer shortages lengthen wait times and flat-packed aluminum and vinyl kits now meet residential wind-load provisions. The gap is narrowest in residential backyard projects, where homeowners increasingly self-install.


 

Download PDF ×

We do not share your information with anyone. However, we may send you emails based on your report interest from time to time. You may contact us at any time to opt-out.