Fatty Acid Market Segmentation
Fatty Acid Market By Source (USD Billion, 2025-2035)
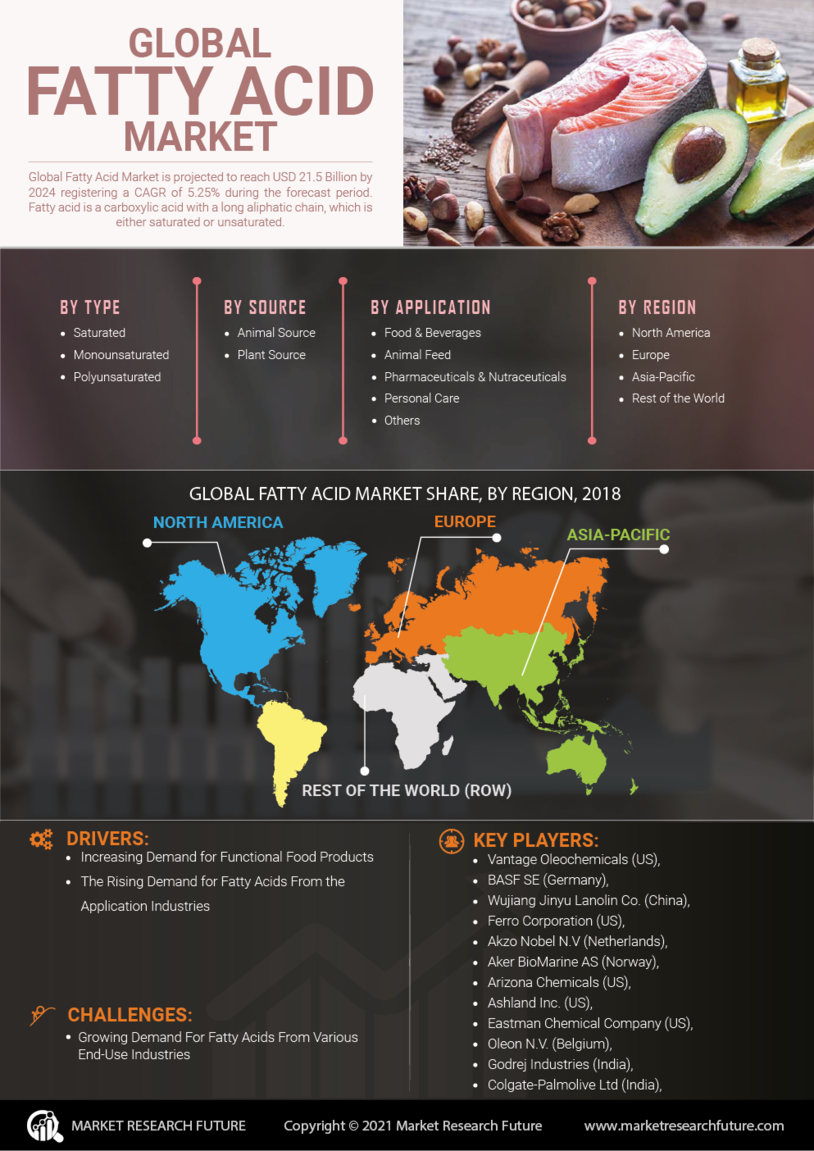
- Animal Source
- Plant Source
Fatty Acid Market By Type (USD Billion, 2025-2035)
- Saturated
- Monounsaturated
- Polyunsaturated
Fatty Acid Market By Application (USD Billion, 2025-2035)
- Food & Beverages
- Animal Feed
- Fatty Acid Markets & Nutraceuticals
- Personal Care
- Others