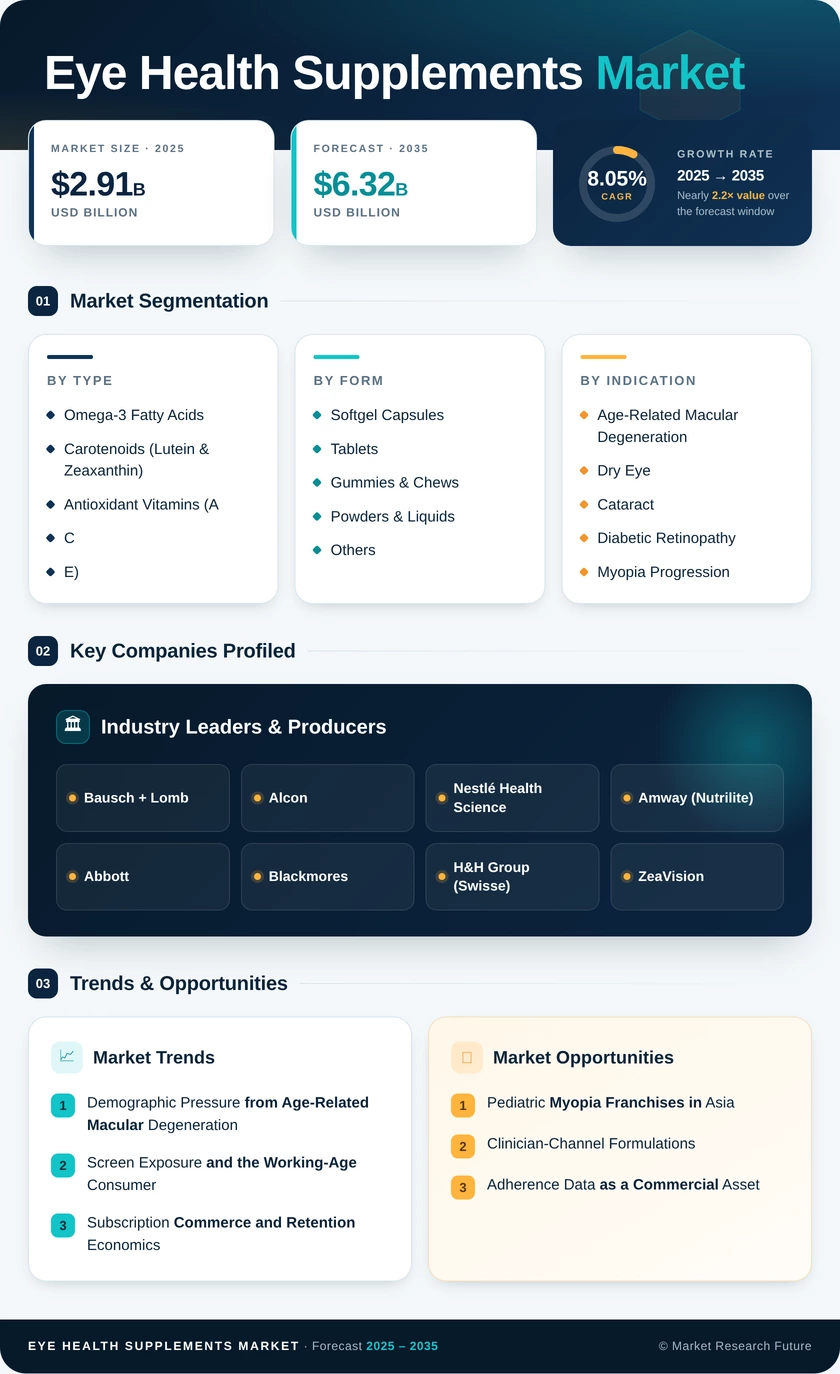
Eye Health Supplements Market (2026 - 2035)

Eye Health Supplements Market Research Report By Ingredient Type (Lutein And Zeaxanthin, Antioxidants, Omega-3 Fatty Acids, Coenzyme Q10, Flavonoids, Alpha-Lipoic Acid, Astaxanthin, and Others), By Form (Capsules, Liquid, Gummies, Softgel, And Others), By Application (Age-Related Macular Degeneration, Cataract, Glaucoma, Eye Fatigue, Corneal Support, Eyelid Conjunctivitis, and Others), By Distribution Channel (Hospital Pharmacy, Retail Pharmacy, Hypermarkets & Supermarkets, and E-Commerce), and By Region (North America, Europe, Asia-Pacific, South America, and Middle East & Africa) - Growth & Industry Forecast 2025 To 2035

Forecast Period
2026-2035
CAGR
8.05%
2025 Market Size
USD 2.91 Billion
2035 Market Size
USD 6.32 Billion
Healthcare ● Updated August 2026 Report ID: MRFR/HC/7316-CR | Pages: 183 | Author: Satyendra Maurya, Rahul Gotadki
  1. 1 Market Summary |
    1. 1.1 Study Assumptions & Market Definition |
    2. 1.2 Scope of the Study |
    3. 1.3 Research Methodology
  2. 2 Key Report Takeaways |
    1. 2.1 By Ingredient Type and Form |
    2. 2.2 By Indication and Channel |
    3. 2.3 By Geography
  3. 3 Market Size & Forecast (2021–2035) |
    1. 3.1 Historical Market Size (2021–2025) |
    2. 3.2 Current & Forecast Market Size (2026–2035) |
    3. 3.3 Year-over-Year Growth Analysis
  4. 4 Driver Impact Analysis |
    1. 4.1 Demographic Pressure from Age-Related Macular Degeneration |
    2. 4.2 Screen Exposure and the Working-Age Consumer |
    3. 4.3 Subscription Commerce and Retention Economics |
    4. 4.4 Ingredient Supply Economics
  5. 5 Restraints Impact Analysis |
    1. 5.1 Claim Substantiation Under European Scrutiny |
    2. 5.2 Thin Evidence Beyond Macular Disease |
    3. 5.3 Private-Label Erosion at Mass Retail
  6. 6 Opportunity Analysis |
    1. 6.1 Pediatric Myopia Franchises in Asia |
    2. 6.2 Clinician-Channel Formulations |
    3. 6.3 Adherence Data as a Commercial Asset |
    4. 6.4 Emerging-Market Diabetic Retinopathy Programmes |
    5. 6.5 Fermentation-Sourced Ingredient Vertical Integration |
    6. 6.6 Industry Value Chain Analysis |
    7. 6.7 Porter's Five Forces Analysis
  7. 7 Regional Market Share & Country-Level Analysis |
    1. 7.1 North America | |
      1. 7.1.1 US | |
      2. 7.1.2 Canada | |
      3. 7.1.3 Mexico |
    2. 7.2 Europe | |
      1. 7.2.1 Germany | |
      2. 7.2.2 UK | |
      3. 7.2.3 France | |
      4. 7.2.4 Italy | |
      5. 7.2.5 Spain | |
      6. 7.2.6 Nordic Countries | |
      7. 7.2.7 Russia | |
      8. 7.2.8 Rest of Europe |
    3. 7.3 Asia-Pacific | |
      1. 7.3.1 China | |
      2. 7.3.2 India | |
      3. 7.3.3 Japan | |
      4. 7.3.4 South Korea | |
      5. 7.3.5 ASEAN | |
      6. 7.3.6 Rest of Asia-Pacific |
    4. 7.4 South America | |
      1. 7.4.1 Brazil | |
      2. 7.4.2 Argentina | |
      3. 7.4.3 Rest of South America |
    5. 7.5 Middle East & Africa | |
      1. 7.5.1 Saudi Arabia | |
      2. 7.5.2 UAE | |
      3. 7.5.3 South Africa | |
      4. 7.5.4 Egypt | |
      5. 7.5.5 Rest of Middle East & Africa
  8. 8 Future Outlook (2026–2035) |
    1. 8.1 Personalised Formulation and Genotype Screening |
    2. 8.2 Retail Media and Platform Economics |
    3. 8.3 Sustainability and Marine Sourcing Disclosure |
    4. 8.4 Convergence with Ophthalmic Devices and Teleoptometry
  9. 9 Market Segmentation Analysis |
    1. 9.1 By Ingredient Type | |
      1. 9.1.1 Omega-3 Fatty Acids | |
      2. 9.1.2 Carotenoids (Lutein & Zeaxanthin) | |
      3. 9.1.3 Antioxidant Vitamins (A, C, E) | |
      4. 9.1.4 Zinc & Mineral Complexes | |
      5. 9.1.5 Herbal & Botanical Extracts | |
      6. 9.1.6 Others |
    2. 9.2 By Form | |
      1. 9.2.1 Softgel Capsules | |
      2. 9.2.2 Tablets | |
      3. 9.2.3 Gummies & Chews | |
      4. 9.2.4 Powders & Liquids | |
      5. 9.2.5 Others |
    3. 9.3 By Indication | |
      1. 9.3.1 Age-Related Macular Degeneration | |
      2. 9.3.2 Dry Eye | |
      3. 9.3.3 Cataract | |
      4. 9.3.4 Diabetic Retinopathy | |
      5. 9.3.5 Myopia Progression | |
      6. 9.3.6 Others |
    4. 9.4 By Distribution Channel | |
      1. 9.4.1 OTC Pharmacy & Drug Stores | |
      2. 9.4.2 Online Retail & DTC | |
      3. 9.4.3 Supermarkets & Hypermarkets | |
      4. 9.4.4 Specialty & Health Stores | |
      5. 9.4.5 Others |
    5. 9.5 By Age Group | |
      1. 9.5.1 Pediatric | |
      2. 9.5.2 Adults | |
      3. 9.5.3 Geriatric
  10. 10 Competitive Landscape |
    1. 10.1 Market Share Analysis (2026) |
    2. 10.2 Competitive Benchmarking Matrix |
    3. 10.3 Company Profiles | |
      1. 10.3.1 Bausch + Lomb | |
      2. 10.3.2 Alcon | |
      3. 10.3.3 Nestlé Health Science | |
      4. 10.3.4 Amway (Nutrilite) | |
      5. 10.3.5 Abbott | |
      6. 10.3.6 Blackmores | |
      7. 10.3.7 H&H Group (Swisse) | |
      8. 10.3.8 ZeaVision | |
      9. 10.3.9 DSM-Firmenich | |
      10. 10.3.10 Kemin Industries | |
      11. 10.3.11 Thorne | |
      12. 10.3.12 Nordic Naturals
  11. 11 Recent News & Developments
  12. 12 Report Scope & Methodology |
    1. 12.1 Study Period & Base Year |
    2. 12.2 Data Sources & Estimation Approach |
    3. 12.3 Abbreviations
  13. 13 Detailed Sources & Citations
  14. 14 Frequently Asked Questions
  15. 15 LIST OF TABLES |
  16. TABLE 1 Global Eye Health Supplements Market Size & Forecast, by Revenue (USD Billion), 2021–2035 |
  17. TABLE 2 Global Eye Health Supplements Market – Year-over-Year Growth Analysis, 2021–2035 |
  18. TABLE 3 Driver Impact Analysis Matrix, 2026–2035 |
  19. TABLE 4 Restraint Impact Analysis Matrix, 2026–2035 |
  20. TABLE 5 Global Market Size, by Ingredient Type, 2021–2035 (USD Billion) |
  21. TABLE 6 Global Market Size, by Form, 2021–2035 (USD Billion) |
  22. TABLE 7 Global Market Size, by Indication, 2021–2035 (USD Billion) |
  23. TABLE 8 Global Market Size, by Distribution Channel, 2021–2035 (USD Billion) |
  24. TABLE 9 Global Market Size, by Age Group, 2021–2035 (USD Billion) |
  25. TABLE 10 Global Market Size, by Region, 2021–2035 (USD Billion) |
  26. TABLE 11 North America Market Size, by Country, 2021–2035 (USD Billion) |
  27. TABLE 12 Europe Market Size, by Country, 2021–2035 (USD Billion) |
  28. TABLE 13 Asia-Pacific Market Size, by Country, 2021–2035 (USD Billion) |
  29. TABLE 14 South America Market Size, by Country, 2021–2035 (USD Billion) |
  30. TABLE 15 Middle East & Africa Market Size, by Country, 2021–2035 (USD Billion) |
  31. TABLE 16 North America Market Size, by Ingredient Type, 2021–2035 (USD Billion) |
  32. TABLE 17 North America Market Size, by Form, 2021–2035 (USD Billion) |
  33. TABLE 18 North America Market Size, by Indication, 2021–2035 (USD Billion) |
  34. TABLE 19 North America Market Size, by Distribution Channel, 2021–2035 (USD Billion) |
  35. TABLE 20 North America Market Size, by Age Group, 2021–2035 (USD Billion) |
  36. TABLE 21 Europe Market Size, by Ingredient Type, 2021–2035 (USD Billion) |
  37. TABLE 22 Europe Market Size, by Form, 2021–2035 (USD Billion) |
  38. TABLE 23 Europe Market Size, by Indication, 2021–2035 (USD Billion) |
  39. TABLE 24 Europe Market Size, by Distribution Channel, 2021–2035 (USD Billion) |
  40. TABLE 25 Europe Market Size, by Age Group, 2021–2035 (USD Billion) |
  41. TABLE 26 Asia-Pacific Market Size, by Ingredient Type, 2021–2035 (USD Billion) |
  42. TABLE 27 Asia-Pacific Market Size, by Form, 2021–2035 (USD Billion) |
  43. TABLE 28 Asia-Pacific Market Size, by Indication, 2021–2035 (USD Billion) |
  44. TABLE 29 Asia-Pacific Market Size, by Distribution Channel, 2021–2035 (USD Billion) |
  45. TABLE 30 Asia-Pacific Market Size, by Age Group, 2021–2035 (USD Billion) |
  46. TABLE 31 South America Market Size, by Ingredient Type, 2021–2035 (USD Billion) |
  47. TABLE 32 South America Market Size, by Indication, 2021–2035 (USD Billion) |
  48. TABLE 33 South America Market Size, by Distribution Channel, 2021–2035 (USD Billion) |
  49. TABLE 34 Middle East & Africa Market Size, by Ingredient Type, 2021–2035 (USD Billion) |
  50. TABLE 35 Middle East & Africa Market Size, by Indication, 2021–2035 (USD Billion) |
  51. TABLE 36 Middle East & Africa Market Size, by Distribution Channel, 2021–2035 (USD Billion) |
  52. TABLE 37 US Market Size, by Ingredient Type and Indication, 2021–2035 (USD Billion) |
  53. TABLE 38 China Market Size, by Ingredient Type and Age Group, 2021–2035 (USD Billion) |
  54. TABLE 39 Competitive Benchmarking Matrix, 2026 |
  55. TABLE 40 Company Profiles – Key Players |
  56. TABLE 41 Recent Developments & Strategic Announcements, 2023–2025 |
  57. TABLE 42 Report Scope & Methodology Summary |
  58. TABLE 43 Detailed Sources & Citations
  59. 16 LIST OF FIGURES |
  60. FIGURE 1 Market Dynamics – Drivers, Restraints and Opportunities Overview |
  61. FIGURE 2 Industry Value Chain Analysis |
  62. FIGURE 3 Porter's Five Forces Analysis |
  63. FIGURE 4 Global Market Size Trend, 2021–2035 (USD Billion) |
  64. FIGURE 5 Year-over-Year Growth Trend, 2022–2035 (%) |
  65. FIGURE 6 Market Share by Ingredient Type, 2025 vs 2035 (%) |
  66. FIGURE 7 Market Share by Form, 2025 vs 2035 (%) |
  67. FIGURE 8 Market Share by Indication, 2025 vs 2035 (%) |
  68. FIGURE 9 Market Share by Distribution Channel, 2025 vs 2035 (%) |
  69. FIGURE 10 Market Share by Age Group, 2025 vs 2035 (%) |
  70. FIGURE 11 Regional Revenue Share, 2025 (%) |
  71. FIGURE 12 Regional CAGR Comparison, 2026–2035 (%) |
  72. FIGURE 13 North America Country-Level Share, 2025 (%) |
  73. FIGURE 14 Europe Country-Level Share, 2025 (%) |
  74. FIGURE 15 Asia-Pacific Country-Level Share, 2025 (%) |
  75. FIGURE 16 South America Country-Level Share, 2025 (%) |
  76. FIGURE 17 Middle East & Africa Country-Level Share, 2025 (%) |
  77. FIGURE 18 Competitive Landscape – Estimated Revenue Share Bands, 2026 |
  78. FIGURE 19 Strategic Positioning Map – Clinical Credibility vs Channel Reach |
  79. FIGURE 20 Driver Impact Contribution to CAGR, 2026–2035
Share::
Request Free Sample

Segmentation Quick Reference

DimensionSub-SegmentsDominant SegmentFastest Growing Segment
By Ingredient TypeOmega-3 Fatty Acids; Carotenoids; Antioxidant Vitamins; Zinc & Mineral Complexes; Herbal & Botanical Extracts; OthersOmega-3 Fatty AcidsCarotenoids
By FormSoftgel Capsules; Tablets; Gummies & Chews; Powders & Liquids; OthersSoftgel CapsulesGummies & Chews
By IndicationAMD; Dry Eye; Cataract; Diabetic Retinopathy; Myopia Progression; OthersAge-Related Macular DegenerationMyopia Progression
By Distribution ChannelOTC Pharmacy & Drug Stores; Online Retail & DTC; Supermarkets & Hypermarkets; Specialty & Health Stores; OthersOTC Pharmacy & Drug StoresOnline Retail & DTC
By Age GroupPediatric; Adults; GeriatricAdultsPediatric
By GeographyNorth America; Europe; Asia-Pacific; South America; Middle East & AfricaNorth AmericaAsia-Pacific


Market Segmentation Overview

By Ingredient Type

Sub-SegmentKey Trend
Omega-3 Fatty AcidsShift from marine to fermentation-derived DHA at cost parity
Carotenoids (Lutein & Zeaxanthin)Macular pigment measurement adopted as marketing biomarker
Antioxidant Vitamins (A, C, E)Stable AREDS2 core demand with private-label pressure
Zinc & Mineral ComplexesGenotype-informed dosing entering premium tiers
Herbal & Botanical ExtractsBilberry and saffron gaining traction in Asia and Europe.
OthersAstaxanthin and NAC emerging in fatigue positioning.


Ingredient choice is increasingly a supply-chain decision rather than a formulation one. Brands that lock in fermentation-derived actives protect gross margin from marine volatility while removing the sustainability audit burden that retailers now impose.

By Form

Sub-SegmentKey Trend
Softgel CapsulesRetains delivery advantage for lipophilic actives
TabletsLowest cost per day of therapy; private-label stronghold
Gummies & ChewsPectin encapsulation closed most of the bioavailability gap.
Powders & LiquidsGeriatric swallowing difficulty drives steady niche demand.
OthersSachets and functional beverages test convenience positioning


Format is now the primary adherence lever. Because clinical benefit requires sustained use over roughly two years, any format that raises daily compliance materially improves the outcome story a brand can tell.

By Indication

Sub-SegmentKey Trend
Age-Related Macular DegenerationAnchored by established clinical protocol; share erodes slowly
Dry EyeScreen exposure and ageing tear film sustain volume.
CataractPrevention positioning constrained by thin evidence.
Diabetic RetinopathyRegistry-linked screening creates diagnosed demand.
Myopia ProgressionGovernment screening programmes generate the demand base.
OthersGlaucoma support and post-surgical recovery emerging


Indication mix determines customer lifetime value more than price does. Pediatric myopia buyers imply multi-decade horizons, while geriatric AMD cohorts typically deliver five to eight years of purchase.

By Distribution Channel

Sub-SegmentKey Trend
OTC Pharmacy & Drug StoresPharmacist recommendation remains the conversion engine
Online Retail & DTCSubscription refill cycles reshape category profit pools.
Supermarkets & HypermarketsPrivate-label programmes compress branded pricing.
Specialty & Health StoresClean-label and practitioner-adjacent premium
OthersPractice dispensing captures the highest realised price.


Channel economics are diverging sharply. Retail media costs are eroding the historical margin advantage of digital-first brands, pushing several back toward pharmacy partnerships they once bypassed.

By Age Group

Sub-SegmentKey Trend
PediatricSchool screening programmes in Asia create diagnosed cohorts
AdultsDigital eye strain broadens preventative adoption.
GeriatricClinical AMD and cataract management sustains highest per-user spend.


Age cohorts require distinct formulation, dosing and packaging strategies. Brands attempting a single portfolio across all three typically underperform specialists in each.




Share::
Request Free Sample
Download PDF ×

We do not share your information with anyone. However, we may send you emails based on your report interest from time to time. You may contact us at any time to opt-out.