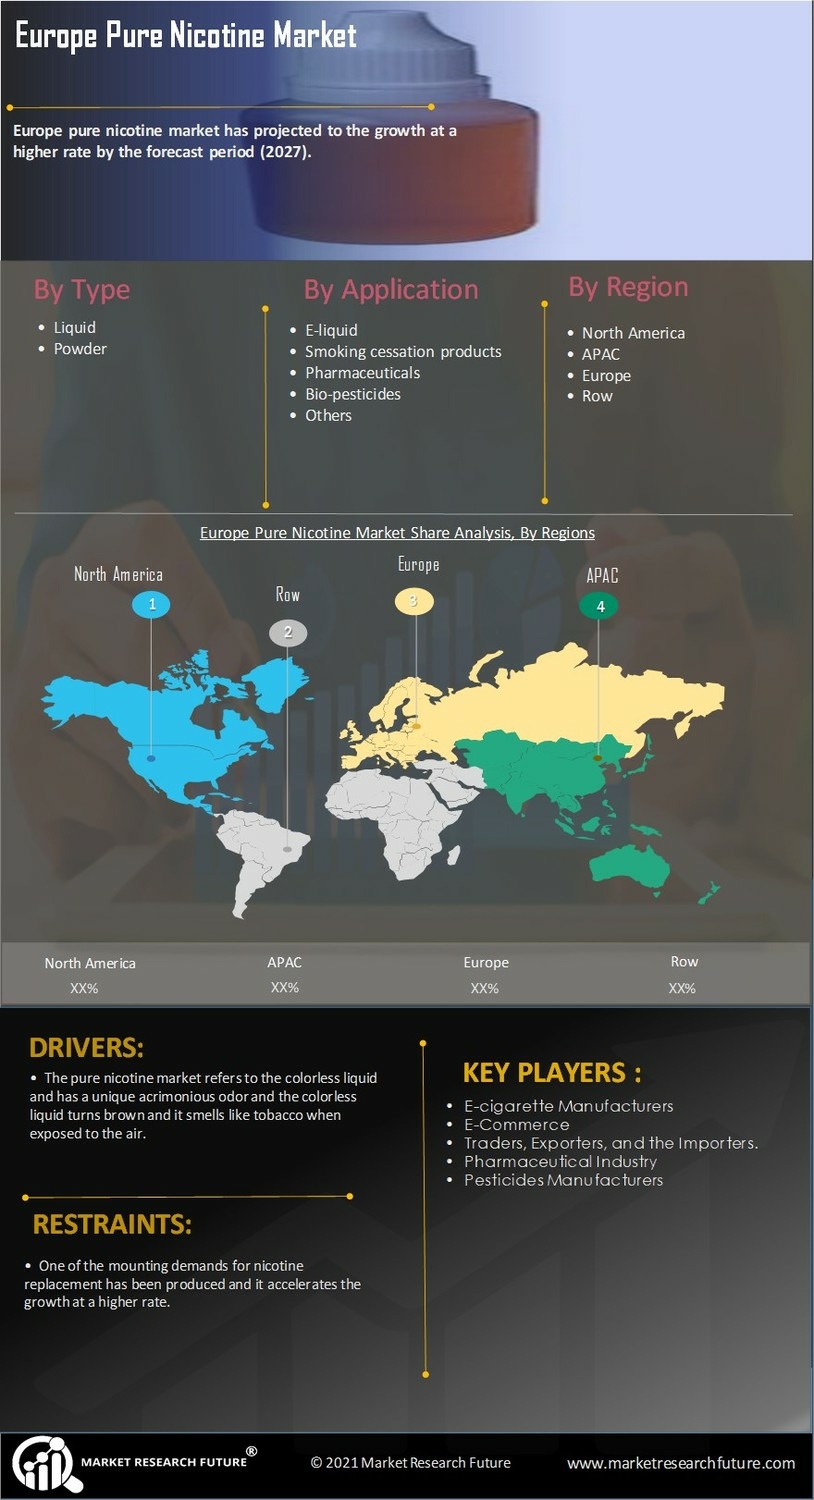
Request Free Sample ×

Kindly complete the form below to receive a free sample of this Report

* Please use a valid business email

Leading companies partner with us for data-driven Insights

clients tt-cursor
Hero Background

Europe Pure Nicotine Market

ID: MRFR/FnB/1839-CR
49 Pages
Varsha More
Last Updated: January 13, 2026

Europe Pure Nicotine Market Size, Share, Industry Trend & Analysis Research Report Information By Type (Nicotine 99%, Nicotine 99.9%, and Other), By Application (E-liquid, Bio-pesticides, and Pharmaceuticals), and By Region (North America, Europe, Asia-Pacific, and Rest Of The World) – Forecast Till 2035

Share:
Download PDF ×

We do not share your information with anyone. However, we may send you emails based on your report interest from time to time. You may contact us at any time to opt-out.

Europe Pure Nicotine Market Infographic
Purchase Options
  1. 1 SECTION I: EXECUTIVE SUMMARY AND KEY HIGHLIGHTS
    1. 1.1 EXECUTIVE SUMMARY
      1. 1.1.1 Market Overview
      2. 1.1.2 Key Findings
      3. 1.1.3 Market Segmentation
      4. 1.1.4 Competitive Landscape
      5. 1.1.5 Challenges and Opportunities
      6. 1.1.6 Future Outlook
  2. 2 SECTION II: SCOPING, METHODOLOGY AND MARKET STRUCTURE
    1. 2.1 MARKET INTRODUCTION
      1. 2.1.1 Definition
      2. 2.1.2 Scope of the study
        1. 2.1.2.1 Research Objective
        2. 2.1.2.2 Assumption
        3. 2.1.2.3 Limitations
    2. 2.2 RESEARCH METHODOLOGY
      1. 2.2.1 Overview
      2. 2.2.2 Data Mining
      3. 2.2.3 Secondary Research
      4. 2.2.4 Primary Research
        1. 2.2.4.1 Primary Interviews and Information Gathering Process
        2. 2.2.4.2 Breakdown of Primary Respondents
      5. 2.2.5 Forecasting Model
      6. 2.2.6 Market Size Estimation
        1. 2.2.6.1 Bottom-Up Approach
        2. 2.2.6.2 Top-Down Approach
      7. 2.2.7 Data Triangulation
      8. 2.2.8 Validation
  3. 3 SECTION III: QUALITATIVE ANALYSIS
    1. 3.1 MARKET DYNAMICS
      1. 3.1.1 Overview
      2. 3.1.2 Drivers
      3. 3.1.3 Restraints
      4. 3.1.4 Opportunities
    2. 3.2 MARKET FACTOR ANALYSIS
      1. 3.2.1 Value chain Analysis
      2. 3.2.2 Porter's Five Forces Analysis
        1. 3.2.2.1 Bargaining Power of Suppliers
        2. 3.2.2.2 Bargaining Power of Buyers
        3. 3.2.2.3 Threat of New Entrants
        4. 3.2.2.4 Threat of Substitutes
        5. 3.2.2.5 Intensity of Rivalry
      3. 3.2.3 COVID-19 Impact Analysis
        1. 3.2.3.1 Market Impact Analysis
        2. 3.2.3.2 Regional Impact
        3. 3.2.3.3 Opportunity and Threat Analysis
  4. 4 SECTION IV: QUANTITATIVE ANALYSIS
    1. 4.1 Food, Beverages & Nutrition, BY Application (USD Million)
      1. 4.1.1 Pharmaceuticals
      2. 4.1.2 Tobacco Products
      3. 4.1.3 E-liquids
      4. 4.1.4 Insecticides
    2. 4.2 Food, Beverages & Nutrition, BY End Use (USD Million)
      1. 4.2.1 Consumer Products
      2. 4.2.2 Industrial Applications
      3. 4.2.3 Research and Development
    3. 4.3 Food, Beverages & Nutrition, BY Formulation Type (USD Million)
      1. 4.3.1 Liquid
      2. 4.3.2 Powder
      3. 4.3.3 Crystalline
    4. 4.4 Food, Beverages & Nutrition, BY Distribution Channel (USD Million)
      1. 4.4.1 Online Retail
      2. 4.4.2 Specialty Stores
      3. 4.4.3 Wholesale
    5. 4.5 Food, Beverages & Nutrition, BY Purity Level (USD Million)
      1. 4.5.1 High Purity
      2. 4.5.2 Medium Purity
      3. 4.5.3 Low Purity
  5. 5 SECTION V: COMPETITIVE ANALYSIS
    1. 5.1 Competitive Landscape
      1. 5.1.1 Overview
      2. 5.1.2 Competitive Analysis
      3. 5.1.3 Market share Analysis
      4. 5.1.4 Major Growth Strategy in the Food, Beverages & Nutrition
      5. 5.1.5 Competitive Benchmarking
      6. 5.1.6 Leading Players in Terms of Number of Developments in the Food, Beverages & Nutrition
      7. 5.1.7 Key developments and growth strategies
        1. 5.1.7.1 New Product Launch/Service Deployment
        2. 5.1.7.2 Merger & Acquisitions
        3. 5.1.7.3 Joint Ventures
      8. 5.1.8 Major Players Financial Matrix
        1. 5.1.8.1 Sales and Operating Income
        2. 5.1.8.2 Major Players R&D Expenditure. 2023
    2. 5.2 Company Profiles
      1. 5.2.1 Nicotiana (DE)
        1. 5.2.1.1 Financial Overview
        2. 5.2.1.2 Products Offered
        3. 5.2.1.3 Key Developments
        4. 5.2.1.4 SWOT Analysis
        5. 5.2.1.5 Key Strategies
      2. 5.2.2 Altria Group (US)
        1. 5.2.2.1 Financial Overview
        2. 5.2.2.2 Products Offered
        3. 5.2.2.3 Key Developments
        4. 5.2.2.4 SWOT Analysis
        5. 5.2.2.5 Key Strategies
      3. 5.2.3 British American Tobacco (GB)
        1. 5.2.3.1 Financial Overview
        2. 5.2.3.2 Products Offered
        3. 5.2.3.3 Key Developments
        4. 5.2.3.4 SWOT Analysis
        5. 5.2.3.5 Key Strategies
      4. 5.2.4 Imperial Brands (GB)
        1. 5.2.4.1 Financial Overview
        2. 5.2.4.2 Products Offered
        3. 5.2.4.3 Key Developments
        4. 5.2.4.4 SWOT Analysis
        5. 5.2.4.5 Key Strategies
      5. 5.2.5 Japan Tobacco (JP)
        1. 5.2.5.1 Financial Overview
        2. 5.2.5.2 Products Offered
        3. 5.2.5.3 Key Developments
        4. 5.2.5.4 SWOT Analysis
        5. 5.2.5.5 Key Strategies
      6. 5.2.6 Philip Morris International (US)
        1. 5.2.6.1 Financial Overview
        2. 5.2.6.2 Products Offered
        3. 5.2.6.3 Key Developments
        4. 5.2.6.4 SWOT Analysis
        5. 5.2.6.5 Key Strategies
      7. 5.2.7 Reynolds American (US)
        1. 5.2.7.1 Financial Overview
        2. 5.2.7.2 Products Offered
        3. 5.2.7.3 Key Developments
        4. 5.2.7.4 SWOT Analysis
        5. 5.2.7.5 Key Strategies
      8. 5.2.8 Swedish Match (SE)
        1. 5.2.8.1 Financial Overview
        2. 5.2.8.2 Products Offered
        3. 5.2.8.3 Key Developments
        4. 5.2.8.4 SWOT Analysis
        5. 5.2.8.5 Key Strategies
      9. 5.2.9 Ducati (IT)
        1. 5.2.9.1 Financial Overview
        2. 5.2.9.2 Products Offered
        3. 5.2.9.3 Key Developments
        4. 5.2.9.4 SWOT Analysis
        5. 5.2.9.5 Key Strategies
    3. 5.3 Appendix
      1. 5.3.1 References
      2. 5.3.2 Related Reports
  6. 6 LIST OF FIGURES
    1. 6.1 MARKET SYNOPSIS
    2. 6.2 EUROPE MARKET ANALYSIS BY APPLICATION
    3. 6.3 EUROPE MARKET ANALYSIS BY END USE
    4. 6.4 EUROPE MARKET ANALYSIS BY FORMULATION TYPE
    5. 6.5 EUROPE MARKET ANALYSIS BY DISTRIBUTION CHANNEL
    6. 6.6 EUROPE MARKET ANALYSIS BY PURITY LEVEL
    7. 6.7 KEY BUYING CRITERIA OF FOOD, BEVERAGES & NUTRITION
    8. 6.8 RESEARCH PROCESS OF MRFR
    9. 6.9 DRO ANALYSIS OF FOOD, BEVERAGES & NUTRITION
    10. 6.10 DRIVERS IMPACT ANALYSIS: FOOD, BEVERAGES & NUTRITION
    11. 6.11 RESTRAINTS IMPACT ANALYSIS: FOOD, BEVERAGES & NUTRITION
    12. 6.12 SUPPLY / VALUE CHAIN: FOOD, BEVERAGES & NUTRITION
    13. 6.13 FOOD, BEVERAGES & NUTRITION, BY APPLICATION, 2024 (% SHARE)
    14. 6.14 FOOD, BEVERAGES & NUTRITION, BY APPLICATION, 2024 TO 2035 (USD Million)
    15. 6.15 FOOD, BEVERAGES & NUTRITION, BY END USE, 2024 (% SHARE)
    16. 6.16 FOOD, BEVERAGES & NUTRITION, BY END USE, 2024 TO 2035 (USD Million)
    17. 6.17 FOOD, BEVERAGES & NUTRITION, BY FORMULATION TYPE, 2024 (% SHARE)
    18. 6.18 FOOD, BEVERAGES & NUTRITION, BY FORMULATION TYPE, 2024 TO 2035 (USD Million)
    19. 6.19 FOOD, BEVERAGES & NUTRITION, BY DISTRIBUTION CHANNEL, 2024 (% SHARE)
    20. 6.20 FOOD, BEVERAGES & NUTRITION, BY DISTRIBUTION CHANNEL, 2024 TO 2035 (USD Million)
    21. 6.21 FOOD, BEVERAGES & NUTRITION, BY PURITY LEVEL, 2024 (% SHARE)
    22. 6.22 FOOD, BEVERAGES & NUTRITION, BY PURITY LEVEL, 2024 TO 2035 (USD Million)
    23. 6.23 BENCHMARKING OF MAJOR COMPETITORS
  7. 7 LIST OF TABLES
    1. 7.1 LIST OF ASSUMPTIONS
  8. 7.1.1
    1. 7.2 Europe MARKET SIZE ESTIMATES; FORECAST
      1. 7.2.1 BY APPLICATION, 2026-2035 (USD Million)
      2. 7.2.2 BY END USE, 2026-2035 (USD Million)
      3. 7.2.3 BY FORMULATION TYPE, 2026-2035 (USD Million)
      4. 7.2.4 BY DISTRIBUTION CHANNEL, 2026-2035 (USD Million)
      5. 7.2.5 BY PURITY LEVEL, 2026-2035 (USD Million)
    2. 7.3 PRODUCT LAUNCH/PRODUCT DEVELOPMENT/APPROVAL
  9. 7.3.1
    1. 7.4 ACQUISITION/PARTNERSHIP
  10. 7.4.1

Europe Food, Beverages & Nutrition Market Segmentation

Food, Beverages & Nutrition By Application (USD Million, 2026-2035)

  • Pharmaceuticals
  • Tobacco Products
  • E-liquids
  • Insecticides

Food, Beverages & Nutrition By End Use (USD Million, 2026-2035)

  • Consumer Products
  • Industrial Applications
  • Research and Development

Food, Beverages & Nutrition By Formulation Type (USD Million, 2026-2035)

  • Liquid
  • Powder
  • Crystalline

Food, Beverages & Nutrition By Distribution Channel (USD Million, 2026-2035)

  • Online Retail
  • Specialty Stores
  • Wholesale

Food, Beverages & Nutrition By Purity Level (USD Million, 2026-2035)

  • High Purity
  • Medium Purity
  • Low Purity

Compare Licence

×
Features License Type
Single User Multiuser License Enterprise User
Price $4,950 $5,950 $7,250
Maximum User Access Limit 1 User Upto 10 Users Unrestricted Access Throughout the Organization
Free Customization
Direct Access to Analyst
Deliverable Format
Platform Access
Discount on Next Purchase 10% 15% 15%
Printable Versions