Request Free Sample ×

Kindly complete the form below to receive a free sample of this Report

* Please use a valid business email

Leading companies partner with us for data-driven Insights

clients tt-cursor
Hero Background

Europe E Commerce Market

ID: MRFR/ICT/44623-HCR
200 Pages
Kiran Jinkalwad
Last Updated: April 06, 2026

Europe E-Commerce Market Size, Share and Trends Analysis Report By E-commerce Type (Business to Business (B2B), Business to Consumer (B2C)) and By E-commerce Application (Home Appliances, Fashion Products, Groceries, Books, Others) - Forecast to 2035

Share:
Download PDF ×

We do not share your information with anyone. However, we may send you emails based on your report interest from time to time. You may contact us at any time to opt-out.

Europe E Commerce Market Infographic
Purchase Options
  1. 1 SECTION I: EXECUTIVE SUMMARY AND KEY HIGHLIGHTS
  2.   1.1 EXECUTIVE SUMMARY
  3.     1.1.1 Market Overview
  4.     1.1.2 Key Findings
  5.     1.1.3 Market Segmentation
  6.     1.1.4 Competitive Landscape
  7.     1.1.5 Challenges and Opportunities
  8.     1.1.6 Future Outlook
  9. 2 SECTION II: SCOPING, METHODOLOGY AND MARKET STRUCTURE
  10.   2.1 MARKET INTRODUCTION
  11.     2.1.1 Definition
  12.     2.1.2 Scope of the study
  13.       2.1.2.1 Research Objective
  14.       2.1.2.2 Assumption
  15.       2.1.2.3 Limitations
  16.   2.2 RESEARCH METHODOLOGY
  17.     2.2.1 Overview
  18.     2.2.2 Data Mining
  19.     2.2.3 Secondary Research
  20.     2.2.4 Primary Research
  21.       2.2.4.1 Primary Interviews and Information Gathering Process
  22.       2.2.4.2 Breakdown of Primary Respondents
  23.     2.2.5 Forecasting Model
  24.     2.2.6 Market Size Estimation
  25.       2.2.6.1 Bottom-Up Approach
  26.       2.2.6.2 Top-Down Approach
  27.     2.2.7 Data Triangulation
  28.     2.2.8 Validation
  29. 3 SECTION III: QUALITATIVE ANALYSIS
  30.   3.1 MARKET DYNAMICS
  31.     3.1.1 Overview
  32.     3.1.2 Drivers
  33.     3.1.3 Restraints
  34.     3.1.4 Opportunities
  35.   3.2 MARKET FACTOR ANALYSIS
  36.     3.2.1 Value chain Analysis
  37.     3.2.2 Porter's Five Forces Analysis
  38.       3.2.2.1 Bargaining Power of Suppliers
  39.       3.2.2.2 Bargaining Power of Buyers
  40.       3.2.2.3 Threat of New Entrants
  41.       3.2.2.4 Threat of Substitutes
  42.       3.2.2.5 Intensity of Rivalry
  43.     3.2.3 COVID-19 Impact Analysis
  44.       3.2.3.1 Market Impact Analysis
  45.       3.2.3.2 Regional Impact
  46.       3.2.3.3 Opportunity and Threat Analysis
  47. 4 SECTION IV: QUANTITATIVE ANALYSIS
  48.   4.1 Information and Communications Technology, BY Product Type (USD Billion)
  49.     4.1.1 Clothing
  50.     4.1.2 Electronics
  51.     4.1.3 Home Goods
  52.     4.1.4 Beauty Products
  53.     4.1.5 Food and Beverages
  54.   4.2 Information and Communications Technology, BY Sales Channel (USD Billion)
  55.     4.2.1 Business to Consumer
  56.     4.2.2 Consumer to Consumer
  57.     4.2.3 Business to Business
  58.     4.2.4 Mobile Commerce
  59.     4.2.5 Social Commerce
  60.   4.3 Information and Communications Technology, BY Payment Method (USD Billion)
  61.     4.3.1 Credit Card
  62.     4.3.2 Digital Wallet
  63.     4.3.3 Bank Transfer
  64.     4.3.4 Cash on Delivery
  65.     4.3.5 Cryptocurrency
  66.   4.4 Information and Communications Technology, BY Customer Demographics (USD Billion)
  67.     4.4.1 Age Group
  68.     4.4.2 Gender
  69.     4.4.3 Income Level
  70.     4.4.4 Education Level
  71.     4.4.5 Occupation
  72.   4.5 Information and Communications Technology, BY Shopping Behavior (USD Billion)
  73.     4.5.1 Impulse Buying
  74.     4.5.2 Brand Loyalty
  75.     4.5.3 Price Sensitivity
  76.     4.5.4 Product Research
  77.     4.5.5 Sustainability Awareness
  78. 5 SECTION V: COMPETITIVE ANALYSIS
  79.   5.1 Competitive Landscape
  80.     5.1.1 Overview
  81.     5.1.2 Competitive Analysis
  82.     5.1.3 Market share Analysis
  83.     5.1.4 Major Growth Strategy in the Information and Communications Technology
  84.     5.1.5 Competitive Benchmarking
  85.     5.1.6 Leading Players in Terms of Number of Developments in the Information and Communications Technology
  86.     5.1.7 Key developments and growth strategies
  87.       5.1.7.1 New Product Launch/Service Deployment
  88.       5.1.7.2 Merger & Acquisitions
  89.       5.1.7.3 Joint Ventures
  90.     5.1.8 Major Players Financial Matrix
  91.       5.1.8.1 Sales and Operating Income
  92.       5.1.8.2 Major Players R&D Expenditure. 2023
  93.   5.2 Company Profiles
  94.     5.2.1 Amazon (GB)
  95.       5.2.1.1 Financial Overview
  96.       5.2.1.2 Products Offered
  97.       5.2.1.3 Key Developments
  98.       5.2.1.4 SWOT Analysis
  99.       5.2.1.5 Key Strategies
  100.     5.2.2 Alibaba (CN)
  101.       5.2.2.1 Financial Overview
  102.       5.2.2.2 Products Offered
  103.       5.2.2.3 Key Developments
  104.       5.2.2.4 SWOT Analysis
  105.       5.2.2.5 Key Strategies
  106.     5.2.3 eBay (GB)
  107.       5.2.3.1 Financial Overview
  108.       5.2.3.2 Products Offered
  109.       5.2.3.3 Key Developments
  110.       5.2.3.4 SWOT Analysis
  111.       5.2.3.5 Key Strategies
  112.     5.2.4 Zalando (DE)
  113.       5.2.4.1 Financial Overview
  114.       5.2.4.2 Products Offered
  115.       5.2.4.3 Key Developments
  116.       5.2.4.4 SWOT Analysis
  117.       5.2.4.5 Key Strategies
  118.     5.2.5 Otto (DE)
  119.       5.2.5.1 Financial Overview
  120.       5.2.5.2 Products Offered
  121.       5.2.5.3 Key Developments
  122.       5.2.5.4 SWOT Analysis
  123.       5.2.5.5 Key Strategies
  124.     5.2.6 Cdiscount (FR)
  125.       5.2.6.1 Financial Overview
  126.       5.2.6.2 Products Offered
  127.       5.2.6.3 Key Developments
  128.       5.2.6.4 SWOT Analysis
  129.       5.2.6.5 Key Strategies
  130.     5.2.7 Fnac (FR)
  131.       5.2.7.1 Financial Overview
  132.       5.2.7.2 Products Offered
  133.       5.2.7.3 Key Developments
  134.       5.2.7.4 SWOT Analysis
  135.       5.2.7.5 Key Strategies
  136.     5.2.8 Allegro (PL)
  137.       5.2.8.1 Financial Overview
  138.       5.2.8.2 Products Offered
  139.       5.2.8.3 Key Developments
  140.       5.2.8.4 SWOT Analysis
  141.       5.2.8.5 Key Strategies
  142.     5.2.9 Bol.com (NL)
  143.       5.2.9.1 Financial Overview
  144.       5.2.9.2 Products Offered
  145.       5.2.9.3 Key Developments
  146.       5.2.9.4 SWOT Analysis
  147.       5.2.9.5 Key Strategies
  148.     5.2.10 ASOS (GB)
  149.       5.2.10.1 Financial Overview
  150.       5.2.10.2 Products Offered
  151.       5.2.10.3 Key Developments
  152.       5.2.10.4 SWOT Analysis
  153.       5.2.10.5 Key Strategies
  154.   5.3 Appendix
  155.     5.3.1 References
  156.     5.3.2 Related Reports
  157. 6 LIST OF FIGURES
  158.   6.1 MARKET SYNOPSIS
  159.   6.2 EUROPE MARKET ANALYSIS BY PRODUCT TYPE
  160.   6.3 EUROPE MARKET ANALYSIS BY SALES CHANNEL
  161.   6.4 EUROPE MARKET ANALYSIS BY PAYMENT METHOD
  162.   6.5 EUROPE MARKET ANALYSIS BY CUSTOMER DEMOGRAPHICS
  163.   6.6 EUROPE MARKET ANALYSIS BY SHOPPING BEHAVIOR
  164.   6.7 KEY BUYING CRITERIA OF INFORMATION AND COMMUNICATIONS TECHNOLOGY
  165.   6.8 RESEARCH PROCESS OF MRFR
  166.   6.9 DRO ANALYSIS OF INFORMATION AND COMMUNICATIONS TECHNOLOGY
  167.   6.10 DRIVERS IMPACT ANALYSIS: INFORMATION AND COMMUNICATIONS TECHNOLOGY
  168.   6.11 RESTRAINTS IMPACT ANALYSIS: INFORMATION AND COMMUNICATIONS TECHNOLOGY
  169.   6.12 SUPPLY / VALUE CHAIN: INFORMATION AND COMMUNICATIONS TECHNOLOGY
  170.   6.13 INFORMATION AND COMMUNICATIONS TECHNOLOGY, BY PRODUCT TYPE, 2024 (% SHARE)
  171.   6.14 INFORMATION AND COMMUNICATIONS TECHNOLOGY, BY PRODUCT TYPE, 2024 TO 2035 (USD Billion)
  172.   6.15 INFORMATION AND COMMUNICATIONS TECHNOLOGY, BY SALES CHANNEL, 2024 (% SHARE)
  173.   6.16 INFORMATION AND COMMUNICATIONS TECHNOLOGY, BY SALES CHANNEL, 2024 TO 2035 (USD Billion)
  174.   6.17 INFORMATION AND COMMUNICATIONS TECHNOLOGY, BY PAYMENT METHOD, 2024 (% SHARE)
  175.   6.18 INFORMATION AND COMMUNICATIONS TECHNOLOGY, BY PAYMENT METHOD, 2024 TO 2035 (USD Billion)
  176.   6.19 INFORMATION AND COMMUNICATIONS TECHNOLOGY, BY CUSTOMER DEMOGRAPHICS, 2024 (% SHARE)
  177.   6.20 INFORMATION AND COMMUNICATIONS TECHNOLOGY, BY CUSTOMER DEMOGRAPHICS, 2024 TO 2035 (USD Billion)
  178.   6.21 INFORMATION AND COMMUNICATIONS TECHNOLOGY, BY SHOPPING BEHAVIOR, 2024 (% SHARE)
  179.   6.22 INFORMATION AND COMMUNICATIONS TECHNOLOGY, BY SHOPPING BEHAVIOR, 2024 TO 2035 (USD Billion)
  180.   6.23 BENCHMARKING OF MAJOR COMPETITORS
  181. 7 LIST OF TABLES
  182.   7.1 LIST OF ASSUMPTIONS
  183.     7.1.1
  184.   7.2 Europe MARKET SIZE ESTIMATES; FORECAST
  185.     7.2.1 BY PRODUCT TYPE, 2026-2035 (USD Billion)
  186.     7.2.2 BY SALES CHANNEL, 2026-2035 (USD Billion)
  187.     7.2.3 BY PAYMENT METHOD, 2026-2035 (USD Billion)
  188.     7.2.4 BY CUSTOMER DEMOGRAPHICS, 2026-2035 (USD Billion)
  189.     7.2.5 BY SHOPPING BEHAVIOR, 2026-2035 (USD Billion)
  190.   7.3 PRODUCT LAUNCH/PRODUCT DEVELOPMENT/APPROVAL
  191.     7.3.1
  192.   7.4 ACQUISITION/PARTNERSHIP
  193.     7.4.1

Europe Information and Communications Technology Market Segmentation

Information and Communications Technology By Product Type (USD Billion, 2022-2035)
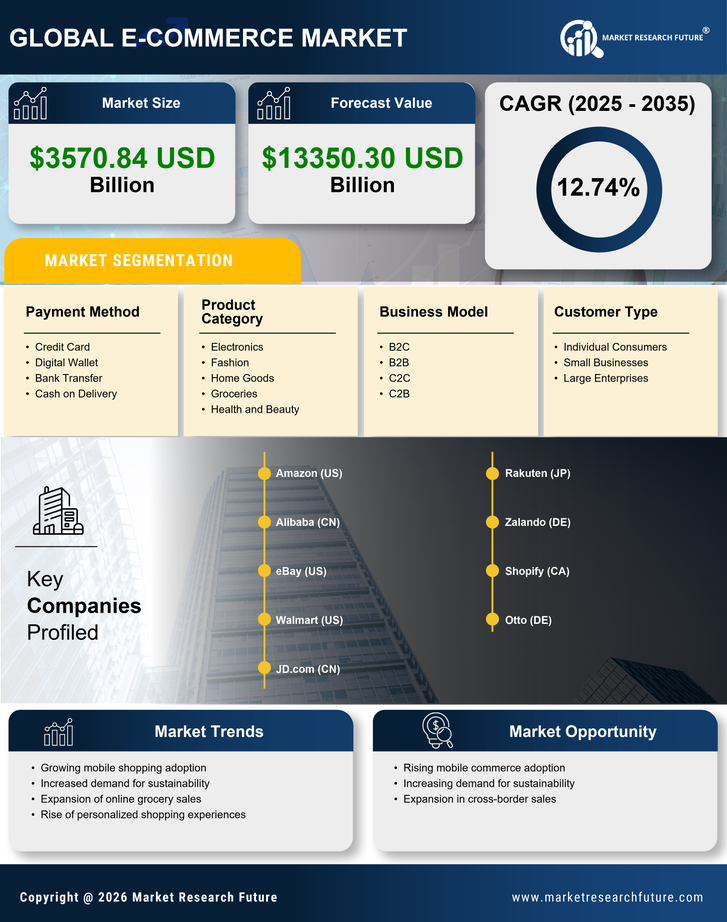
  • Clothing
  • Electronics
  • Home Goods
  • Beauty Products
  • Food and Beverages

Information and Communications Technology By Sales Channel (USD Billion, 2022-2035)

  • Business to Consumer
  • Consumer to Consumer
  • Business to Business
  • Mobile Commerce
  • Social Commerce

Information and Communications Technology By Payment Method (USD Billion, 2022-2035)

  • Credit Card
  • Digital Wallet
  • Bank Transfer
  • Cash on Delivery
  • Cryptocurrency

Information and Communications Technology By Customer Demographics (USD Billion, 2022-2035)

  • Age Group
  • Gender
  • Income Level
  • Education Level
  • Occupation

Information and Communications Technology By Shopping Behavior (USD Billion, 2022-2035)

  • Impulse Buying
  • Brand Loyalty
  • Price Sensitivity
  • Product Research
  • Sustainability Awareness

Compare Licence

×
Features License Type
Single User Multiuser License Enterprise User
Price $4,950 $5,950 $7,250
Maximum User Access Limit 1 User Upto 10 Users Unrestricted Access Throughout the Organization
Free Customization
Direct Access to Analyst
Deliverable Format
Platform Access
Discount on Next Purchase 10% 15% 15%
Printable Versions