Europe AI Data Management Market

ID: MRFR/ICT/57003-HCR
200 Pages
Kiran Jinkalwad
Last Updated: February 06, 2026
Europe AI Data Management Market Size, Share and Research Report: By Application (Data Integration, Data Governance, Data Quality Management, Data Warehousing, Data Security), By Deployment Type (On-Premises, Cloud-Based, Hybrid), By End User (BFSI, Healthcare, Retail, IT and Telecommunications, Manufacturing), By Size of Organization (Small Enterprises, Medium Enterprises, Large Enterprises) and By Regional (Germany, UK, France, Russia, Italy, Spain, Rest of Europe)-Forecast to 2035
Download PDF ×

We do not share your information with anyone. However, we may send you emails based on your report interest from time to time. You may contact us at any time to opt-out.

Europe AI Data Management Market

Market Size

Forecast Period2025 - 2035
CAGR (2025 - 2035)16.97%
2024 Market Size$ 6.42 Billion
2025 Market Size$ 7.51 Billion
2035 Market Size$ 36 Billion

Key Players

IBM
Microsoft
Oracle
SAP
Google
Amazon
Opportunities
  • Increased Focus on Data Quality
  • Rising Demand for Data Analytics
  • Emergence of Cloud-Based Solutions
  1. 1 SECTION I: EXECUTIVE SUMMARY AND KEY HIGHLIGHTS
    1. 1.1 EXECUTIVE SUMMARY
      1. 1.1.1 Market Overview
      2. 1.1.2 Key Findings
      3. 1.1.3 Market Segmentation
      4. 1.1.4 Competitive Landscape
      5. 1.1.5 Challenges and Opportunities
      6. 1.1.6 Future Outlook
  2. 2 SECTION II: SCOPING, METHODOLOGY AND MARKET STRUCTURE
    1. 2.1 MARKET INTRODUCTION
      1. 2.1.1 Definition
      2. 2.1.2 Scope of the study
        1. 2.1.2.1 Research Objective
        2. 2.1.2.2 Assumption
        3. 2.1.2.3 Limitations
    2. 2.2 RESEARCH METHODOLOGY
      1. 2.2.1 Overview
      2. 2.2.2 Data Mining
      3. 2.2.3 Secondary Research
      4. 2.2.4 Primary Research
        1. 2.2.4.1 Primary Interviews and Information Gathering Process
        2. 2.2.4.2 Breakdown of Primary Respondents
      5. 2.2.5 Forecasting Model
      6. 2.2.6 Market Size Estimation
        1. 2.2.6.1 Bottom-Up Approach
        2. 2.2.6.2 Top-Down Approach
      7. 2.2.7 Data Triangulation
      8. 2.2.8 Validation
  3. 3 SECTION III: QUALITATIVE ANALYSIS
    1. 3.1 MARKET DYNAMICS
      1. 3.1.1 Overview
      2. 3.1.2 Drivers
      3. 3.1.3 Restraints
      4. 3.1.4 Opportunities
    2. 3.2 MARKET FACTOR ANALYSIS
      1. 3.2.1 Value chain Analysis
      2. 3.2.2 Porter's Five Forces Analysis
        1. 3.2.2.1 Bargaining Power of Suppliers
        2. 3.2.2.2 Bargaining Power of Buyers
        3. 3.2.2.3 Threat of New Entrants
        4. 3.2.2.4 Threat of Substitutes
        5. 3.2.2.5 Intensity of Rivalry
      3. 3.2.3 COVID-19 Impact Analysis
        1. 3.2.3.1 Market Impact Analysis
        2. 3.2.3.2 Regional Impact
        3. 3.2.3.3 Opportunity and Threat Analysis
  4. 4 SECTION IV: QUANTITATIVE ANALYSIS
    1. 4.1 Information and Communications Technology, BY Application (USD Billion)
      1. 4.1.1 Data Integration
      2. 4.1.2 Data Governance
      3. 4.1.3 Data Quality
      4. 4.1.4 Data Security
      5. 4.1.5 Data Analytics
    2. 4.2 Information and Communications Technology, BY Deployment Model (USD Billion)
      1. 4.2.1 On-Premises
      2. 4.2.2 Cloud-Based
      3. 4.2.3 Hybrid
    3. 4.3 Information and Communications Technology, BY End User (USD Billion)
      1. 4.3.1 Large Enterprises
      2. 4.3.2 Small and Medium Enterprises
      3. 4.3.3 Government Organizations
      4. 4.3.4 Healthcare Institutions
    4. 4.4 Information and Communications Technology, BY Data Type (USD Billion)
      1. 4.4.1 Structured Data
      2. 4.4.2 Unstructured Data
      3. 4.4.3 Semi-Structured Data
    5. 4.5 Information and Communications Technology, BY Technology (USD Billion)
      1. 4.5.1 Machine Learning
      2. 4.5.2 Natural Language Processing
      3. 4.5.3 Data Warehousing
      4. 4.5.4 Data Lakes
  5. 5 SECTION V: COMPETITIVE ANALYSIS
    1. 5.1 Competitive Landscape
      1. 5.1.1 Overview
      2. 5.1.2 Competitive Analysis
      3. 5.1.3 Market share Analysis
      4. 5.1.4 Major Growth Strategy in the Information and Communications Technology
      5. 5.1.5 Competitive Benchmarking
      6. 5.1.6 Leading Players in Terms of Number of Developments in the Information and Communications Technology
      7. 5.1.7 Key developments and growth strategies
        1. 5.1.7.1 New Product Launch/Service Deployment
        2. 5.1.7.2 Merger & Acquisitions
        3. 5.1.7.3 Joint Ventures
      8. 5.1.8 Major Players Financial Matrix
        1. 5.1.8.1 Sales and Operating Income
        2. 5.1.8.2 Major Players R&D Expenditure. 2023
    2. 5.2 Company Profiles
      1. 5.2.1 SAP (DE)
        1. 5.2.1.1 Financial Overview
        2. 5.2.1.2 Products Offered
        3. 5.2.1.3 Key Developments
        4. 5.2.1.4 SWOT Analysis
        5. 5.2.1.5 Key Strategies
      2. 5.2.2 IBM (US)
        1. 5.2.2.1 Financial Overview
        2. 5.2.2.2 Products Offered
        3. 5.2.2.3 Key Developments
        4. 5.2.2.4 SWOT Analysis
        5. 5.2.2.5 Key Strategies
      3. 5.2.3 Microsoft (GB)
        1. 5.2.3.1 Financial Overview
        2. 5.2.3.2 Products Offered
        3. 5.2.3.3 Key Developments
        4. 5.2.3.4 SWOT Analysis
        5. 5.2.3.5 Key Strategies
      4. 5.2.4 Oracle (US)
        1. 5.2.4.1 Financial Overview
        2. 5.2.4.2 Products Offered
        3. 5.2.4.3 Key Developments
        4. 5.2.4.4 SWOT Analysis
        5. 5.2.4.5 Key Strategies
      5. 5.2.5 SAS (US)
        1. 5.2.5.1 Financial Overview
        2. 5.2.5.2 Products Offered
        3. 5.2.5.3 Key Developments
        4. 5.2.5.4 SWOT Analysis
        5. 5.2.5.5 Key Strategies
      6. 5.2.6 Talend (FR)
        1. 5.2.6.1 Financial Overview
        2. 5.2.6.2 Products Offered
        3. 5.2.6.3 Key Developments
        4. 5.2.6.4 SWOT Analysis
        5. 5.2.6.5 Key Strategies
      7. 5.2.7 Informatica (US)
        1. 5.2.7.1 Financial Overview
        2. 5.2.7.2 Products Offered
        3. 5.2.7.3 Key Developments
        4. 5.2.7.4 SWOT Analysis
        5. 5.2.7.5 Key Strategies
      8. 5.2.8 Snowflake (US)
        1. 5.2.8.1 Financial Overview
        2. 5.2.8.2 Products Offered
        3. 5.2.8.3 Key Developments
        4. 5.2.8.4 SWOT Analysis
        5. 5.2.8.5 Key Strategies
      9. 5.2.9 DataRobot (US)
        1. 5.2.9.1 Financial Overview
        2. 5.2.9.2 Products Offered
        3. 5.2.9.3 Key Developments
        4. 5.2.9.4 SWOT Analysis
        5. 5.2.9.5 Key Strategies
    3. 5.3 Appendix
      1. 5.3.1 References
      2. 5.3.2 Related Reports
  6. 6 LIST OF FIGURES
    1. 6.1 MARKET SYNOPSIS
    2. 6.2 EUROPE MARKET ANALYSIS BY APPLICATION
    3. 6.3 EUROPE MARKET ANALYSIS BY DEPLOYMENT MODEL
    4. 6.4 EUROPE MARKET ANALYSIS BY END USER
    5. 6.5 EUROPE MARKET ANALYSIS BY DATA TYPE
    6. 6.6 EUROPE MARKET ANALYSIS BY TECHNOLOGY
    7. 6.7 KEY BUYING CRITERIA OF INFORMATION AND COMMUNICATIONS TECHNOLOGY
    8. 6.8 RESEARCH PROCESS OF MRFR
    9. 6.9 DRO ANALYSIS OF INFORMATION AND COMMUNICATIONS TECHNOLOGY
    10. 6.10 DRIVERS IMPACT ANALYSIS: INFORMATION AND COMMUNICATIONS TECHNOLOGY
    11. 6.11 RESTRAINTS IMPACT ANALYSIS: INFORMATION AND COMMUNICATIONS TECHNOLOGY
    12. 6.12 SUPPLY / VALUE CHAIN: INFORMATION AND COMMUNICATIONS TECHNOLOGY
    13. 6.13 INFORMATION AND COMMUNICATIONS TECHNOLOGY, BY APPLICATION, 2024 (% SHARE)
    14. 6.14 INFORMATION AND COMMUNICATIONS TECHNOLOGY, BY APPLICATION, 2024 TO 2035 (USD Billion)
    15. 6.15 INFORMATION AND COMMUNICATIONS TECHNOLOGY, BY DEPLOYMENT MODEL, 2024 (% SHARE)
    16. 6.16 INFORMATION AND COMMUNICATIONS TECHNOLOGY, BY DEPLOYMENT MODEL, 2024 TO 2035 (USD Billion)
    17. 6.17 INFORMATION AND COMMUNICATIONS TECHNOLOGY, BY END USER, 2024 (% SHARE)
    18. 6.18 INFORMATION AND COMMUNICATIONS TECHNOLOGY, BY END USER, 2024 TO 2035 (USD Billion)
    19. 6.19 INFORMATION AND COMMUNICATIONS TECHNOLOGY, BY DATA TYPE, 2024 (% SHARE)
    20. 6.20 INFORMATION AND COMMUNICATIONS TECHNOLOGY, BY DATA TYPE, 2024 TO 2035 (USD Billion)
    21. 6.21 INFORMATION AND COMMUNICATIONS TECHNOLOGY, BY TECHNOLOGY, 2024 (% SHARE)
    22. 6.22 INFORMATION AND COMMUNICATIONS TECHNOLOGY, BY TECHNOLOGY, 2024 TO 2035 (USD Billion)
    23. 6.23 BENCHMARKING OF MAJOR COMPETITORS
  7. 7 LIST OF TABLES
    1. 7.1 LIST OF ASSUMPTIONS
  8. 7.1.1
    1. 7.2 Europe MARKET SIZE ESTIMATES; FORECAST
      1. 7.2.1 BY APPLICATION, 2026-2035 (USD Billion)
      2. 7.2.2 BY DEPLOYMENT MODEL, 2026-2035 (USD Billion)
      3. 7.2.3 BY END USER, 2026-2035 (USD Billion)
      4. 7.2.4 BY DATA TYPE, 2026-2035 (USD Billion)
      5. 7.2.5 BY TECHNOLOGY, 2026-2035 (USD Billion)
    2. 7.3 PRODUCT LAUNCH/PRODUCT DEVELOPMENT/APPROVAL
  9. 7.3.1
    1. 7.4 ACQUISITION/PARTNERSHIP
  10. 7.4.1

Europe Europe AI Data Management Market Segmentation

Europe AI Data Management Market By Application (USD Billion, 2022-2035)
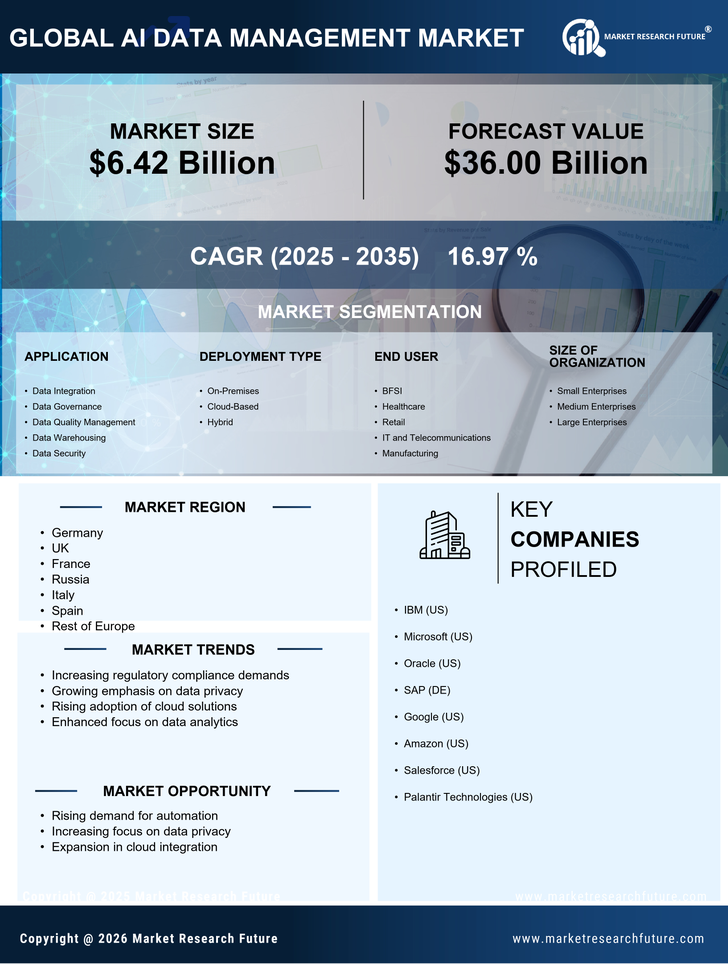
  • Data Integration
  • Data Governance
  • Data Quality
  • Data Security
  • Data Analytics

Europe AI Data Management Market By Deployment Model (USD Billion, 2022-2035)

  • On-Premises
  • Cloud-Based
  • Hybrid

Europe AI Data Management Market By End User (USD Billion, 2022-2035)

  • Large Enterprises
  • Small and Medium Enterprises
  • Government Organizations
  • Healthcare Institutions

Europe AI Data Management Market By Data Type (USD Billion, 2022-2035)

  • Structured Data
  • Unstructured Data
  • Semi-Structured Data

Europe AI Data Management Market By Technology (USD Billion, 2022-2035)

  • Machine Learning
  • Natural Language Processing
  • Data Warehousing
  • Data Lakes